
The Chinese battery industry demonstrated robust growth in the first half of 2024, with power battery installations reaching 203.3 GWh – a 33.7% year-over-year surge. This expansion mirrors the rapid adoption of new energy vehicles (NEVs), where production and sales exceeded 4.9 million units, achieving a 35.2% market penetration rate. Notably, June witnessed NEVs capturing 41.1% of total vehicle sales, underscoring the sector’s momentum.
Battery Chemistry Dynamics
Phosphate iron lithium (LFP) batteries maintained dominance with 141 GWh installations (69.3% share), while ternary lithium (NCM/NCA) accounted for 62.3 GWh (30.6%). The growth differential narrowed significantly compared to previous years:
$$ \text{LFP Growth Rate} = 35.7\% \quad \text{vs} \quad \text{NCM Growth Rate} = 29.7\% $$
| Battery Type | 2024 H1 Installations (GWh) | Market Share |
|---|---|---|
| LFP | 141.0 | 69.32% |
| Ternary | 62.3 | 30.63% |
Emerging technologies made initial market entries:
– Semi-solid-state batteries: 2.15 GWh (Blue Solutions)
– Sodium-ion batteries: 1.5 MWh (CATL, Farasis, HiNa)
Vehicle Segment Analysis
The battery allocation pattern reveals shifting market preferences:
| Vehicle Type | Battery Allocation | YoY Growth |
|---|---|---|
| BEV Passenger | 66.6% | 16.3% |
| PHEV Passenger | 21.9% | 88.8% |
| BEV Commercial | 10.4% | 116.4% |
$$ \text{PHEV Growth Factor} = \frac{88.8\%}{16.3\%} \approx 5.45 $$
Market Concentration Trends
While industry consolidation remains significant, the CR3 ratio slightly declined to 77.5%:
| Rank | Company | Installations (GWh) | Market Share |
|---|---|---|---|
| 1 | CATL | 93.31 | 46.38% |
| 2 | BYD | 50.51 | 25.10% |
| 3 | CALB | 13.83 | 6.87% |
$$ \text{CR3} = 46.38\% + 25.10\% + 6.87\% = 78.35\% $$
Energy Storage: The New Frontier
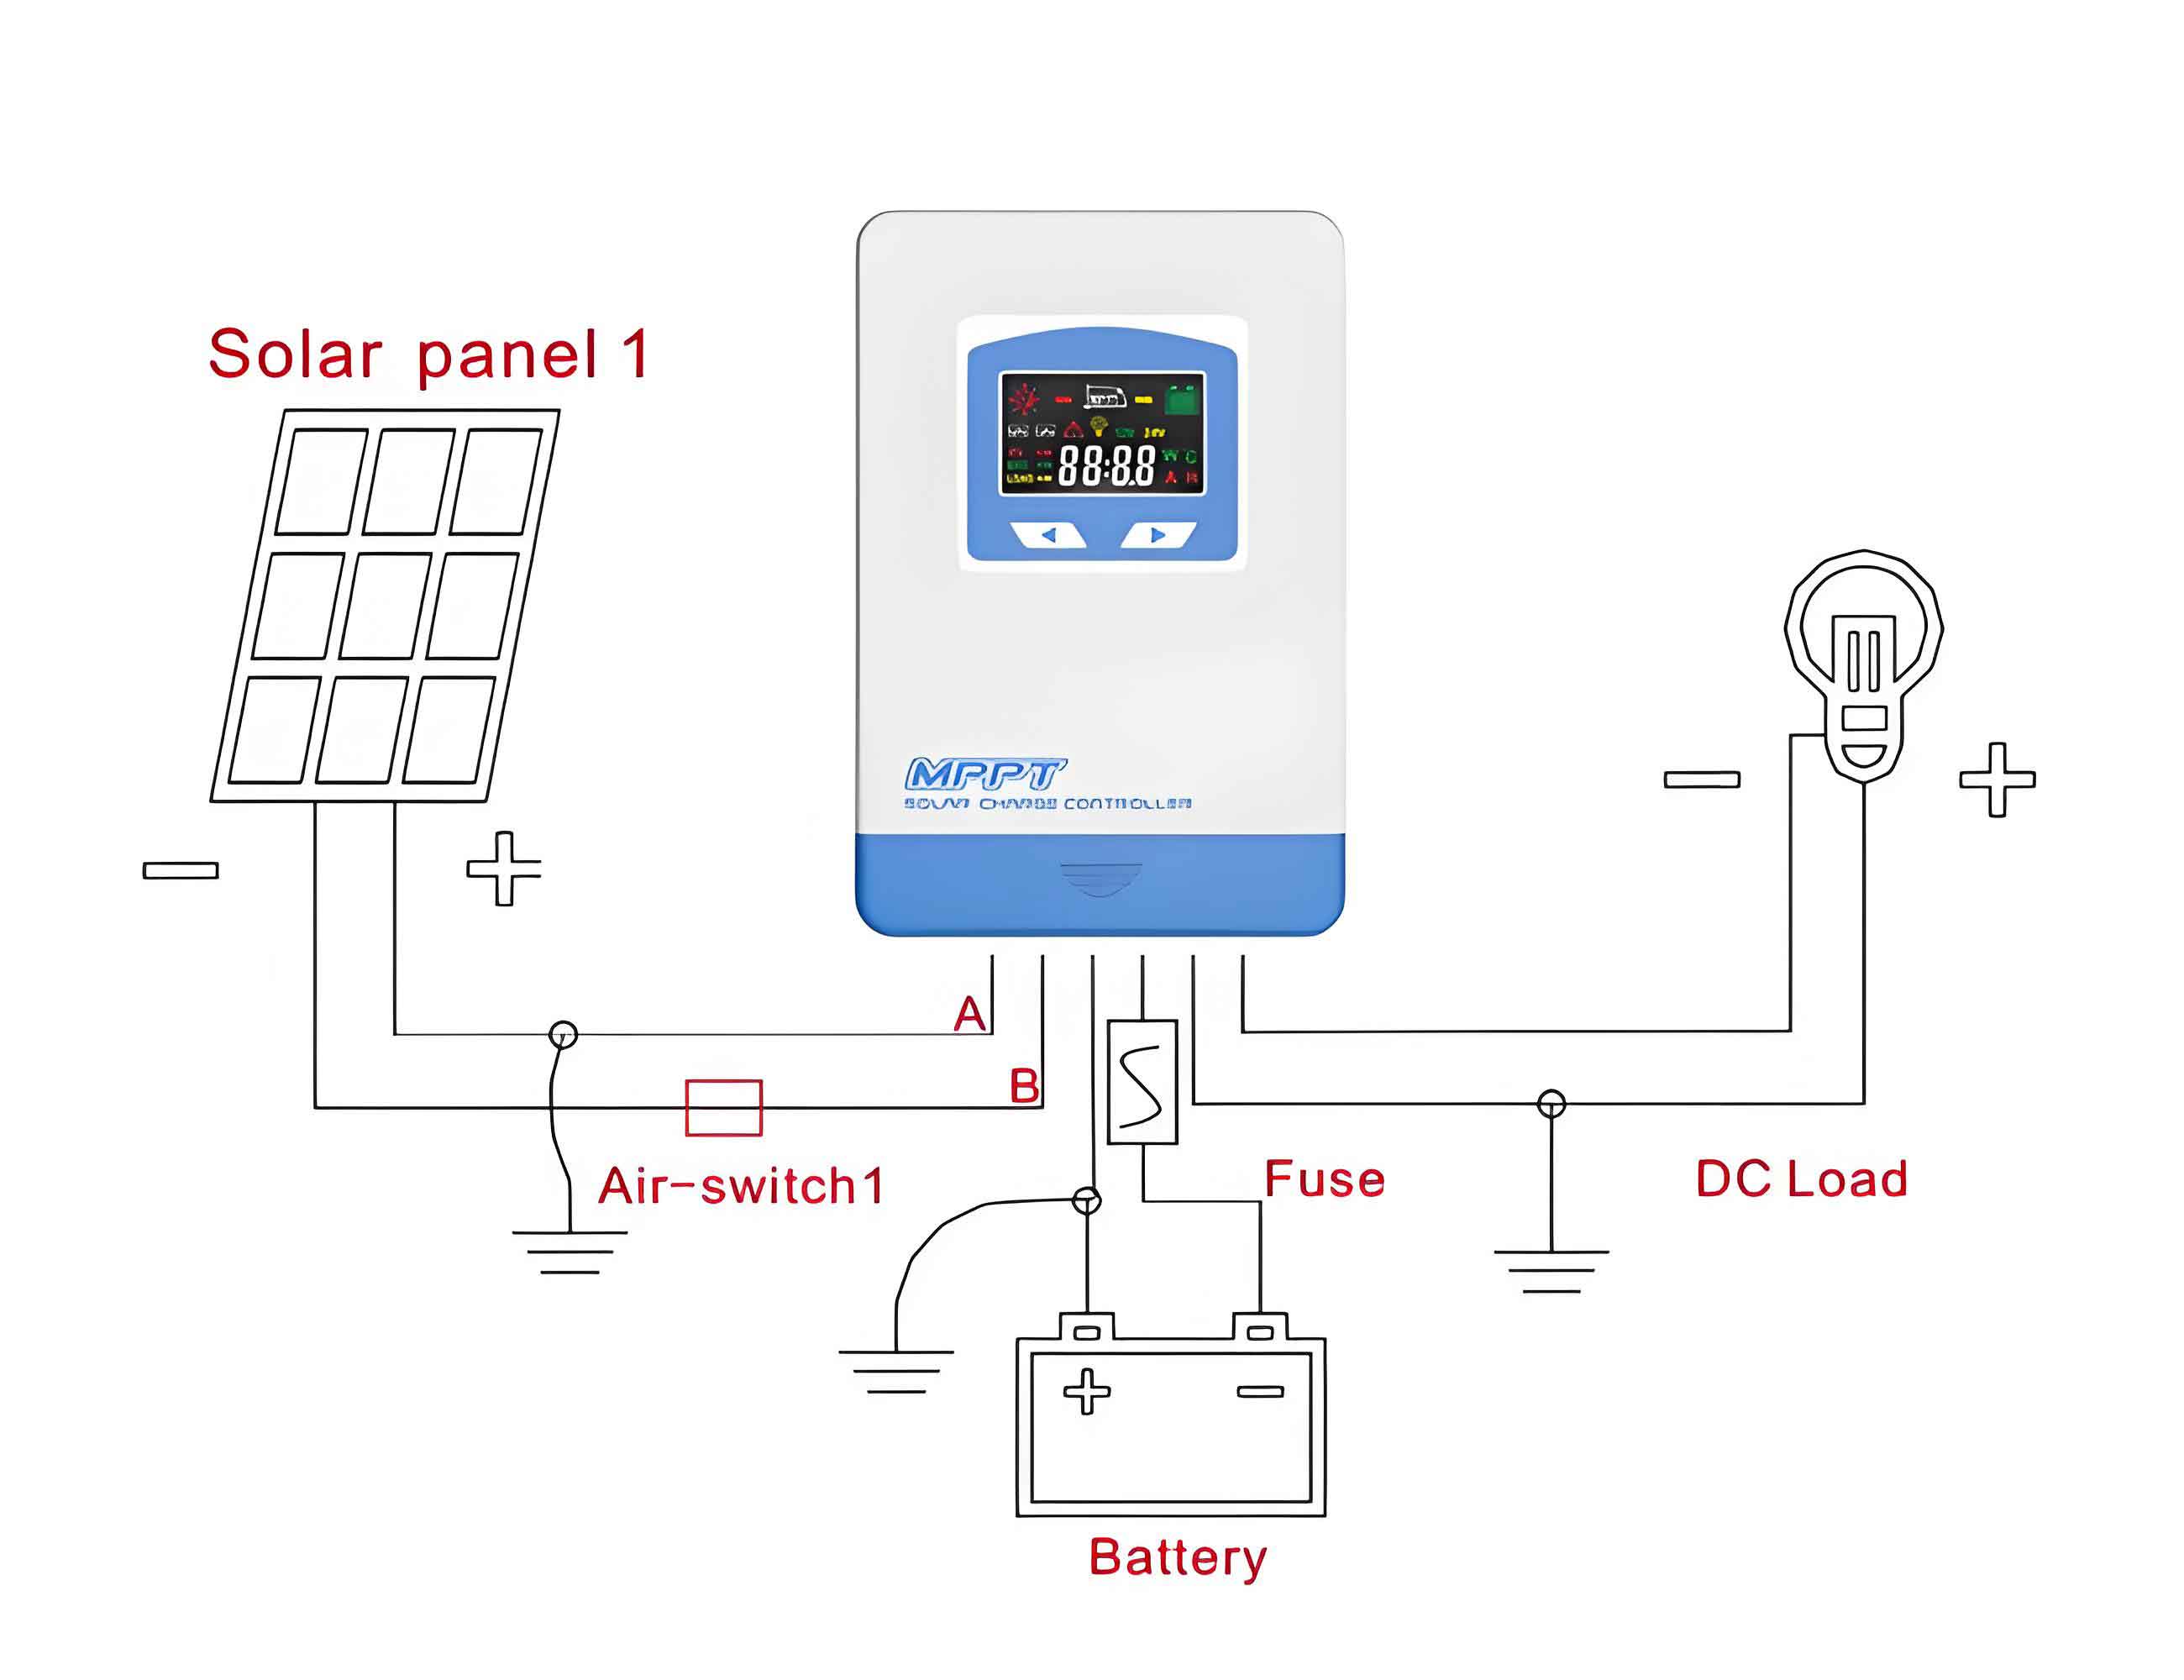
Non-automotive battery demand surged 137.3% to 84.5 GWh, driven by energy storage systems (ESS). Advanced MPPT (Maximum Power Point Tracking) technologies enhance ESS efficiency through dynamic optimization:
$$ P_{\text{max}} = V_{\text{mp}} \times I_{\text{mp}} $$
Where $P_{\text{max}}$ represents maximum power output, $V_{\text{mp}}$ the optimal voltage, and $I_{\text{mp}}$ the corresponding current. Leading battery makers report ESS contributing 15%-35% of total revenues.
| Company | ESS Revenue Share | YoY Growth |
|---|---|---|
| CATL | 14.9% | 87% |
| EVE Energy | 33.5% | 212% |
| Gotion High-tech | 21.9% | 145% |
MPPT algorithms demonstrate significant efficiency gains in photovoltaic storage systems:
$$ \eta_{\text{MPPT}} = \frac{P_{\text{out}}}{P_{\text{in}}} \times 100\% $$
Where $\eta_{\text{MPPT}}$ denotes conversion efficiency, typically exceeding 98% in modern implementations.
Global Trade Dynamics
Battery exports grew 18.6% to 73.7 GWh, with ESS components showing exceptional momentum:
| Category | Export Volume | Growth Rate |
|---|---|---|
| Power Batteries | 60.0 GWh | 8.2% |
| ESS Batteries | 13.6 GWh | 106.7% |
$$ \text{ESS Export Momentum} = \frac{106.7\%}{8.2\%} \approx 13.0 $$
The integration of MPPT controllers in export-oriented ESS products has become a key differentiator, enabling Chinese manufacturers to capture 62% of global ESS market share. This technological edge complements China’s cost leadership in battery production, creating a formidable competitive advantage.
As the industry evolves, MPPT-enabled smart storage systems and fast-charging LFP batteries are reshaping both automotive and energy infrastructure landscapes. The convergence of vehicle-to-grid (V2G) technologies with advanced MPPT algorithms promises to unlock new value streams in renewable energy integration and grid stability management.