
The imperative for grid stability and the economic integration of renewable energy sources have propelled energy storage systems to the forefront of modern power system planning. Among various technologies, lithium iron phosphate (lifepo4 battery) energy storage has gained significant traction due to its inherent safety, long cycle life, and decreasing cost. The operational strategy of a lifepo4 battery storage station, particularly the scheduling of charge and discharge power in response to time-of-use electricity tariffs, is critical for maximizing economic returns, ensuring system longevity, and maintaining operational efficiency. Suboptimal strategies can lead to accelerated battery degradation, reduced round-trip efficiency, and diminished financial viability. This article details a comprehensive study conducted on a grid-connected lifepo4 battery storage station, involving experimental analysis under different power ratings and the subsequent development of an optimized “two-charge, two-discharge” strategy tailored for peak-valley price arbitrage.
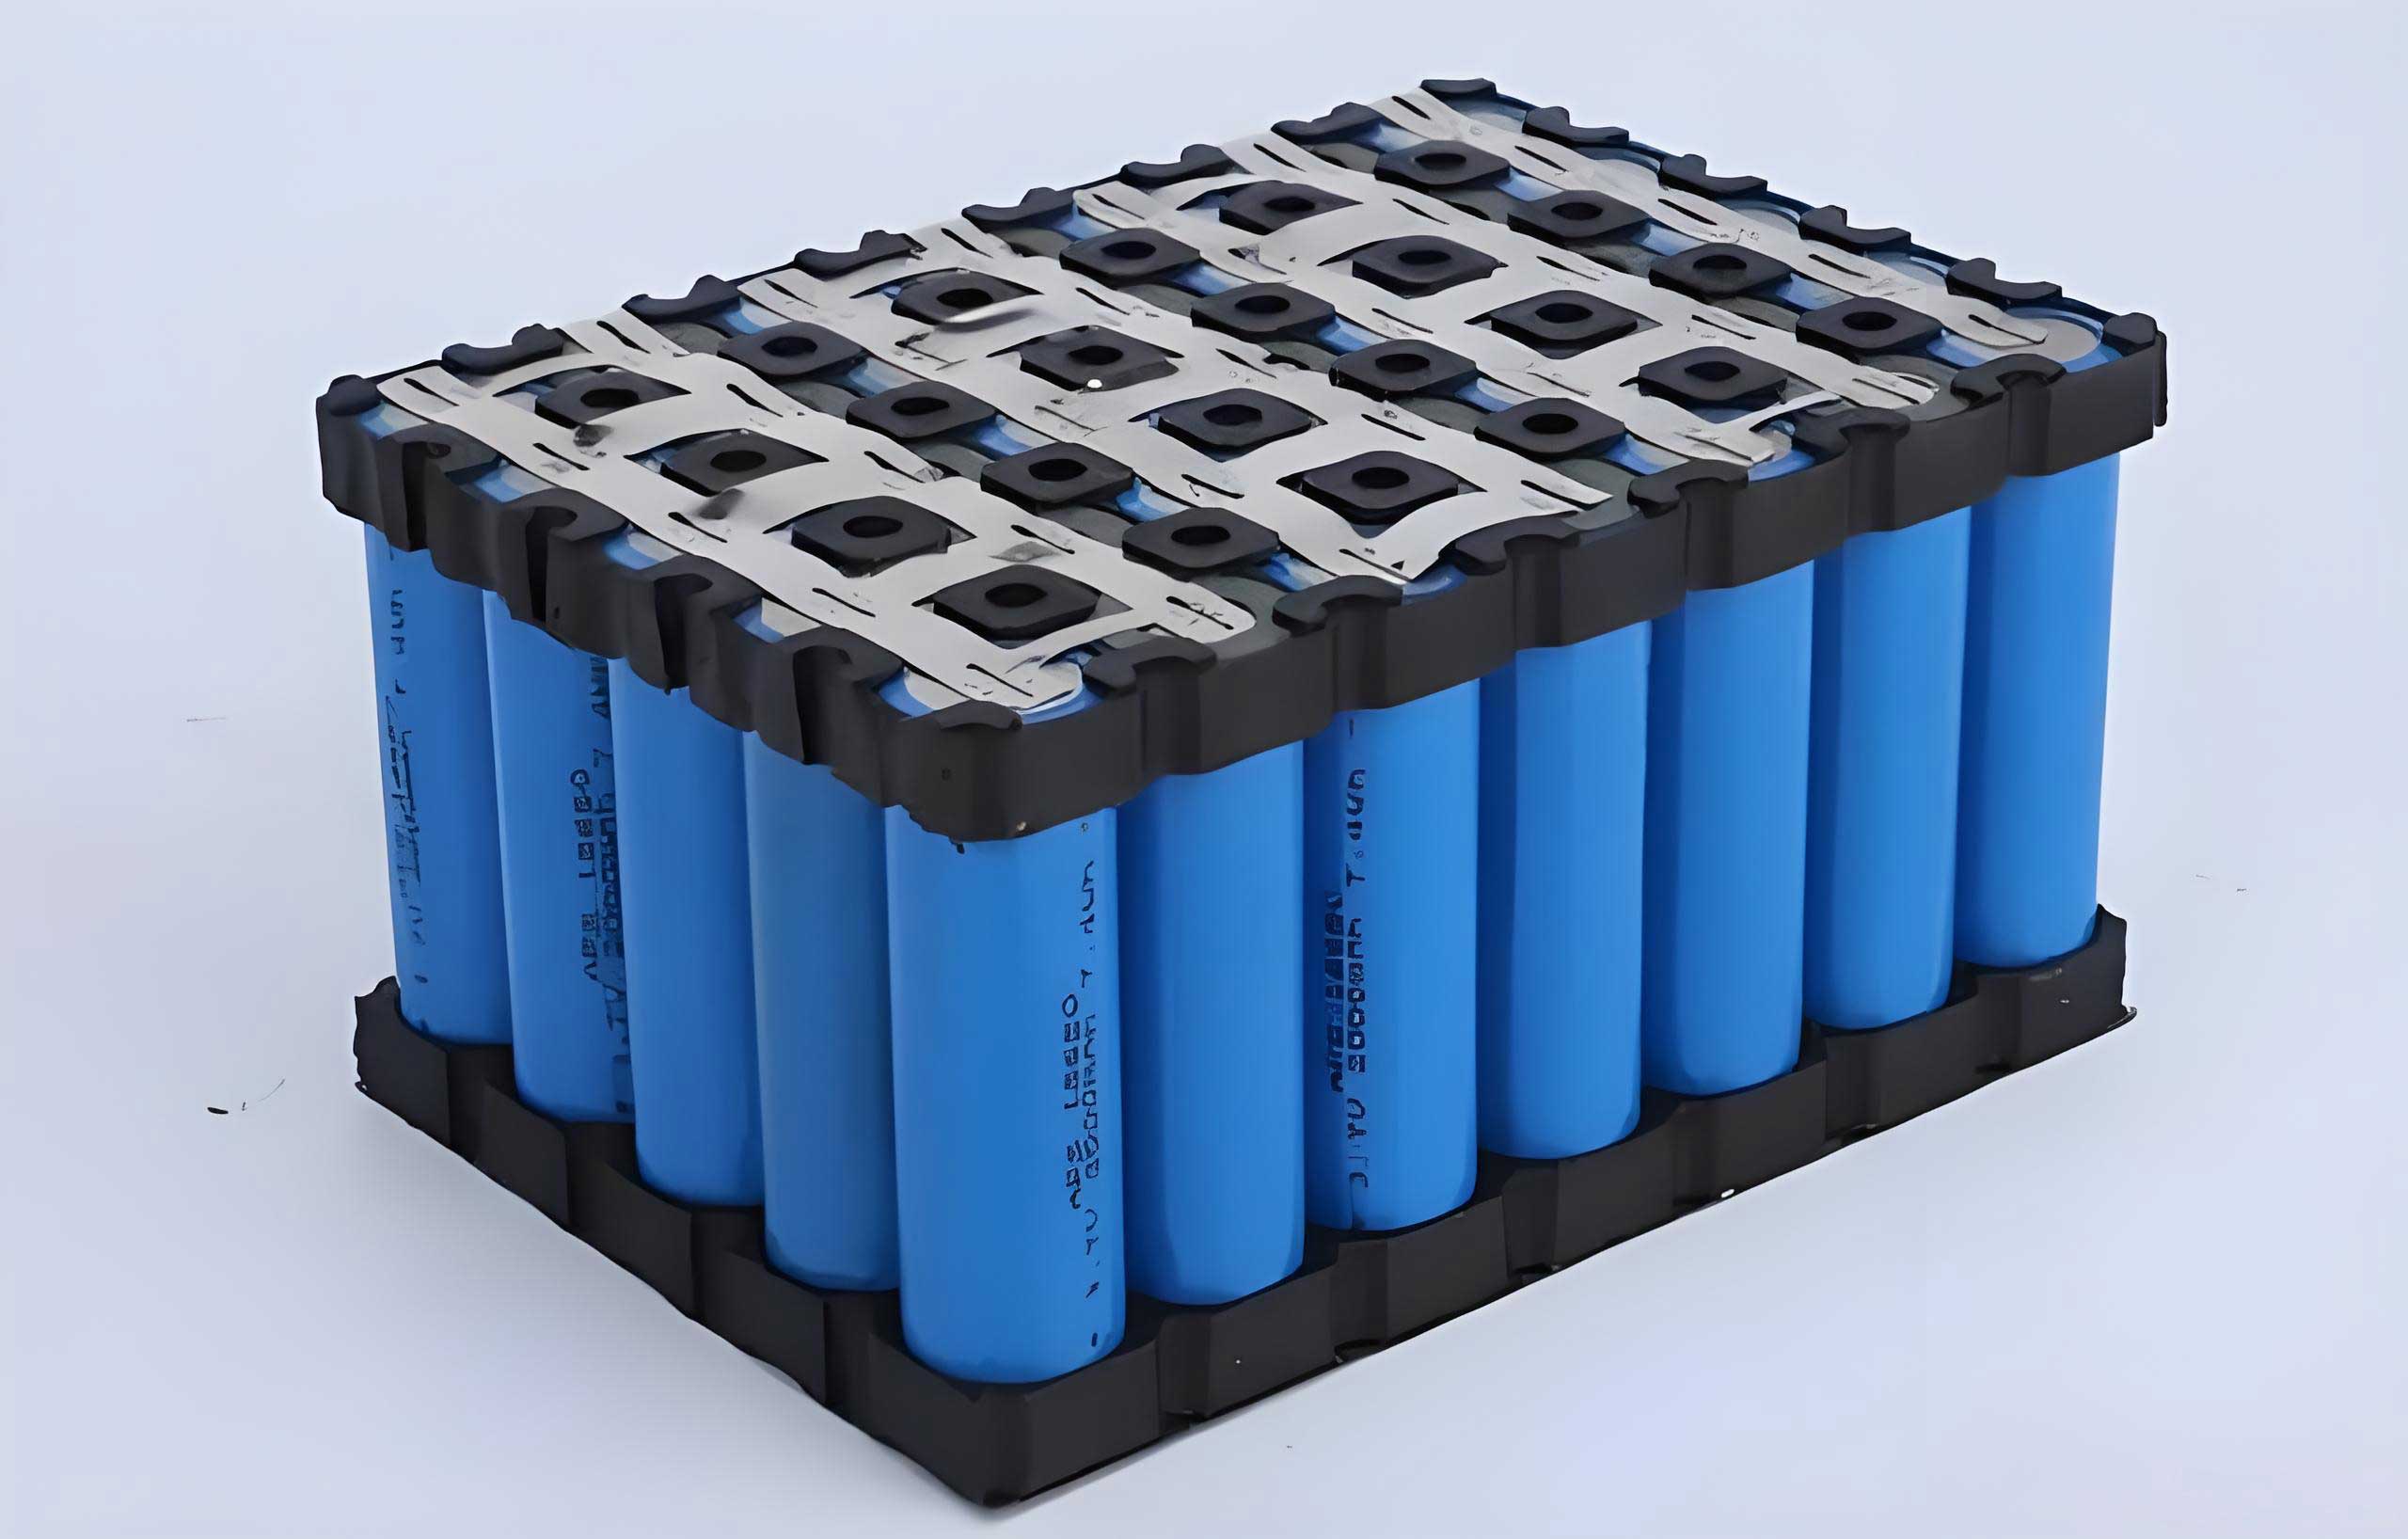
The lifepo4 battery energy storage system under investigation is configured as an integrated containerized solution. Its core consists of a DC battery container, a power conversion system (PCS) integrated with a step-up transformer, and a central energy management system (EMS). The system interfaces with the grid at a 6 kV AC bus. Key metering points include grid connection meters for settlement and a battery management system (BMS) for monitoring internal battery parameters, enabling precise analysis of system performance and losses. The fundamental operation involves drawing power from the grid during low-cost periods to charge the lifepo4 battery bank (via AC/DC conversion) and injecting stored energy back into the grid during high-cost periods (via DC/AC conversion and voltage step-up).
The charge/discharge power, often expressed as a C-rate, has a direct and linear relationship with the required time to complete a cycle. For a given energy capacity (Erated), the theoretical charge or discharge time (t) at a specific power (P) is given by:
$$ t = \frac{E_{rated}}{P} $$
A higher C-rate implies higher power, shorter cycle time, but potentially greater stress on the lifepo4 battery cells. To empirically determine the most suitable operating point, tests were conducted under three distinct power profiles, representing different C-rates relative to the system’s nominal capacity. The state of charge (SOC) window was maintained between 5% and 95% for all tests to preserve battery health.
| Test Condition | Charge/Discharge Power (kW) | Approximate C-rate | Avg. Battery Stack Temp. (°C) | Avg. System Efficiency at Grid Point (%) | Avg. Daily Self-use & Loss (kWh) |
|---|---|---|---|---|---|
| Condition A | 1,675 | 0.5C | 33.2 | 89.54 | 195.2 |
| Condition B | 837.5 | 0.25C | 27.2 | 90.98 | 189.1 |
| Condition C | 1,000 | 0.3C | 28.2 | 91.02 | 174.1 |
Condition A, operating at the maximum rated power of 1,675 kW (0.5C), demonstrated the fastest cycling capability, completing full charge and discharge in approximately 2 hours each. However, this came at a cost. The high current flow generated significant heat within the lifepo4 battery stacks, leading to an average operating temperature of 33.2°C. The associated increase in internal resistance and auxiliary cooling load contributed to the lowest observed system efficiency of 89.54% and the highest daily energy loss of 195.2 kWh.
Condition B, at a reduced power of 837.5 kW (0.25C), presented a contrasting profile. The gentler 4-hour cycle kept the lifepo4 battery temperature notably lower, at an average of 27.2°C, which is within the optimal range for lithium-ion chemistry. System efficiency improved to 90.98%. However, the prolonged operational time for each cycle resulted in sustained energy consumption by the system’s ancillary loads (cooling, control systems), leading to a still-significant daily loss of 189.1 kWh.
The most balanced performance emerged from Condition C, using a 1,000 kW (0.3C) power setpoint. This configuration achieved a near-optimal lifepo4 battery temperature of 28.2°C. Crucially, by shortening the cycle time compared to Condition B (to about 3.35 hours) while avoiding the extreme stress of Condition A, it minimized the duration of ancillary load operation. This effect yielded the highest system efficiency of 91.02% and the lowest combined self-use and loss energy of 174.1 kWh per day. The system efficiency (ηsys) is defined as the ratio of energy delivered to the grid during discharge (Edischarge, grid) to the energy drawn from the grid during charge (Echarge, grid):
$$ η_{sys} = \frac{E_{discharge, grid}}{E_{charge, grid}} \times 100\% $$
The data clearly shows that ηsys is not constant but a function of operating power, primarily due to temperature-dependent losses.
| Day | Grid Charge (kWh) | Grid Discharge (kWh) | BMS Charge (kWh) | BMS Discharge (kWh) | Avg. Temp. Charge (°C) | Avg. Temp. Discharge (°C) | System Loss (kWh) |
|---|---|---|---|---|---|---|---|
| 1 | 3,192 | 2,918 | 3,072 | 2,941 | 29.3 | 27.85 | 143 |
| 2 | 3,146 | 2,918 | 3,072 | 2,952 | 30.0 | 28.73 | 108 |
| 3 | 3,192 | 2,873 | 3,061 | 2,945 | 29.1 | 27.75 | 203 |
| 4 | 3,146 | 2,827 | 3,055 | 2,956 | 29.7 | 28.40 | 220 |
| Average | 3,169 | 2,884 | 3,065 | 2,949 | 29.5 | 28.2 | 168.5 |
The analysis of the experimental data underscores that temperature management is the pivotal factor in strategy optimization. The operating temperature of the lifepo4 battery stack (Tbat) exhibits a strong positive correlation with the applied C-rate. Elevated temperatures accelerate parasitic side reactions and increase the rate of solid electrolyte interphase (SEI) layer growth, directly leading to capacity fade and reduced cycle life. Furthermore, higher temperatures increase the lifepo4 battery‘s internal resistance, causing higher I²R losses during operation. This not only reduces efficiency but also generates more heat, creating a positive feedback loop if cooling is insufficient. The auxiliary cooling system’s power consumption (Pcool) itself is a function of the heat load (Q̇gen), which is related to the square of the operating current (I):
$$ Q̇_{gen} \propto I^2 R_{int}(T_{bat}) $$
$$ P_{cool} = f(Q̇_{gen}) $$
Therefore, an optimized strategy must carefully balance charge/discharge power with the available time window to maintain Tbat within the 25-30°C sweet spot, thereby maximizing efficiency and longevity.
With the technical characteristics established, the operational strategy must align with the economic driver: time-of-use (TOU) electricity tariffs. The local grid’s tariff structure defined distinct periods: Peak (e.g., 7:00-8:00, 9:00-11:30, 15:30-20:00), Off-Peak, and Valley (e.g., 12:00-14:00, 23:30-5:30). The price ratios were approximately: Peak price = 1.69 × Valley price, Off-Peak price = 1.35 × Valley price. This significant differential creates the opportunity for profitable energy arbitrage—charging the lifepo4 battery station at low valley prices and discharging at high peak prices.
Synthesizing the technical constraints and economic signals leads to the proposed “Two-Charge, Two-Discharge” strategy. The objective is to perform two full charge cycles during valley periods and two full discharge cycles during peak periods each day. The choice of power for each event is critically determined by the length of the available time window:
- First Charge (Night Valley): The extended valley period from 23:30 to 5:30 provides over 4 hours. This allows the use of the efficient 1,000 kW (0.3C) power level to complete a full charge while maintaining excellent temperature control.
- Second Charge (Noon Valley): The midday valley period from 12:00 to 14:00 is only 2 hours long. To achieve a full charge within this short, low-cost window, the system must operate at its maximum 1,675 kW (0.5C) power. Although this induces higher temperature and slightly lower efficiency, it is economically necessary to capture the valley price.
- First & Second Discharge (Morning & Evening Peak): Both peak periods (totaling ~3.5h and ~4.5h respectively) are longer than 3.25 hours. Therefore, the 1,000 kW (0.3C) power setting is selected for both discharges. This prioritizes high system efficiency and minimal lifepo4 battery stress during the revenue-generating discharge cycles.
The daily operational schedule can be summarized by the following power-time function, P(t):
$$
P(t) =
\begin{cases}
+1000 \text{ kW (Charge)}, & t \in T_{valley1} \\
-1000 \text{ kW (Discharge)}, & t \in T_{peak1} \\
+1675 \text{ kW (Charge)}, & t \in T_{valley2} \\
-1000 \text{ kW (Discharge)}, & t \in T_{peak2} \\
0 \text{ kW (Standby)}, & \text{otherwise}
\end{cases}
$$
where the time sets T correspond to the specific valley and peak periods defined by the tariff.
The implementation of this optimized strategy was validated over an extended period. Key performance indicators confirmed its effectiveness. The average daily charge energy was approximately 6,595 kWh, with a discharge of 5,990 kWh, resulting in a sustained system efficiency of 90.8%. Most importantly, the average lifepo4 battery stack temperature was maintained at 29.9°C, successfully within the optimal range, thereby safeguarding long-term battery health and performance consistency.
The economic performance is the ultimate metric for such a commercial storage asset. The daily revenue (Rdaily) from energy arbitrage can be calculated as:
$$ R_{daily} = E_{discharge} \cdot p_{peak} – E_{charge} \cdot p_{valley} $$
where ppeak and pvalley are the peak and valley electricity prices, respectively. Under the applied strategy, the average daily net revenue was calculated to be $1,447.41. Projecting this over a typical operational year (330 days) yields an estimated annual arbitrage revenue of approximately $477,600.
| Financial Metric | Value | Description / Assumption |
|---|---|---|
| Capital Expenditure (CAPEX) | ~$0.8 / Wh | Industry benchmark for turn-key BESS project. |
| Annual Revenue | $477,600 | Based on 330 operational days per year. |
| System Degradation | To 80% SOH in 10 years | Assumed capacity fade, after which cell replacement is needed. |
| Internal Rate of Return (IRR) | 7.14% | Calculated project return over its lifetime. |
| Static Payback Period | 13.23 years | Time for cumulative revenue to equal initial CAPEX. |
The financial analysis, considering the initial investment and the assumed degradation of the lifepo4 battery to 80% state of health over 10 years, indicates an internal rate of return (IRR) of 7.14% and a static payback period of 13.23 years. This demonstrates the project’s economic viability in the context of grid services and energy arbitrage.
In conclusion, this study successfully formulated and validated an optimized operational strategy for a grid-connected lifepo4 battery energy storage system. The core findings are threefold. First, a hybrid power strategy—utilizing high power (0.5C) only when absolutely necessary to fit short valley periods and employing a moderate power (0.3C) for all other cycles—is technically feasible and superior to using a single power setpoint. Second, active thermal management through power scheduling is paramount; maintaining the lifepo4 battery stack temperature near 30°C is a key lever for achieving high system efficiency and ensuring long cycle life. Third, when precisely aligned with regional time-of-use electricity tariffs, such a strategy transforms the lifepo4 battery storage system from a technological asset into an economically viable one, providing reliable peak shaving services to the grid while generating stable returns through arbitrage. This work provides a practical framework for the performance and economic optimization of similar lifepo4 battery storage installations participating in electricity markets.