
We present a comprehensive method for evaluating the consistency of energy storage battery stacks using multi-dimensional data fusion. The proposed approach integrates four key parameters: voltage, internal resistance, state of charge (SOC), and temperature. An improved grey relational analysis is employed to determine the objective weights of evaluation indices, and the K-medoids clustering algorithm is applied to classify the consistency levels over different time periods. This method enables effective identification of anomalies and potential faults in energy storage cells, thereby enhancing the safety and reliability of large-scale battery storage systems.
1. Introduction
The growing adoption of renewable energy sources has led to an increased reliance on energy storage systems to balance power grids. Lithium-ion battery stacks are widely used due to their high energy density and long cycle life. However, the inconsistency among individual energy storage cells within a stack can significantly impact performance, safety, and lifespan. Therefore, accurately evaluating the consistency of energy storage cells is crucial for preventive maintenance and operational optimization.
Existing evaluation methods often focus on a limited set of indicators, such as voltage or temperature, and rely on subjective weighting techniques. To address these limitations, we propose a novel framework that fuses multi-dimensional data from voltage, internal resistance, SOC, and temperature. The following image illustrates a typical lithium iron phosphate energy storage cell used in such stacks.
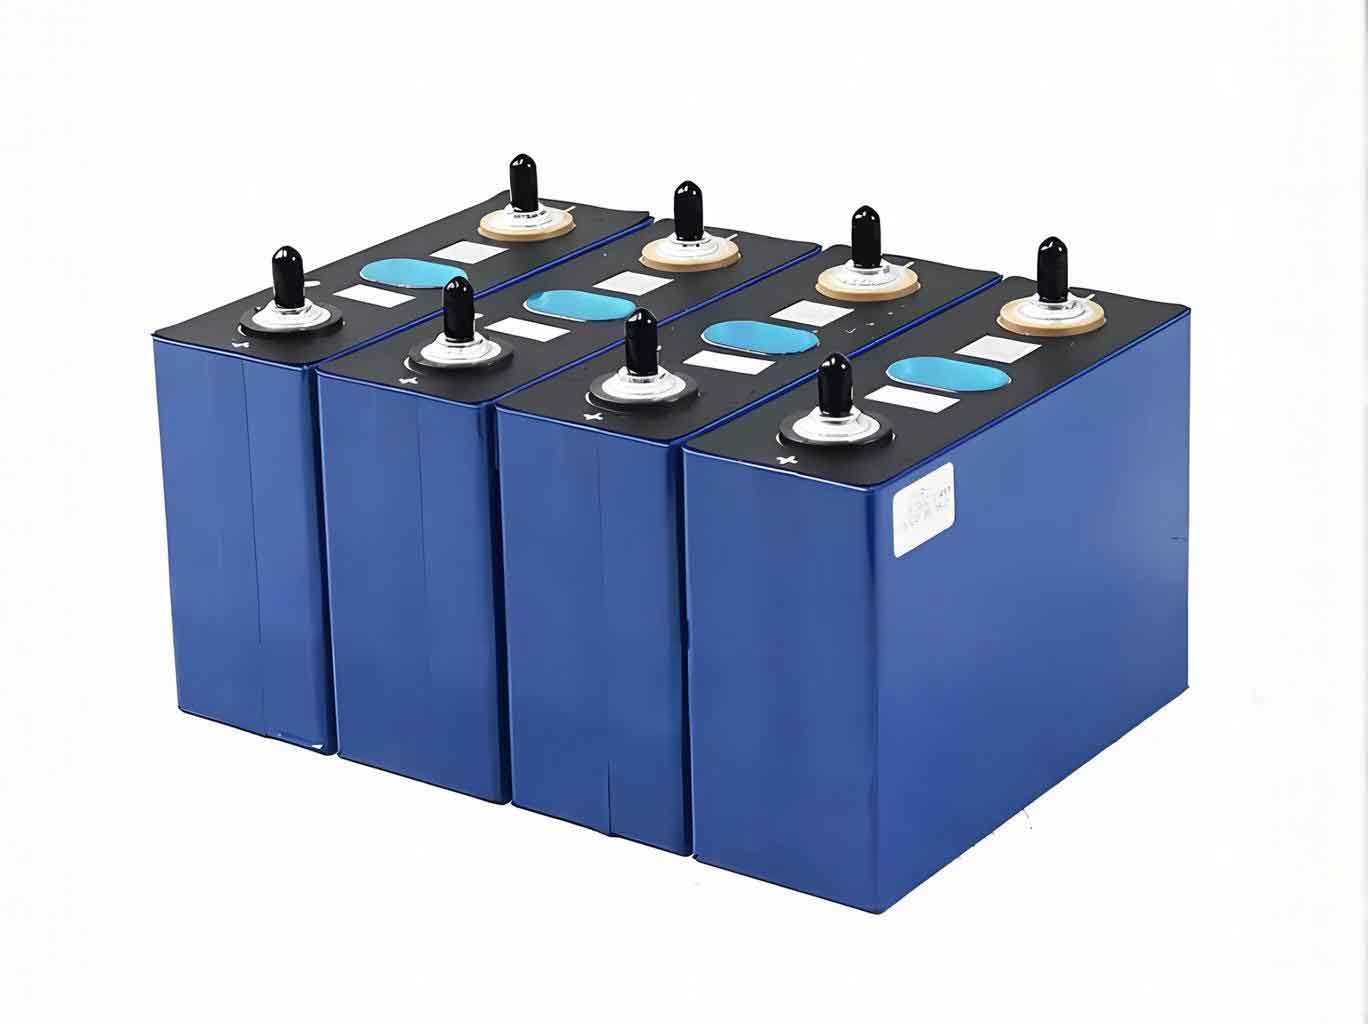
Our contributions include: (1) constructing a comprehensive index system covering three statistical measures (standard deviation, coefficient of variation, range) for each of the four parameters; (2) improving the grey relational analysis using Mahalanobis distance to eliminate subjective bias in weight assignment; and (3) applying K-medoids clustering to automatically grade the consistency of energy storage battery stacks over time. The effectiveness of the proposed method is demonstrated using historical operational data from a real energy storage station.
2. Consistency Evaluation Index System
To fully characterize the state of energy storage cells, we define the following indices for each of the four dimensions. For each dimension, we compute the standard deviation, coefficient of variation, and range.
2.1 Voltage Consistency Indices
Let \( U_i \) be the voltage of the \( i \)-th energy storage cell in a stack containing \( n \) cells, and \( \bar{U} \) the mean voltage. Then:
Voltage standard deviation:
$$ \sigma_U = \sqrt{\frac{1}{n}\sum_{i=1}^{n}(U_i – \bar{U})^2} $$
Voltage coefficient of variation:
$$ CV_U = \frac{\sigma_U}{\bar{U}} $$
Voltage range:
$$ \Delta U = U_{\text{max}} – U_{\text{min}} $$
2.2 Internal Resistance Consistency Indices
Let \( R_i \) be the internal resistance of the \( i \)-th cell:
$$ \sigma_R = \sqrt{\frac{1}{n}\sum_{i=1}^{n}(R_i – \bar{R})^2} $$
$$ CV_R = \frac{\sigma_R}{\bar{R}} $$
$$ \Delta R = R_{\text{max}} – R_{\text{min}} $$
2.3 SOC Consistency Indices
SOC (State of Charge) reflects the remaining charge:
$$ \sigma_{\text{SOC}} = \sqrt{\frac{1}{n}\sum_{i=1}^{n}(\text{SOC}_i – \overline{\text{SOC}})^2} $$
$$ CV_{\text{SOC}} = \frac{\sigma_{\text{SOC}}}{\overline{\text{SOC}}} $$
$$ \Delta \text{SOC} = \text{SOC}_{\text{max}} – \text{SOC}_{\text{min}} $$
2.4 Temperature Consistency Indices
Temperature is crucial for thermal management:
$$ \sigma_T = \sqrt{\frac{1}{n}\sum_{i=1}^{n}(T_i – \bar{T})^2} $$
$$ CV_T = \frac{\sigma_T}{\bar{T}} $$
$$ \Delta T = T_{\text{max}} – T_{\text{min}} $$
All 12 indices are negative indicators (smaller means better consistency). For uniform evaluation, we normalize and positively transform each index using:
$$ \varepsilon = \frac{1}{1 + \varepsilon’} $$
where \( \varepsilon’ \) is the raw value and \( \varepsilon \in [0,1] \) (higher is better).
3. Weight Determination via Improved Grey Relational Analysis
To avoid the subjective selection of the resolution coefficient in classical grey relational analysis, we replace the correlation coefficient with Mahalanobis distance. The steps are as follows:
- Construct the comparison matrix \( E = [E_1, E_2, \dots, E_i]^\text{T} \), where each \( E_k = (a_{k1}, a_{k2}, \dots, a_{kj}) \) represents the weight opinions of \( j \) experts for the \( k \)-th index.
- Define the reference sequence \( E_0 \) as the maximum value in each column of \( E \).
- Combine \( E_0 \) and all \( E_k \) into a new matrix \( E’ \).
- Compute the Mahalanobis distance between each \( E_k \) and \( E_0 \):
$$ D_m(E_0, E_k) = \sqrt{(E_0 – E_k)^\text{T} \Sigma^{-1} (E_0 – E_k)} $$
where \( \Sigma \) is the covariance matrix of \( E’ \).
- Calculate the weight for the \( k \)-th index as:
$$ \omega_k’ = \frac{1}{1 + D_m(E_0, E_k)} $$
And normalize:
$$ \omega_k = \frac{\omega_k’}{\sum_{k=1}^{n} \omega_k’} $$
This method avoids the need for an arbitrary resolution coefficient and accounts for correlations among indices. The obtained weights for our case study are listed in Table 1.
| Index | Weight |
|---|---|
| SOC standard deviation | 0.113083 |
| SOC coefficient of variation | 0.087621 |
| SOC range | 0.071971 |
| Voltage standard deviation | 0.098903 |
| Voltage coefficient of variation | 0.080828 |
| Voltage range | 0.073921 |
| Internal resistance standard deviation | 0.078036 |
| Internal resistance coefficient of variation | 0.078072 |
| Internal resistance range | 0.072279 |
| Temperature standard deviation | 0.090071 |
| Temperature coefficient of variation | 0.073197 |
| Temperature range | 0.082019 |
4. Consistency Grading via K-Medoids Clustering
After obtaining the positively transformed index values and their weights, we fuse them into a comprehensive score:
$$ S = \sum_{k=1}^{12} \omega_k \cdot x_k $$
where \( x_k \) is the normalized index value. However, to naturally partition the data into distinct consistency levels without pre-setting thresholds, we apply the K-medoids clustering algorithm on the multi-dimensional index space.
K-medoids is chosen because it uses actual data points as cluster centers (medoids) and is robust to noise and outliers. The algorithm proceeds as follows:
- Choose \( K \) initial medoids randomly from the dataset.
- Assign each data point to the nearest medoid based on Euclidean distance.
- For each cluster, select a new medoid that minimizes the total distance within the cluster.
- Repeat steps 2–3 until convergence.
We set \( K = 4 \) to classify the consistency of energy storage battery stacks into four levels (excellent, good, fair, poor). The centroid of each cluster (the medoid) summarizes the average index values for that group. The comprehensive score of each medoid is computed using the weights from Section 3, and clusters are ranked by score from highest to lowest.
5. Case Study
5.1 Data Description
We collected historical data from two actual battery stacks (denoted as Stack A and Stack B) in an energy storage station. Each stack consists of 5 parallel battery clusters, each containing 216 lithium iron phosphate cells. The dataset includes voltage, SOC, temperature, and internal resistance sampled every 5 minutes. A total of 1000 consecutive data points per stack are selected, spanning from 2024-01-21 15:55 to 2024-01-24 18:50.
5.2 Preprocessing
From the raw data of each cluster, we compute the 12 indices for each sample time. After positive transformation, all values lie in [0,1].
5.3 Weight Calculation
Using the improved grey relational analysis with expert opinions (simulated by variation of index ranges), we obtained the weights shown in Table 1. Notably, SOC and voltage indices receive higher weights, while internal resistance weights are slightly lower, indicating that all four dimensions are indispensable.
5.4 Clustering Results
We clustered the 1000 time points for each stack separately. Table 2 and Table 3 present the medoid coordinates and cluster grades for Stack A and Stack B, respectively.
| Index | Cluster 1 | Cluster 2 | Cluster 3 | Cluster 4 |
|---|---|---|---|---|
| SOC std | 0.382709 | 0.485880 | 0.979470 | 0.964935 |
| SOC CV | 0.980564 | 0.975476 | 0.997670 | 0.998306 |
| SOC range | 0.197628 | 0.275178 | 0.956022 | 0.907441 |
| Voltage std | 0.881706 | 0.863472 | 0.890888 | 0.901270 |
| Voltage CV | 0.999814 | 0.999784 | 0.999823 | 0.999845 |
| Voltage range | 0.769230 | 0.714285 | 0.769230 | 0.769230 |
| Resistance std | 0.999106 | 0.999106 | 0.999106 | 0.999106 |
| Resistance CV | 0.995512 | 0.995512 | 0.995512 | 0.995512 |
| Resistance range | 0.998003 | 0.998003 | 0.998003 | 0.998003 |
| Temperature std | 0.837219 | 0.572695 | 0.759035 | 0.647705 |
| Temperature CV | 0.993147 | 0.977301 | 0.989194 | 0.977609 |
| Temperature range | 0.662251 | 0.345901 | 0.548546 | 0.406338 |
| Number of points | 100 | 396 | 263 | 241 |
| Comprehensive score | 0.711440 | 0.701358 | 0.834663 | 0.820372 |
| Grade | 3 | 4 | 1 | 2 |
| Index | Cluster 1 | Cluster 2 | Cluster 3 | Cluster 4 |
|---|---|---|---|---|
| SOC std | 0.659617 | 0.737647 | 0.556009 | 0.741762 |
| SOC CV | 0.973187 | 0.964539 | 0.961286 | 0.965109 |
| SOC range | 0.440334 | 0.540540 | 0.331016 | 0.524934 |
| Voltage std | 0.776338 | 0.805910 | 0.785014 | 0.805910 |
| Voltage CV | 0.999630 | 0.999686 | 0.999639 | 0.999686 |
| Voltage range | 0.625000 | 0.666666 | 0.666666 | 0.666666 |
| Resistance std | 0.998359 | 0.996739 | 0.997042 | 0.998214 |
| Resistance CV | 0.991843 | 0.983764 | 0.985341 | 0.991099 |
| Resistance range | 0.996015 | 0.993048 | 0.993048 | 0.995024 |
| Temperature std | 0.678283 | 0.844485 | 0.738270 | 0.856525 |
| Temperature CV | 0.981949 | 0.986718 | 0.980144 | 0.987954 |
| Temperature range | 0.463392 | 0.693962 | 0.521648 | 0.697836 |
| Number of points | 308 | 423 | 161 | 108 |
| Comprehensive score | 0.793646 | 0.848192 | 0.786182 | 0.849907 |
| Grade | 3 | 2 | 4 | 1 |
For Stack A, Cluster 3 achieves the highest score (0.834663) and is rated Grade 1, while Cluster 2 (score 0.701358) is the worst. The main weak points for low-rated clusters are SOC and temperature consistency. For Stack B, Cluster 4 is the best (score 0.849907) and Cluster 3 the worst (0.786182). The voltage and internal resistance indices are generally satisfactory, but SOC and temperature consistency show significant room for improvement.
5.5 Anomaly Detection in Worst-Performing Data
To identify specific periods where the consistency of energy storage cells degrades, we extract the data points belonging to the worst cluster of each stack and re-cluster them into 4 sub-clusters. Table 4 and Table 5 display the medoids of these sub-clusters for Stack A and Stack B, respectively.
| Index | Sub-cluster 1 | Sub-cluster 2 | Sub-cluster 3 | Sub-cluster 4 |
|---|---|---|---|---|
| SOC std | 0.384868 | 0.676230 | 0.558199 | 0.366797 |
| SOC CV | 0.981657 | 0.973191 | 0.988299 | 0.979133 |
| SOC range | 0.205507 | 0.494315 | 0.359453 | 0.185735 |
| Voltage std | 0.881706 | 0.856654 | 0.740349 | 0.890889 |
| Voltage CV | 0.999814 | 0.999768 | 0.999498 | 0.999830 |
| Voltage range | 0.76923 | 0.714286 | 0.526315 | 0.769231 |
| Resistance std | 0.999106 | 0.999106 | 0.999106 | 0.999106 |
| Resistance CV | 0.995512 | 0.995512 | 0.995512 | 0.995512 |
| Resistance range | 0.998004 | 0.998004 | 0.998004 | 0.998004 |
| Temperature std | 0.61537 | 0.587359 | 0.56396 | 0.539427 |
| Temperature CV | 0.980375 | 0.976883 | 0.976741 | 0.970831 |
| Temperature range | 0.393546 | 0.366703 | 0.351494 | 0.301477 |
| Number of points | 107 | 60 | 98 | 131 |
| Score | 0.695201 | 0.7400323 | 0.691626 | 0.685882 |
| Rank | 2 | 1 | 3 | 4 |
| Index | Sub-cluster 1 | Sub-cluster 2 | Sub-cluster 3 | Sub-cluster 4 |
|---|---|---|---|---|
| SOC std | 0.895513 | 0.077354 | 0.51205 | 0.556009 |
| SOC CV | 0.998057 | 0.810261 | 0.974104 | 0.961287 |
| SOC range | 0.776398 | 0.034299 | 0.307314 | 0.331016 |
| Voltage std | 0.785015 | 0.800642 | 0.749252 | 0.785015 |
| Voltage CV | 0.999654 | 0.999686 | 0.999557 | 0.99964 |
| Voltage range | 0.666667 | 0.666667 | 0.555556 | 0.666667 |
| Resistance std | 0.997042 | 0.997042 | 0.997042 | 0.997042 |
| Resistance CV | 0.985341 | 0.985341 | 0.985341 | 0.985341 |
| Resistance range | 0.993049 | 0.993049 | 0.993049 | 0.993049 |
| Temperature std | 0.741641 | 0.756582 | 0.711064 | 0.738271 |
| Temperature CV | 0.976607 | 0.979163 | 0.975738 | 0.980144 |
| Temperature range | 0.540541 | 0.552792 | 0.50000 | 0.521648 |
| Number of points | 49 | 26 | 9 | 77 |
| Score | 0.861446 | 0.703148 | 0.764323 | 0.786182 |
| Rank | 1 | 4 | 3 | 2 |
For Stack A, the worst sub-cluster (Sub-cluster 4, score 0.685882) corresponds to time points between 2024-01-23 3:00 and 9:00. During this period, the stack was charging and then resting, causing SOC differences among clusters to increase. The SOC indices remained within normal ranges (above 0.167 for std and above 0.09 for range), so no severe anomaly was indicated.
For Stack B, the worst sub-cluster (Sub-cluster 2, score 0.703148) covers only 26 points from 2024-01-23 3:05 to 5:10. The SOC standard deviation (0.077354) and SOC range (0.034299) are both below the normal thresholds (0.167 and 0.09 respectively), indicating significant inconsistency. By analyzing the raw data, we discovered that one specific battery cluster (Cluster 5) exhibited an abnormal SOC drop during the charging period. While other clusters’ SOC rose normally, Cluster 5’s SOC decreased from 3:05 to around 4:40, leading to a large gap. After 5:35, the SOC gradually returned to normal. This behavior suggests a possible fault in the SOC balancing control or internal cell malfunction.
6. Conclusion
We have developed a multi-dimensional data fusion methodology for evaluating the consistency of energy storage battery stacks. By integrating voltage, internal resistance, SOC, and temperature indices and using an improved grey relational analysis for objective weighting, our approach provides a comprehensive and unbiased assessment. The K-medoids clustering enables automatic grading of consistency over time and facilitates the detection of anomalous periods. Applied to real operational data from an energy storage station, our method successfully identified a critical anomaly in Stack B where SOC consistency fell to alarming levels, likely due to a control fault in one of the energy storage cells. This demonstrates the practical value of our framework for predictive maintenance and improved reliability of large-scale battery energy storage systems.
Future work will explore real-time implementation and automatic triggering of alarms when the worst cluster score drops below a dynamic threshold. The method can also be extended to evaluate the entire station or compare multiple stations, providing a powerful tool for energy storage asset management.