
The quest for sustainable and high-performance photovoltaic technologies has brought significant attention to kesterite-based thin film solar panels. Among these, copper zinc tin selenide (CZTSe) stands out as a highly promising absorber material due to its optimal bandgap (~1.0-1.5 eV), high absorption coefficient (>104 cm-1), and the abundance and non-toxicity of its constituent elements. Despite its theoretical potential, the recorded power conversion efficiency (PCE) of CZTSe thin film solar panels remains around 13%, significantly lower than its Shockley-Queisser limit and trailing behind established technologies like Cu(In,Ga)Se2 (CIGS). This efficiency gap is primarily attributed to a large open-circuit voltage (VOC) deficit and low fill factor (FF), stemming from various intricate material and device-level issues.
Numerical simulation serves as a powerful tool to decouple and understand the influence of various performance-limiting factors in complex thin film solar panel architectures. In this study, I employ the Solar Cell Capacitance Simulator (SCAPS-1D) to perform a systematic analysis of a typical CZTSe thin film solar panel. The simulation is anchored by fitting the current density-voltage (J-V) characteristics of an experimentally fabricated device with a PCE of 7.53%. Through this calibrated model, I investigate the individual and combined impacts of series/shunt resistance, bulk deep-level defect states, and interfacial recombination on the device’s photovoltaic parameters. The objective is to identify the primary bottlenecks and delineate clear pathways for efficiency enhancement in CZTSe-based thin film solar panels.
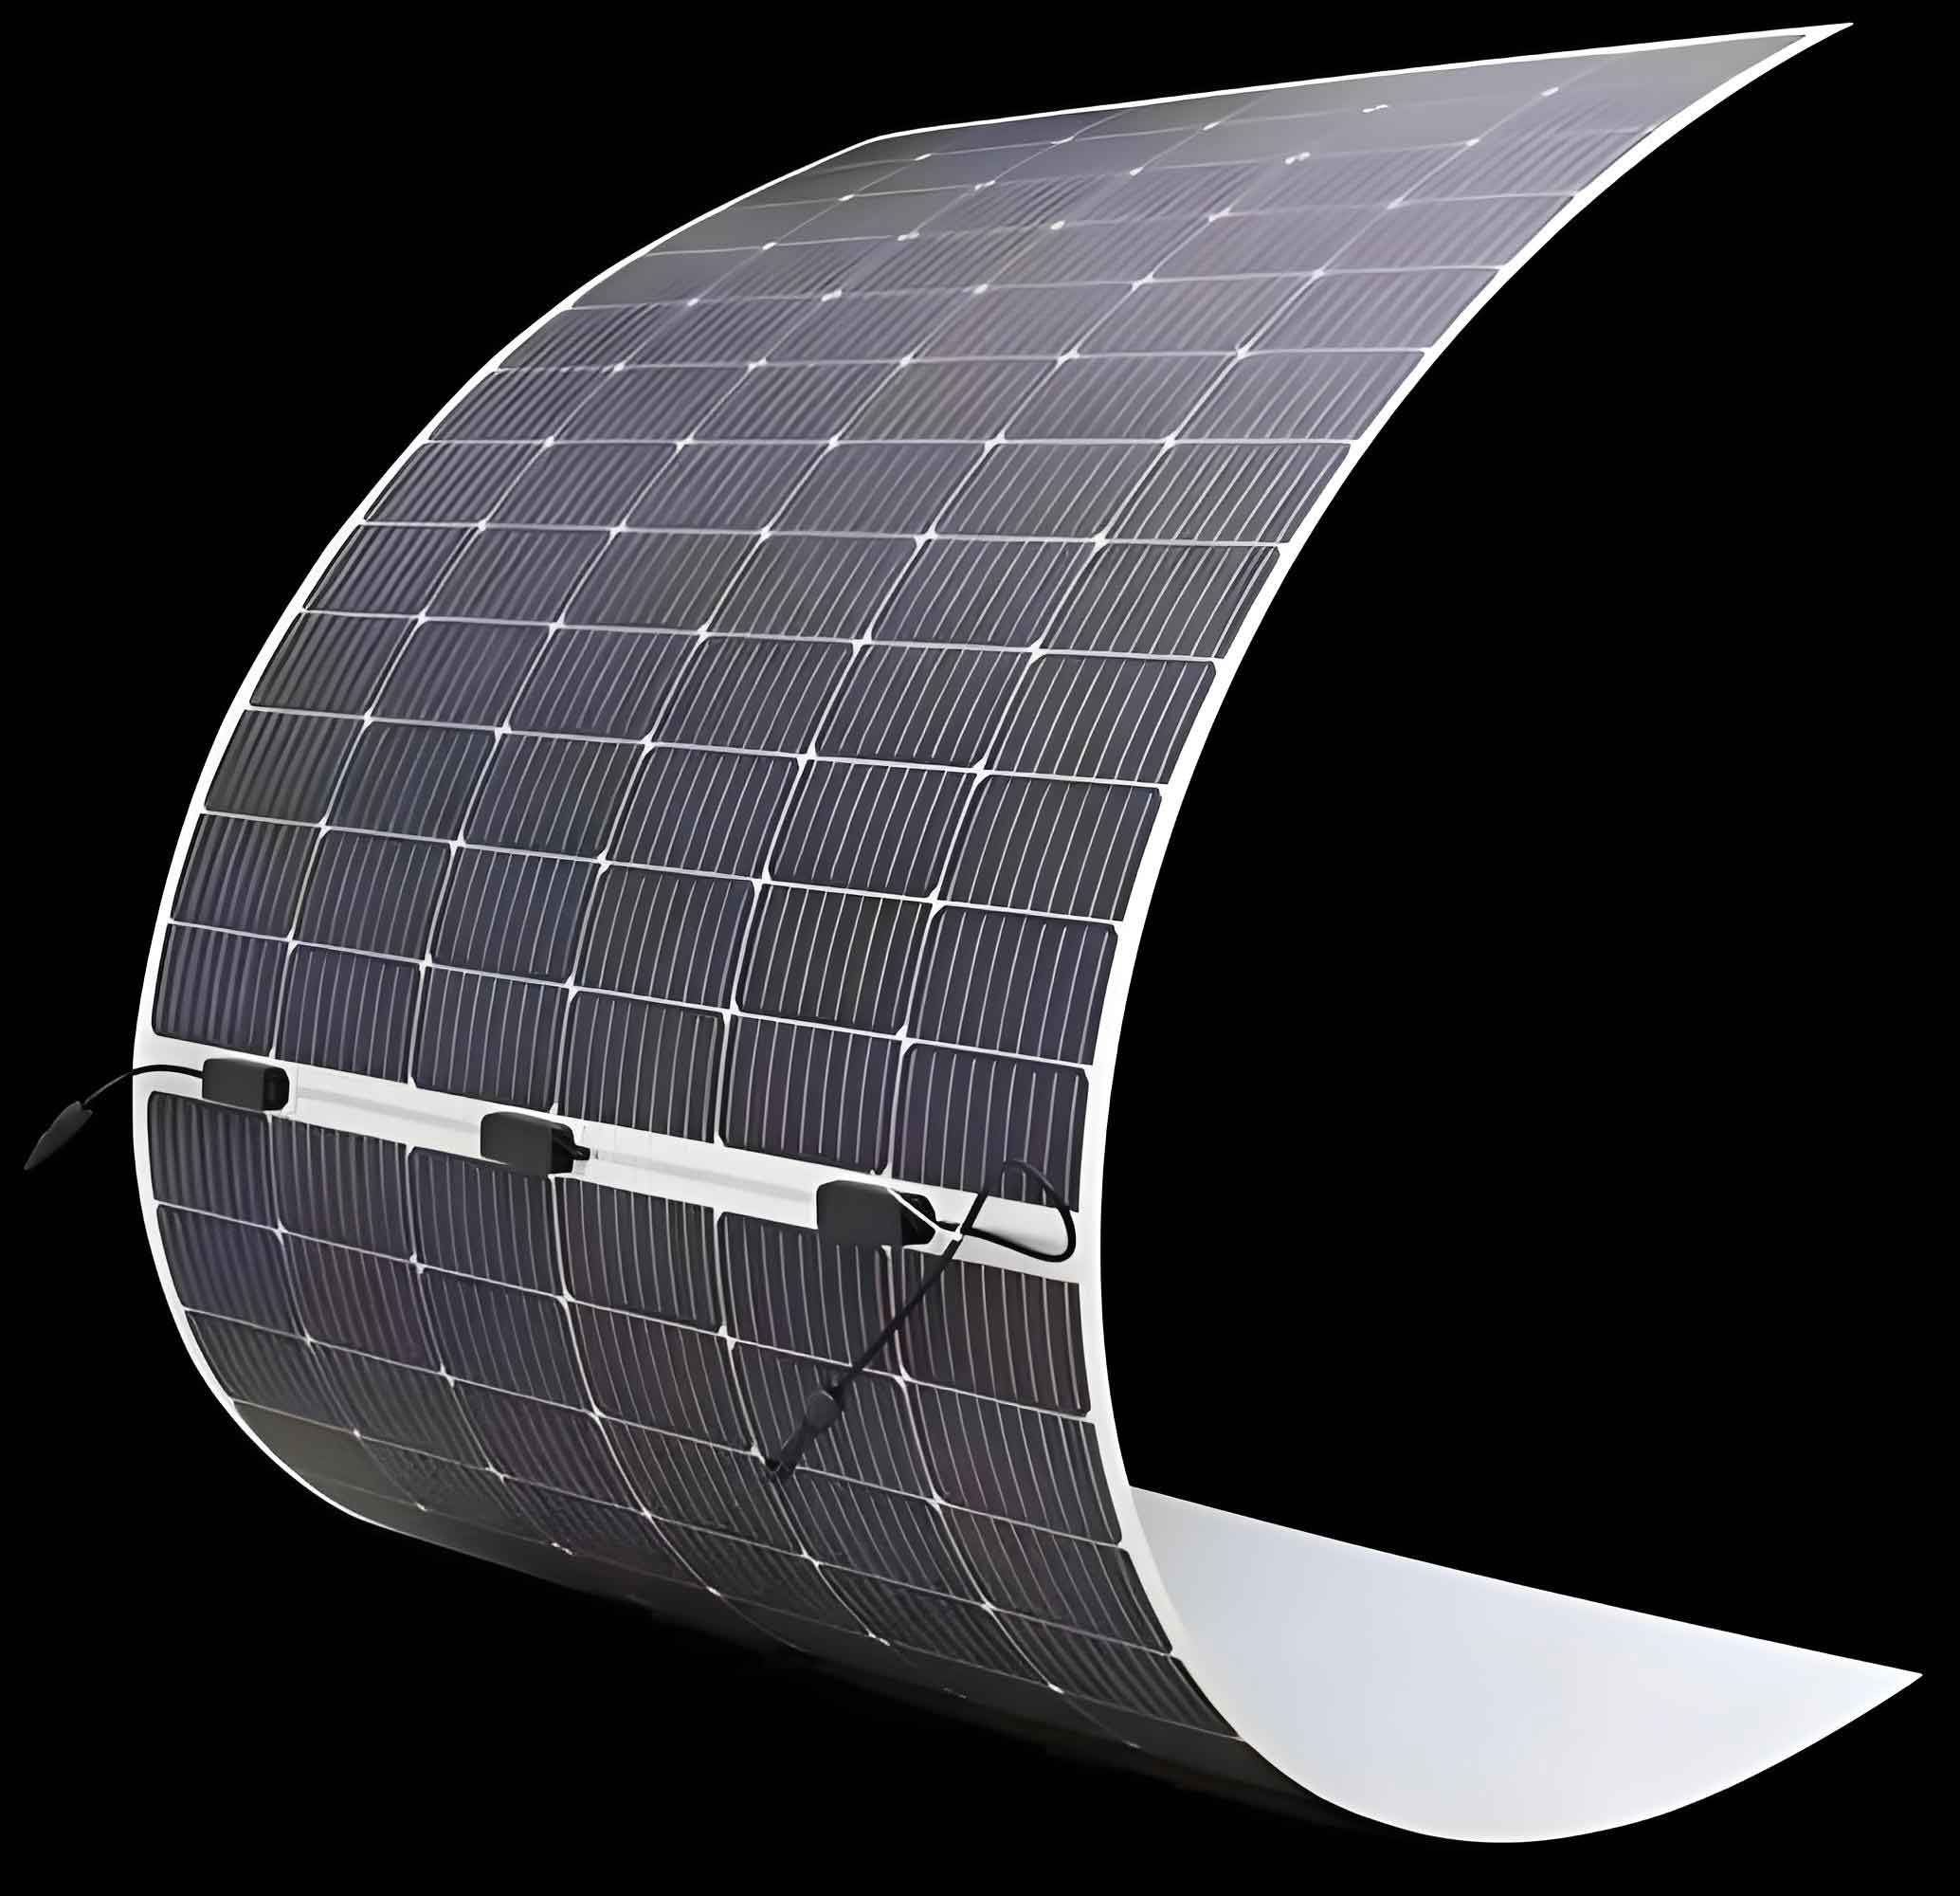
The standard device stack for the simulated CZTSe thin film solar panel is as follows: Glass/Mo back contact/CZTSe absorber/CdS buffer layer/intrinsic ZnO/transparent conducting oxide (TCO)/Al grid. For the simulation, the thicknesses of the CZTSe absorber, CdS buffer, and i-ZnO layers were set to 1.5 µm, 50 nm, and 100 nm, respectively. The core simulation in SCAPS involves solving the coupled Poisson’s equation and electron/hole continuity equations under given boundary conditions:
$$
\nabla \cdot (\epsilon \nabla \phi) = -q (p – n + N_D^+ – N_A^-)
$$
$$
\frac{1}{q} \nabla \cdot \vec{J}_n = G – R + \frac{\partial n}{\partial t}, \quad \frac{1}{q} \nabla \cdot \vec{J}_p = -(G – R) – \frac{\partial p}{\partial t}
$$
where $\epsilon$ is the permittivity, $\phi$ is the electrostatic potential, $q$ is the elementary charge, $n$ and $p$ are the electron and hole densities, $N_D^+$ and $N_A^-$ are the ionized donor and acceptor concentrations, $\vec{J}_n$ and $\vec{J}_p$ are the electron and hole current densities, and $G$ and $R$ are the generation and recombination rates, respectively. Key material parameters used for the CZTSe absorber in the baseline model are summarized in Table 1. The parameters for CdS and ZnO layers were adopted from well-established databases within SCAPS. The absorber’s bandgap ($E_g$) of 1.01 eV, acceptor concentration ($N_A$) of 1×1016 cm-3, and hole mobility ($\mu_p$) of 5 cm²/V·s were based on experimental measurements of the fabricated thin film solar panels.
| Parameter | Symbol (Unit) | Value |
|---|---|---|
| Bandgap | $E_g$ (eV) | 1.01 |
| Electron Affinity | $\chi$ (eV) | 4.5 |
| Relative Permittivity | $\epsilon_r$ | 8.0 |
| Effective Density of States (Conduction Band) | $N_C$ (cm-3) | 2.2×10¹⁸ |
| Effective Density of States (Valence Band) | $N_V$ (cm-3) | 1.8×10¹⁹ |
| Electron Mobility | $\mu_n$ (cm²/V·s) | 100 |
| Hole Mobility | $\mu_p$ (cm²/V·s) | 5 |
| Acceptor Concentration | $N_A$ (cm-3) | 1.0×10¹⁶ |
| Thickness | $d$ (µm) | 1.5 |
| Bulk Defect Energy (relative to VBM) | $E_t$ (eV) | 0.4 |
| Bulk Defect Density (Fitted) | $N_t$ (cm-3) | 1.0×10¹³ |
| Interface Defect Density (Fitted) | $D_{it}$ (cm-2) | 1.0×10¹² |
| Series Resistance (Fitted) | $R_s$ (Ω·cm²) | 2.5 |
| Shunt Resistance (Fitted) | $R_{sh}$ (Ω·cm²) | 800 |
The initial calibration involved adjusting key variables—series resistance ($R_s$), shunt resistance ($R_{sh}$), bulk Shockley-Read-Hall (SRH) recombination center density ($N_t$), and CdS/CZTSe interface trap density ($D_{it}$)—to match the experimental J-V curve. The fitted values, listed in Table 1, yielded a good agreement with the measured data. This calibrated model, representing a typical, non-optimized CZTSe thin film solar panel, serves as the baseline (Ref.) for all subsequent parametric studies.
The impact of series and shunt resistances on the performance of the CZTSe thin film solar panel was investigated first. The results, summarized in Table 2, reveal distinct roles for these parasitic elements. Reducing $R_s$ from the fitted value of 2.5 Ω·cm² to an ideal 0.01 Ω·cm² leads to a dramatic improvement in FF from 54.0% to 70.8%. This is because a high $R_s$ causes a significant voltage drop, particularly at high current densities, flattening the J-V curve near the open-circuit condition. Consequently, the PCE surges from 7.53% to 9.98%. In contrast, $V_{OC}$ and short-circuit current density ($J_{SC}$) remain largely unaffected by changes in $R_s$ alone. On the other hand, improving $R_{sh}$ from 800 Ω·cm² to 10,000 Ω·cm² has a minimal effect on all parameters, increasing the PCE by only 0.06%. This indicates that for this specific device, the primary resistive loss is due to high series resistance, not low shunt resistance. Optimizing metallization, TCO conductivity, and contact formation is therefore a critical first step for enhancing the performance of such CZTSe thin film solar panels.
| Case | $R_s$ (Ω·cm²) | $R_{sh}$ (Ω·cm²) | $V_{OC}$ (V) | $J_{SC}$ (mA/cm²) | FF (%) | PCE (%) |
|---|---|---|---|---|---|---|
| Baseline (Ref.) | 2.5 | 800 | 0.380 | 36.5 | 54.0 | 7.53 |
| Optimized $R_s$ | 0.01 | 800 | 0.380 | 36.7 | 70.8 | 9.98 |
| Optimized $R_{sh}$ | 2.5 | 10,000 | 0.381 | 36.5 | 54.4 | 7.59 |
| Optimized $R_s$ & $R_{sh}$ | 0.01 | 10,000 | 0.381 | 36.7 | 71.0 | 10.14 |
The influence of bulk defects, which act as non-radiative recombination centers, is paramount in thin film solar panels. A single deep-level defect with an energy level $E_t = 0.4$ eV above the valence band maximum (VBM) was modeled. The SRH recombination rate via such a defect is given by:
$$
R_{SRH} = \frac{np – n_i^2}{\tau_p (n + n_1) + \tau_n (p + p_1)}
$$
where $n_i$ is the intrinsic carrier concentration, $\tau_{n,p}$ are the carrier lifetimes, and $n_1$, $p_1$ are parameters related to the defect energy level. The simulation results for varying defect density $N_t$ are plotted in Figure 1. The device performance shows a critical threshold behavior. For $N_t$ below approximately 3×1012 cm-3, the $V_{OC}$, $J_{SC}$, and FF remain stable. Beyond this threshold, all parameters degrade rapidly. This critical density corresponds to a calculated minority carrier (electron) diffusion length ($L_D = \sqrt{D_n \tau_n}$) of about 1.3 µm. Since the sum of $L_D$ and the depletion region width (~0.27 µm) exceeds the absorber thickness (1.5 µm), carriers generated throughout the absorber can be collected efficiently. When $N_t$ increases further, $L_D$ shortens, leading to increased bulk recombination, reduced $J_{SC}$, and a rise in saturation current that lowers $V_{OC}$ and FF. This highlights that for a given absorber thickness in thin film solar panels, there exists a maximum tolerable defect density to avoid bulk recombination-limited performance.
$$
\begin{aligned}
\text{Figure 1: Device parameters as a function of bulk defect density } N_t. \text{ A sharp decline in } V_{OC}, J_{SC}, \text{ and FF is observed for } N_t > 3 \times 10^{12} \text{ cm}^{-3}.
\end{aligned}
$$
Interfacial recombination at the critical CdS/CZTSe heterojunction is often cited as a major cause of $V_{OC}$ loss in kesterite thin film solar panels. Surprisingly, in the baseline simulation with a “spike-like” conduction band offset (CBO, $\Delta E_C = E_C^{CdS} – E_C^{CZTSe} \approx +0.3$ eV), varying the interface trap density $D_{it}$ from 1010 to 1015 cm-2 had a negligible impact on $V_{OC}$ (remaining between 0.378-0.383 V). This is because the recombination activation energy in a spike-like structure is roughly equal to the absorber bandgap, making interface recombination less sensitive to $D_{it}$ for moderate spike values. To investigate a less ideal scenario, I modified the CZTSe electron affinity to create a “cliff-like” CBO ($\Delta E_C \approx -0.1$ eV). The results, shown in Table 3, are starkly different. In this cliff-like structure, the activation energy for interface recombination is reduced, making it a highly efficient pathway. As $D_{it}$ increases, $V_{OC}$ and FF plummet. This simulation underscores that for CZTSe thin film solar panels, controlling the band alignment to maintain a small positive CBO is equally, if not more, important than merely minimizing $D_{it}$. The use of alternative buffer layers or surface treatments to engineer a favorable spike is a key research direction.
| Interface Type | $D_{it}$ (cm-2) | $V_{OC}$ (V) | $J_{SC}$ (mA/cm²) | FF (%) | PCE (%) |
|---|---|---|---|---|---|
| Spike-like ($\Delta E_C = +0.3$ eV) | 1×10¹⁰ | 0.383 | 36.7 | 71.1 | 10.16 |
| 1×10¹⁵ | 0.378 | 36.5 | 70.5 | 9.92 | |
| Cliff-like ($\Delta E_C = -0.1$ eV) | 1×10¹⁰ | 0.381 | 36.5 | 69.2 | 7.13 |
| 1×10¹⁵ | 0.231 | 35.8 | 36.5 | 3.01 |
Finally, a holistic optimization scenario was simulated to project the potential performance ceiling for the studied CZTSe thin film solar panel architecture. This scenario (OP1) combines drastically reduced $R_s$ (0.01 Ω·cm²), high $R_{sh}$ (10,000 Ω·cm²), improved bulk quality ($N_t = 1×10^{12}$ cm-3), and excellent interface passivation ($D_{it} = 1×10^{10}$ cm-2). The results, compared in Table 4, show a significant leap in performance to a PCE of 11.31%, driven mainly by a superb FF of 77.5% and an improved $J_{SC}$. However, the $V_{OC}$ remains at 0.401 V, representing a substantial deficit relative to the bandgap. It is widely acknowledged that band tailing, caused by disorders and potential fluctuations, effectively reduces the electronic bandgap and limits $V_{OC}$ in kesterite thin film solar panels. To account for this, a second optimization scenario (OP2) was considered, which includes all improvements from OP1 but assumes a 100 meV mitigation of band tailing (simulated as an effective increase in the electronic bandgap used for $V_{OC}$ calculation). This leads to a projected $V_{OC}$ of 0.491 V and a striking PCE of 14.77%.
| Scenario | Description | $V_{OC}$ (V) | $J_{SC}$ (mA/cm²) | FF (%) | PCE (%) |
|---|---|---|---|---|---|
| Ref. | Baseline (Fitted Device) | 0.380 | 36.5 | 54.0 | 7.53 |
| OP1 | Optimized $R_s$, $R_{sh}$, $N_t$, $D_{it}$ | 0.401 | 37.4 | 77.5 | 11.31 |
| OP2 | OP1 + 100 meV Band Tailing Mitigation | 0.491 | 37.4 | 80.5 | 14.77 |
In conclusion, this comprehensive SCAPS simulation study on a CZTSe thin film solar panel has elucidated the hierarchical impact of various loss mechanisms. The analysis reveals that for the modeled device, high series resistance is the most immediate bottleneck, severely limiting the fill factor. Bulk defect recombination becomes critically detrimental only beyond a specific density threshold linked to the carrier diffusion length. Interestingly, interface recombination’s severity is strongly conditional on the heterojunction band alignment, with cliff-like offsets being catastrophic. The path towards high-efficiency CZTSe thin film solar panels is multifaceted: it necessitates excellent contact engineering to minimize $R_s$, precise control over stoichiometry and crystallization to reduce bulk and interface defect densities below critical levels, and careful buffer layer selection or absorber surface modification to ensure a benign spike-like band alignment. Ultimately, addressing the fundamental issue of band tailing through improved material order appears indispensable for achieving $V_{OC}$ values close to the radiative limit and unlocking the full potential of kesterite-based thin film solar panels.