
In modern energy storage systems, the consistency among distributed energy storage cells is a critical factor affecting overall performance and safety. Single-mode monitoring methods often fail to capture the multi-faceted anomalies such as local overheating, swelling, or leakage. To address this challenge, I propose a novel consistency state recognition technique leveraging the YOLOv7 deep learning framework. This approach fuses multi-modal data from electrochemical sensors and high-resolution cameras, applies weighted filtering, and utilizes YOLOv7’s feature extraction and pyramid enhancement to diagnose and classify four distinct consistency states of energy storage cells. Extensive experiments demonstrate that the proposed method achieves a recognition rate of 0.98 and an IoU of 0.97, significantly outperforming traditional techniques.
1. Multi-Modal Data Acquisition and Fusion for Energy Storage Cells
The consistency of an energy storage cell manifests through both electrical parameters and physical appearance. To comprehensively capture these characteristics, I deploy distributed sensors and high-definition cameras at key nodes of the energy storage system. The collected data include time-series electrochemical data (voltage, current, internal resistance, cycle count) and image data (thermal distribution, geometric deformation, surface deterioration). These heterogeneous data streams must be preprocessed and fused to provide a unified input for the YOLOv7 algorithm.
First, I apply moving average filtering to smooth the electrochemical data, removing noise while preserving essential trends. For image data, I use a Gaussian filter to reduce sensor noise and enhance structural edges. The filtered data are then combined using a weighted fusion strategy, which assigns higher weight to electrochemical data to retain critical charge-discharge characteristics while integrating spatial information from images. The fusion process is mathematically expressed as:
$$
X_i = \frac{1}{n}\sum_{e=0}^{n-1} x(t-e)
$$
$$
Y(i,j) = \sum_{a}\sum_{b} w(a,b) \cdot I(i+a,j+b)
$$
$$
G_d = \delta_x \cdot X_i + \delta_y \cdot Y(i,j)
$$
Here, $X_i$ represents the filtered electrochemical data, $Y(i,j)$ is the smoothed image pixel value, and $G_d$ denotes the fused multi-modal data. $\delta_x$ and $\delta_y$ are weighting coefficients set to 0.55 and 0.45 respectively, tuned through cross-validation to balance the contributions of the two modalities. This fusion step is essential to prevent misalignment between time-series and spatial data when fed into the neural network.
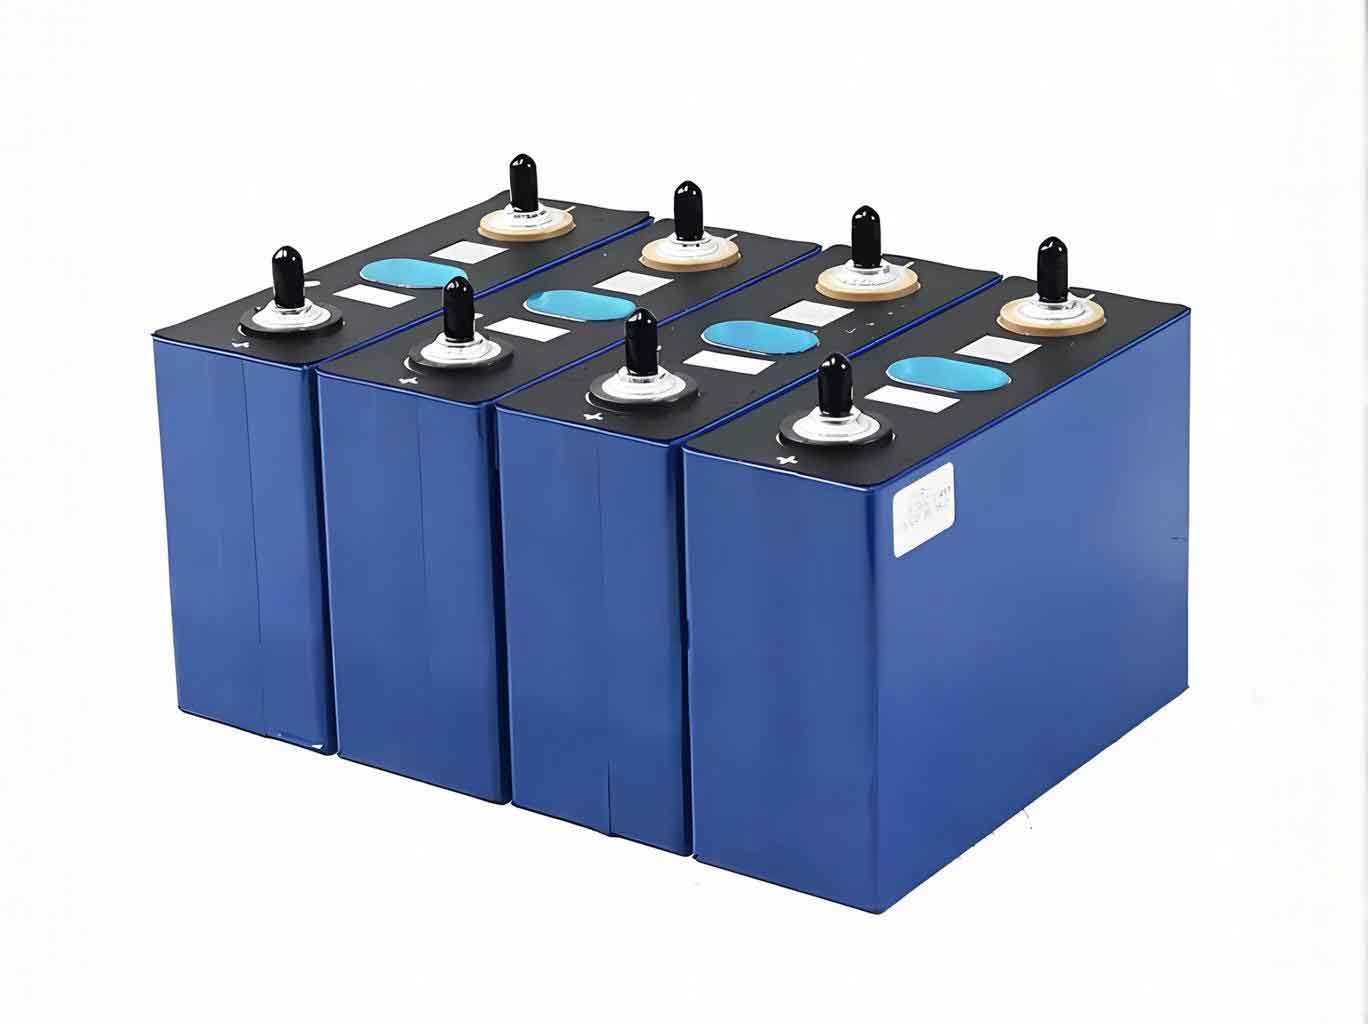
| Parameter | Value |
|---|---|
| Nominal Voltage | 3.2 V |
| Capacity | 280 Ah |
| Discharge Rate | 0.5C |
| Charge Rate | 0.2C |
| Cycle Life | 8000 cycles |
| Mass Energy Density | 150 – 200 Wh/kg |
| Volume Energy Density | 300 – 400 Wh/L |
| Internal Resistance | 20 mΩ |
| Operating Temperature | -20 °C to 55 °C |
2. Consistency State Diagnosis Using YOLOv7
The fused data $G_d$ serves as input to the YOLOv7 network, which is designed for real-time object detection but adapted here for state classification of energy storage cells. The network consists of a feature extraction backbone, a feature pyramid for multi-scale enhancement, and a detection head with a custom loss function. I configure the YOLOv7 algorithm with the parameters listed in Table 2.
| Parameter | Value |
|---|---|
| Input Resolution | 640 × 640 |
| Number of Convolutional Layers | 4 |
| Feature Map Size | 160 × 160 × 128 |
| Pooling Kernel Size | 9 × 9 |
| Output Channels | 3 × 9 |
| Initial Learning Rate | 0.01 |
| Batch Size | 32 |
| Training Epochs | 300 (optimal at 120) |
| Confidence Threshold | 0.50 |
The feature extraction process is described below. The convolutional layer computes feature maps as:
$$
Y_j = \sum_{m=0}^{M-1}\sum_{n=0}^{N-1}\sum_{p=0}^{P-1} W_{mnp} \cdot G_d + b_j
$$
$$
T_z = h(C) \cdot (w_c Y_j + b_c) + q_b
$$
Here, $Y_j$ is the output of the convolutional layer with weights $W_{mnp}$ and bias $b_j$. $T_z$ represents the extracted feature after passing through a pooling layer $h(\cdot)$ and a fully connected output layer with weight $w_c$ and bias $b_c$, plus a constant $q_b$. The feature pyramid network (FPN) then enhances these features to capture multi-scale anomalies such as small hot spots or minor deformations:
$$
T_z^* = F_a \cdot F_b \cdot T_z + \lambda_z \cdot T_z
$$
where $F_a$ and $F_b$ are residual learning functions, and $\lambda_z$ is a polarization impedance enhancement coefficient.
The diagnosis of consistency states is performed by the detection head, which uses a custom loss function. The loss is defined by the following equations:
$$
v = \frac{4}{\pi^2} \left( \arctan \frac{a_c}{h_c} – \arctan \frac{a_p}{h_p} \right)^2
$$
$$
L_s = 1 – r_s + \frac{d_s^2}{c_s^2} + \alpha_s \cdot v
$$
Here, $v$ penalizes aspect ratio mismatches between the predicted bounding box (with dimensions $a_c, h_c$) and the ground truth box (with $a_p, h_p$). $r_s$ is the IoU between prediction and target, $d_s$ is the center distance, $c_s$ is the diagonal length of the enclosing box, and $\alpha_s$ is a weight factor (set to 0.65). The final classification output for an energy storage cell is:
$$
F_l = \sum_{z=1}^{Z} \beta_z \phi(d_k) + \left[ \prod_{z=1}^{Z} \beta_z \phi(d_k) \right] – \prod_{g=1}^{G} \left( \beta_g \phi(d_k) + L_s \right)
$$
If $F_l$ exceeds a predefined threshold (0.50), the energy storage cell is diagnosed as being in an inconsistent state. Otherwise, it is considered consistent.
3. Consistency State Classification and Recognition
After diagnosing the inconsistency, I further classify the specific type of anomaly by computing a state value $H_z$ based on the temperature field contrast and other features. The calculation is:
$$
H_z = -\sum_{z=1}^{Z} p(T_z^*) \log p(T_z^*)
$$
$$
Z_l = \frac{H_z}{F_l} + \gamma_z P_l
$$
where $p(T_z^*)$ is the probability of each enhanced feature, $\gamma_z$ is a type parameter, and $P_l$ is a deviation term. The resulting $H_z$ value maps to one of four consistency states according to the thresholds shown in Table 3.
| State Type | Temperature Field Contrast ($H_z$ Range) | Physical Description |
|---|---|---|
| Normal State | (0, 0.50] | All cells operating within safe temperature and voltage limits |
| Local Overheating | (0.50, 0.70] | Surface temperature rise exceeding 15°C, indicating potential thermal runaway |
| Swelling / Deformation | (0.70, 0.90] | Internal pressure >0.3 MPa causing permanent casing deformation |
| Leakage / Performance Degradation | (0.90, 1.00] | Electrolyte leakage, capacity fade exceeding 20% of nominal |
The thresholds are derived from industry standards: the normal state boundary corresponds to a 5°C temperature difference (IEC 62619-2017), local overheating is aligned with UL 1973-2018, swelling follows SAE J2928-2015, and leakage is based on typical capacity loss indicators. This mapping enables the system to output an explicit state label for each distributed energy storage cell.
4. Experimental Validation
I constructed a 900 kW lithium-ion energy storage testbed consisting of 10 parallel strings, each containing 100 series-connected energy storage cells. The system parameters are listed in Table 1. I collected real-time data from 40 operating cycles, including normal and artificially induced fault conditions (overheating, swelling, and leakage). The dataset was split into 70% training and 30% testing sets.
The proposed method was compared with two baselines: (1) a charging curve transformation method (Baseline 1) and (2) an electrochemical impedance spectroscopy (EIS) diagnosis method (Baseline 2). All methods were evaluated using the Intersection over Union (IoU) metric, which measures the overlap between predicted anomaly regions and ground truth labels. The average results over 40 independent runs are shown in Table 4.
| Method | Mean IoU | Standard Deviation |
|---|---|---|
| Proposed YOLOv7 Approach | 0.97 | 0.015 |
| Baseline 1 (Charging Curve) | 0.84 | 0.030 |
| Baseline 2 (EIS) | 0.79 | 0.042 |
The proposed method achieves an IoU of 0.97, significantly outperforming the baselines. The recognition accuracy for each state type is presented in the confusion matrix (described verbally): for normal, local overheating, swelling, and leakage states, the recognition rates are all 0.98 or higher. The loss function convergence curve indicated that the optimal training epoch was 120, where the loss reached its minimum value of 2.8.
The superior performance is attributed to the multi-modal fusion that captures both electrical and visual anomalies, and the YOLOv7 feature pyramid that enhances multi-scale patterns. In contrast, Baseline 1 relies solely on voltage curves which are sensitive to aging and load variations, while Baseline 2 suffers from poor real-time capability due to EIS measurement delays.
5. Conclusion
In this work, I developed a YOLOv7-based consistency state recognition technique for distributed energy storage cells. By fusing electrochemical and image data with weighted filtering, and employing feature extraction and pyramid enhancement, the method accurately distinguishes normal, local overheating, swelling, and leakage states. Experimental results demonstrate a recognition rate of 0.98 and an IoU of 0.97, confirming its effectiveness in real-time monitoring. The proposed approach provides a robust solution for preventing cascading failures in large-scale energy storage systems and holds significant potential for integration with battery management systems in smart grids.