
The rapid global expansion of photovoltaic (PV) power generation, driven by the imperative for clean energy, has led to the development of truly massive solar farms. These installations, often covering vast tracts of land or water surfaces, feature arrays comprising dozens, sometimes even hundreds, of rows and columns of solar panels. The accurate assessment of wind loads on these super-large arrays is paramount for ensuring structural safety and optimizing economic design. Traditional design codes often provide wind load shape coefficients for isolated structures or small clusters, which fail to account for the significant aerodynamic interference or “shielding effects” that occur within extensive groups of bodies. This study investigates the variation of wind load shape coefficients for solar panels within such large arrays, focusing specifically on the two-dimensional flow conditions representative of the interior zones far from the array edges, and provides practical recommendations for design.
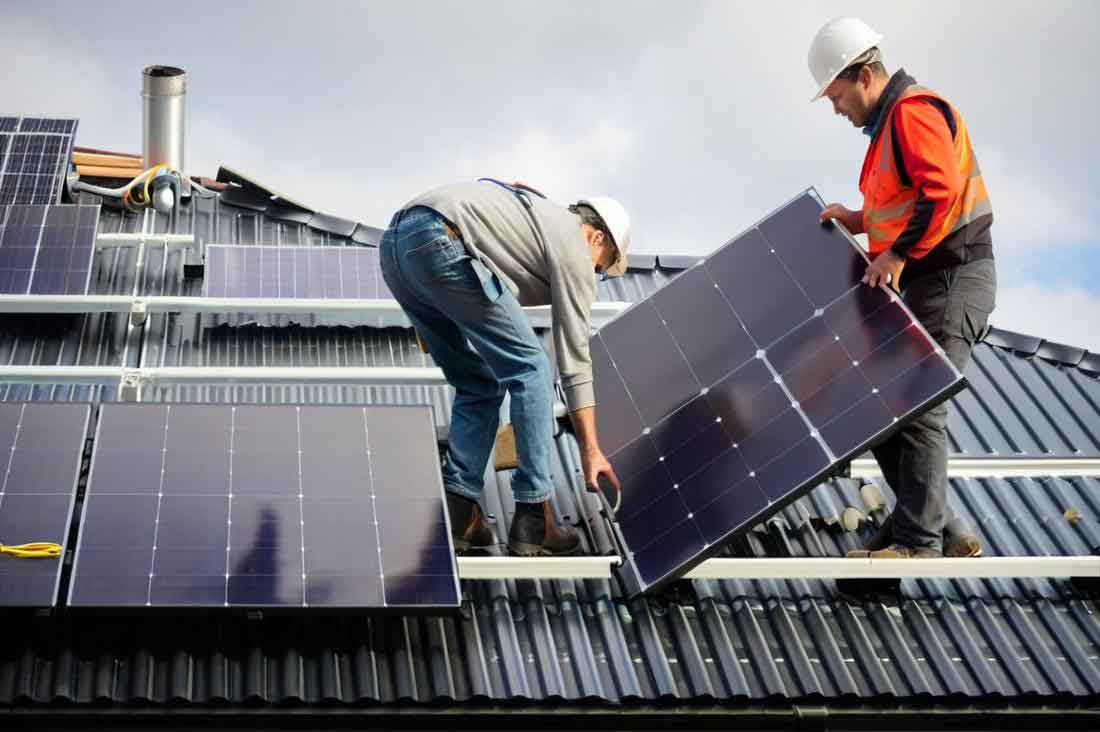
The primary aerodynamic force on a solar panel is the net pressure difference between its upper and lower surfaces. The shape coefficient, $\mu_s$, is a dimensionless parameter that quantifies this net pressure relative to the dynamic wind pressure. For an isolated solar panel, this coefficient is influenced by its tilt angle and wind direction. However, when solar panels are placed in a row, the upstream panels drastically alter the wind flow field for those downstream. This interaction leads to a reduction in the wind load experienced by the downstream solar panels—a phenomenon known as shielding. In a very long row of solar panels, it is hypothesized that this shielding effect becomes progressively stronger for the first several panels until the flow field reaches a quasi-steady state, after which the shape coefficients for subsequent solar panels stabilize.
To explore this, a combined approach of wind tunnel testing and Computational Fluid Dynamics (CFD) simulation was employed. The wind tunnel test served to establish a reliable baseline and validate the numerical model, while the CFD simulations allowed for the economical investigation of much longer solar panel rows than could be physically accommodated in the wind tunnel.
Wind Tunnel Experimental Investigation
The experimental study was conducted in a boundary layer wind tunnel. A key objective was to simulate a two-dimensional flow condition around a row of solar panels, approximating the situation for interior rows of a very wide array. To achieve this, a model spanning the entire width of the test section was constructed. The tested configuration consisted of five solar panels in a row (in the along-wind direction), with only the central column instrumented with pressure taps to measure the two-dimensional flow characteristics. A model of a single, isolated solar panel was also tested for comparison. The geometric scale was 1:2. The prototype solar panel had dimensions of 1650 mm by 992 mm with a tilt angle, $\theta$, of 12°. The spacing between panels was 650 mm. Pressure was measured simultaneously on both the upper and lower surfaces of the first four solar panels in the row at a sampling frequency of 312.5 Hz under a uniform flow with a mean velocity of 12 m/s. Two critical wind directions were tested: $\alpha = 0^\circ$ (wind hitting the backside/angled side of the tilted panel) and $\alpha = 180^\circ$ (wind hitting the front/upward-facing side).
The mean pressure coefficient, $C_{p,mean}$, for each tap was calculated from the time-history data. The net shape coefficient for the entire solar panel was then computed by integrating the pressure over its area:
$$\mu_s = \frac{\sum_{i=1}^{N} C_{p,net,i} \cdot A_i}{A_{total}}$$
where $C_{p,net,i}$ is the net pressure coefficient (upper surface minus lower surface) at tap $i$, $A_i$ is the tributary area for that tap, and $A_{total}$ is the total area of the solar panel.
The results clearly demonstrated the pronounced shielding effect. The pressure distributions on the solar panels showed that the first panel experienced the most severe loading. For the $0^\circ$ wind direction, its upper surface was under positive pressure while the lower surface was under suction. From the second solar panel onward, due to the wake of the upstream one, both surfaces experienced suction, leading to a much-reduced net force. For the $180^\circ$ direction, all panels experienced suction on the upper surface and positive pressure on the lower surface, but the magnitude again decreased significantly for downstream solar panels.
The calculated overall shape coefficients for each solar panel are summarized in the table below. A reduction factor, $\eta_k$, is defined to quantify the shielding, taking the first solar panel as the reference:
$$\eta_k = \frac{\mu_{s,k}}{\mu_{s,1}}$$
where $\mu_{s,k}$ is the shape coefficient of the k-th solar panel in the row.
| Wind Dir. $\alpha$ | Isolated Panel | Panel 1 ($\mu_{s,1}$) | Panel 2 ($\eta_2$) | Panel 3 ($\eta_3$) | Panel 4 ($\eta_4$) |
|---|---|---|---|---|---|
| 0° | 0.51 | 0.83 | 0.47 | 0.34 | 0.24 |
| 180° | -0.58 | -0.83 | 0.71 | 0.64 | 0.66 |
The data reveals several important findings. First, the shape coefficient for the first solar panel in the 2D row (0.83 or -0.83) is larger in magnitude than that for an isolated solar panel (0.51 or -0.58), highlighting the difference between two-dimensional and three-dimensional flow. Second, the shielding effect is much stronger for the $0^\circ$ wind direction than for $180^\circ$. The load on the fourth solar panel is reduced to only 24% of the first panel’s load for $0^\circ$, whereas it remains at about 66% for $180^\circ$. This asymmetry is crucial for design considerations. The extreme wind pressure coefficients, estimated as $C_{p,mean} \pm 3.5C_{p,rms}$, were also highest on the first solar panel, indicating that connection details for the leading-edge solar panels require particular attention.
CFD Numerical Simulation and Model Validation
To extend the investigation to much longer rows of solar panels, Computational Fluid Dynamics simulations were performed. A two-dimensional computational domain was set up, which is appropriate for modeling the interior section of a very wide array. The Realizable $k$-$\varepsilon$ turbulence model was selected for its robustness and accuracy in simulating flows with separation and recirculation. The geometry replicated the wind tunnel test setup for the case of five solar panels with a 12° tilt.
The mesh sensitivity was carefully checked to ensure grid-independent results. The simulated shape coefficients for the five-panel row were compared with the wind tunnel data, as shown in the figure below. The agreement was excellent, validating the chosen CFD methodology for this specific flow problem. Further confidence was gained by comparing trends with other published numerical studies on smaller solar panel arrays, which showed consistent behavior regarding the decay of loads due to shielding.
With the validated model, parametric studies were conducted. The tilt angle was varied to $\theta = 20^\circ$, and the number of solar panels in a single, long row was significantly increased to 16, 24, and 32 panels to observe the asymptotic behavior of the shielding effect.
Shielding Effects in Extensive Solar Panel Rows
The CFD simulations for long rows provided clear insight into the development of the wind flow and the resulting loads on each successive solar panel. The calculated shape coefficients for rows of 16, 24, and 32 panels at tilt angles of 12° and 20° are plotted in the figure below. The results for the first 5-6 panels from all long-row simulations closely match, confirming that the flow development near the front is independent of the total row length.
The key observations are as follows:
- Initial Sharp Attenuation: The most dramatic load reduction occurs between the first and second solar panels. For $\theta=20^\circ$ and $\alpha=0^\circ$, the load on the second solar panel drops to less than 20% of the load on the first. This indicates an extremely strong initial shielding effect for steeper angles when the wind attacks the panel back.
- Gradual Approach to Stability: After the first few solar panels, the rate of load reduction decreases. The shape coefficients continue to decay gradually until approximately the 12th solar panel in the row.
- Stable Zone: Beyond the 12th solar panel, the shape coefficients for subsequent solar panels remain essentially constant. The flow field in the gaps between solar panels has reached a fully developed, periodic state. This is a critical finding for designing large arrays.
- Effect of Tilt Angle: The shielding effect is more pronounced at a 20° tilt than at 12°. While the first panel’s load is higher at 20°, the loads on downstream panels become lower than their 12° counterparts, leading to a faster and stronger overall attenuation.
This behavior can be summarized by the trend of the reduction factor, $\eta$. The following table shows the reduction factors derived from CFD for a row of 32 panels, clearly illustrating the stabilization after panel 12.
| Panel # (k) | $\eta_k$ ($\theta=12^\circ$, $\alpha=0^\circ$) | $\eta_k$ ($\theta=20^\circ$, $\alpha=0^\circ$) | $\eta_k$ ($\theta=12^\circ$, $\alpha=180^\circ$) | $\eta_k$ ($\theta=20^\circ$, $\alpha=180^\circ$) |
|---|---|---|---|---|
| 1 | 1.00 | 1.00 | 1.00 | 1.00 |
| 2 | 0.46 | 0.19 | 0.80 | 0.38 |
| 3 | 0.32 | 0.11 | 0.73 | 0.26 |
| 4 | 0.24 | 0.09 | 0.68 | 0.20 |
| 5 | 0.19 | 0.08 | 0.65 | 0.17 |
| 6 | 0.16 | 0.08 | 0.62 | 0.16 |
| 8 | 0.13 | 0.08 | 0.57 | 0.15 |
| 10 | 0.12 | 0.08 | 0.54 | 0.15 |
| 12 | 0.11 | 0.08 | 0.52 | 0.14 |
| 16 | 0.11 | 0.08 | 0.52 | 0.14 |
| 20+ | ~0.11 | ~0.08 | ~0.52 | ~0.14 |
Practical Design Recommendations for Super-Large Solar Panel Arrays
Based on the consistent patterns observed in both wind tunnel and CFD results, a rational zoning strategy for wind load assessment on super-large, multi-row solar panel arrays is proposed. The array can be divided into three distinct zones parallel to the prevailing wind direction: the Edge Zone, the Gradient Zone, and the Stable Zone.
- Edge Zone: This comprises the first and last rows of the array (the outermost rows exposed to the undisturbed flow). These solar panels experience the highest loads with no upstream shielding. Design should be based on the shape coefficient of the first panel in a row ($\mu_{s,1}$).
- Gradient Zone: This includes the immediate downstream rows from the edge, specifically rows 2 through 12. In this zone, the shape coefficient for each solar panel row decays rapidly and must be calculated individually. The reduction factor $\eta_k$ for rows $k=2$ to $12$ can be estimated using a quadratic fit derived from the simulation data:
$$\eta_k = A_0 k^2 + B_0 k + C_0$$
where the coefficients $A_0$, $B_0$, and $C_0$ depend on the tilt angle and wind direction, as tabulated below. - Stable Zone: This encompasses all interior rows from row 13 to the opposite edge. The flow is fully developed, and the shape coefficient has reached a stable minimum value, $\mu_{s,stable}$. All solar panels in this zone can be designed for this uniform, reduced load.
The following table provides the recommended key shape coefficients for the Edge and Stable Zones, as well as the fitting parameters for the Gradient Zone reduction factor. The shape coefficient for any row in the Gradient Zone is then: $\mu_{s,k} = \eta_k \cdot \mu_{s,1}$.
| Parameter / Zone | Wind from Back ($\alpha=0^\circ$) | Wind from Front ($\alpha=180^\circ$) | ||
|---|---|---|---|---|
| $\theta=12^\circ$ | $\theta=20^\circ$ | $\theta=12^\circ$ | $\theta=20^\circ$ | |
| Edge Zone ($\mu_{s,1}$) | 0.72 | 0.78 | -0.58 | -0.62 |
| Stable Zone ($\mu_{s,stable}$) | 0.12 | 0.09 | -0.21 | -0.14 |
| Gradient Zone Fit Parameters | ||||
| $A_0$ | 0.00291 | 0.00267 | 0.00162 | 0.00055 |
| $B_0$ | -0.0853 | -0.0725 | -0.0572 | -0.0197 |
| $C_0$ | 0.7665 | 0.5991 | 0.8173 | 0.3764 |
This zoning methodology and the associated coefficients offer a more refined and economical approach to the wind-resistant design of support structures for super-large solar panel arrays. It moves beyond the conservative assumption of applying the maximum load to every solar panel, allowing for significant material savings in the vast Stable Zone while ensuring safety in the critical Edge and Gradient Zones.
Conclusions
This integrated study on the wind loads of solar panels within large arrays leads to several important conclusions for both understanding the aerodynamics and guiding engineering practice:
- The presence of upstream solar panels creates a significant shielding effect, drastically reducing the wind load on downstream solar panels. This effect is asymmetric and is generally more severe when the wind impinges on the back (angled side) of the solar panel compared to the front.
- The magnitude of the shielding effect increases with the tilt angle of the solar panel. Arrays with steeper tilt angles exhibit a faster and greater attenuation of wind loads from the leading edge inward.
- The load reduction is not infinite. After approximately the first 12 solar panels in a long, uninterrupted row, the flow reaches a developed state, and the shape coefficients stabilize. This holds true for the tilt angles and configurations studied.
- For the cost-effective and safe design of super-large solar panel arrays, a zonal design approach is recommended. The array should be divided into an Edge Zone (row 1), a Gradient Zone (rows 2-12) with progressively reducing loads, and a Stable Zone (row 13 onward) with a constant, minimized load. The quantitative recommendations for shape coefficients and reduction factors provided in this work can serve as a basis for such design.
Future work could extend this analysis to include the effects of array aspect ratio, ground clearance, non-uniform terrain, and the specific wind dynamics at the peripheral rows where three-dimensional flow effects dominate. Nevertheless, the findings presented here provide a solid foundation for appreciating and accounting for group shielding effects in the wind load assessment of modern, utility-scale solar panel installations.