
As an energy storage researcher focused on system safety, I have witnessed the critical role of energy storage technology in addressing the intermittency and volatility of renewable energy generation. It serves as a fundamental pillar for ensuring the stability and reliability of modern power grids. Among various storage technologies, the li ion battery stands out due to its high energy density, superior power density, high operating voltage, and extended cycle life. These attributes have cemented its position as a cornerstone in advanced applications, including large-scale stationary energy storage. However, the persistent occurrence of thermal runaway—an uncontrolled temperature rise initiated by exothermic chain reactions within a cell—remains the foremost challenge and a potentially catastrophic safety hazard, impeding the broader adoption of li ion battery technology. This phenomenon can be triggered or exacerbated by mechanical, electrical, and thermal abuse, often acting in a coupled manner.
My research is built upon extensive foundational work by the global scientific community, which has dedicated significant effort to understanding the mechanisms, modeling, and prevention strategies for thermal runaway. Key investigations have focused on the initiation and propagation mechanisms of thermal runaway, leading to the development of multi-stage prevention and control systems for power li ion battery packs. Innovative experimental protocols have been proposed to study internal short circuits. Furthermore, the application of reaction kinetics and energy conservation principles has enabled the creation of lumped parameter models for li ion battery thermal runaway. Complementing this, three-dimensional thermal propagation models have been established using heat transfer theory. Other significant contributions include methodologies for analyzing high-temperature thermal behavior, studies on the impact of SEI layers and separators on cell performance, and comprehensive reviews of safety strategies and operational frameworks for li ion battery-powered systems. These collective efforts provide a solid theoretical foundation for my analysis.
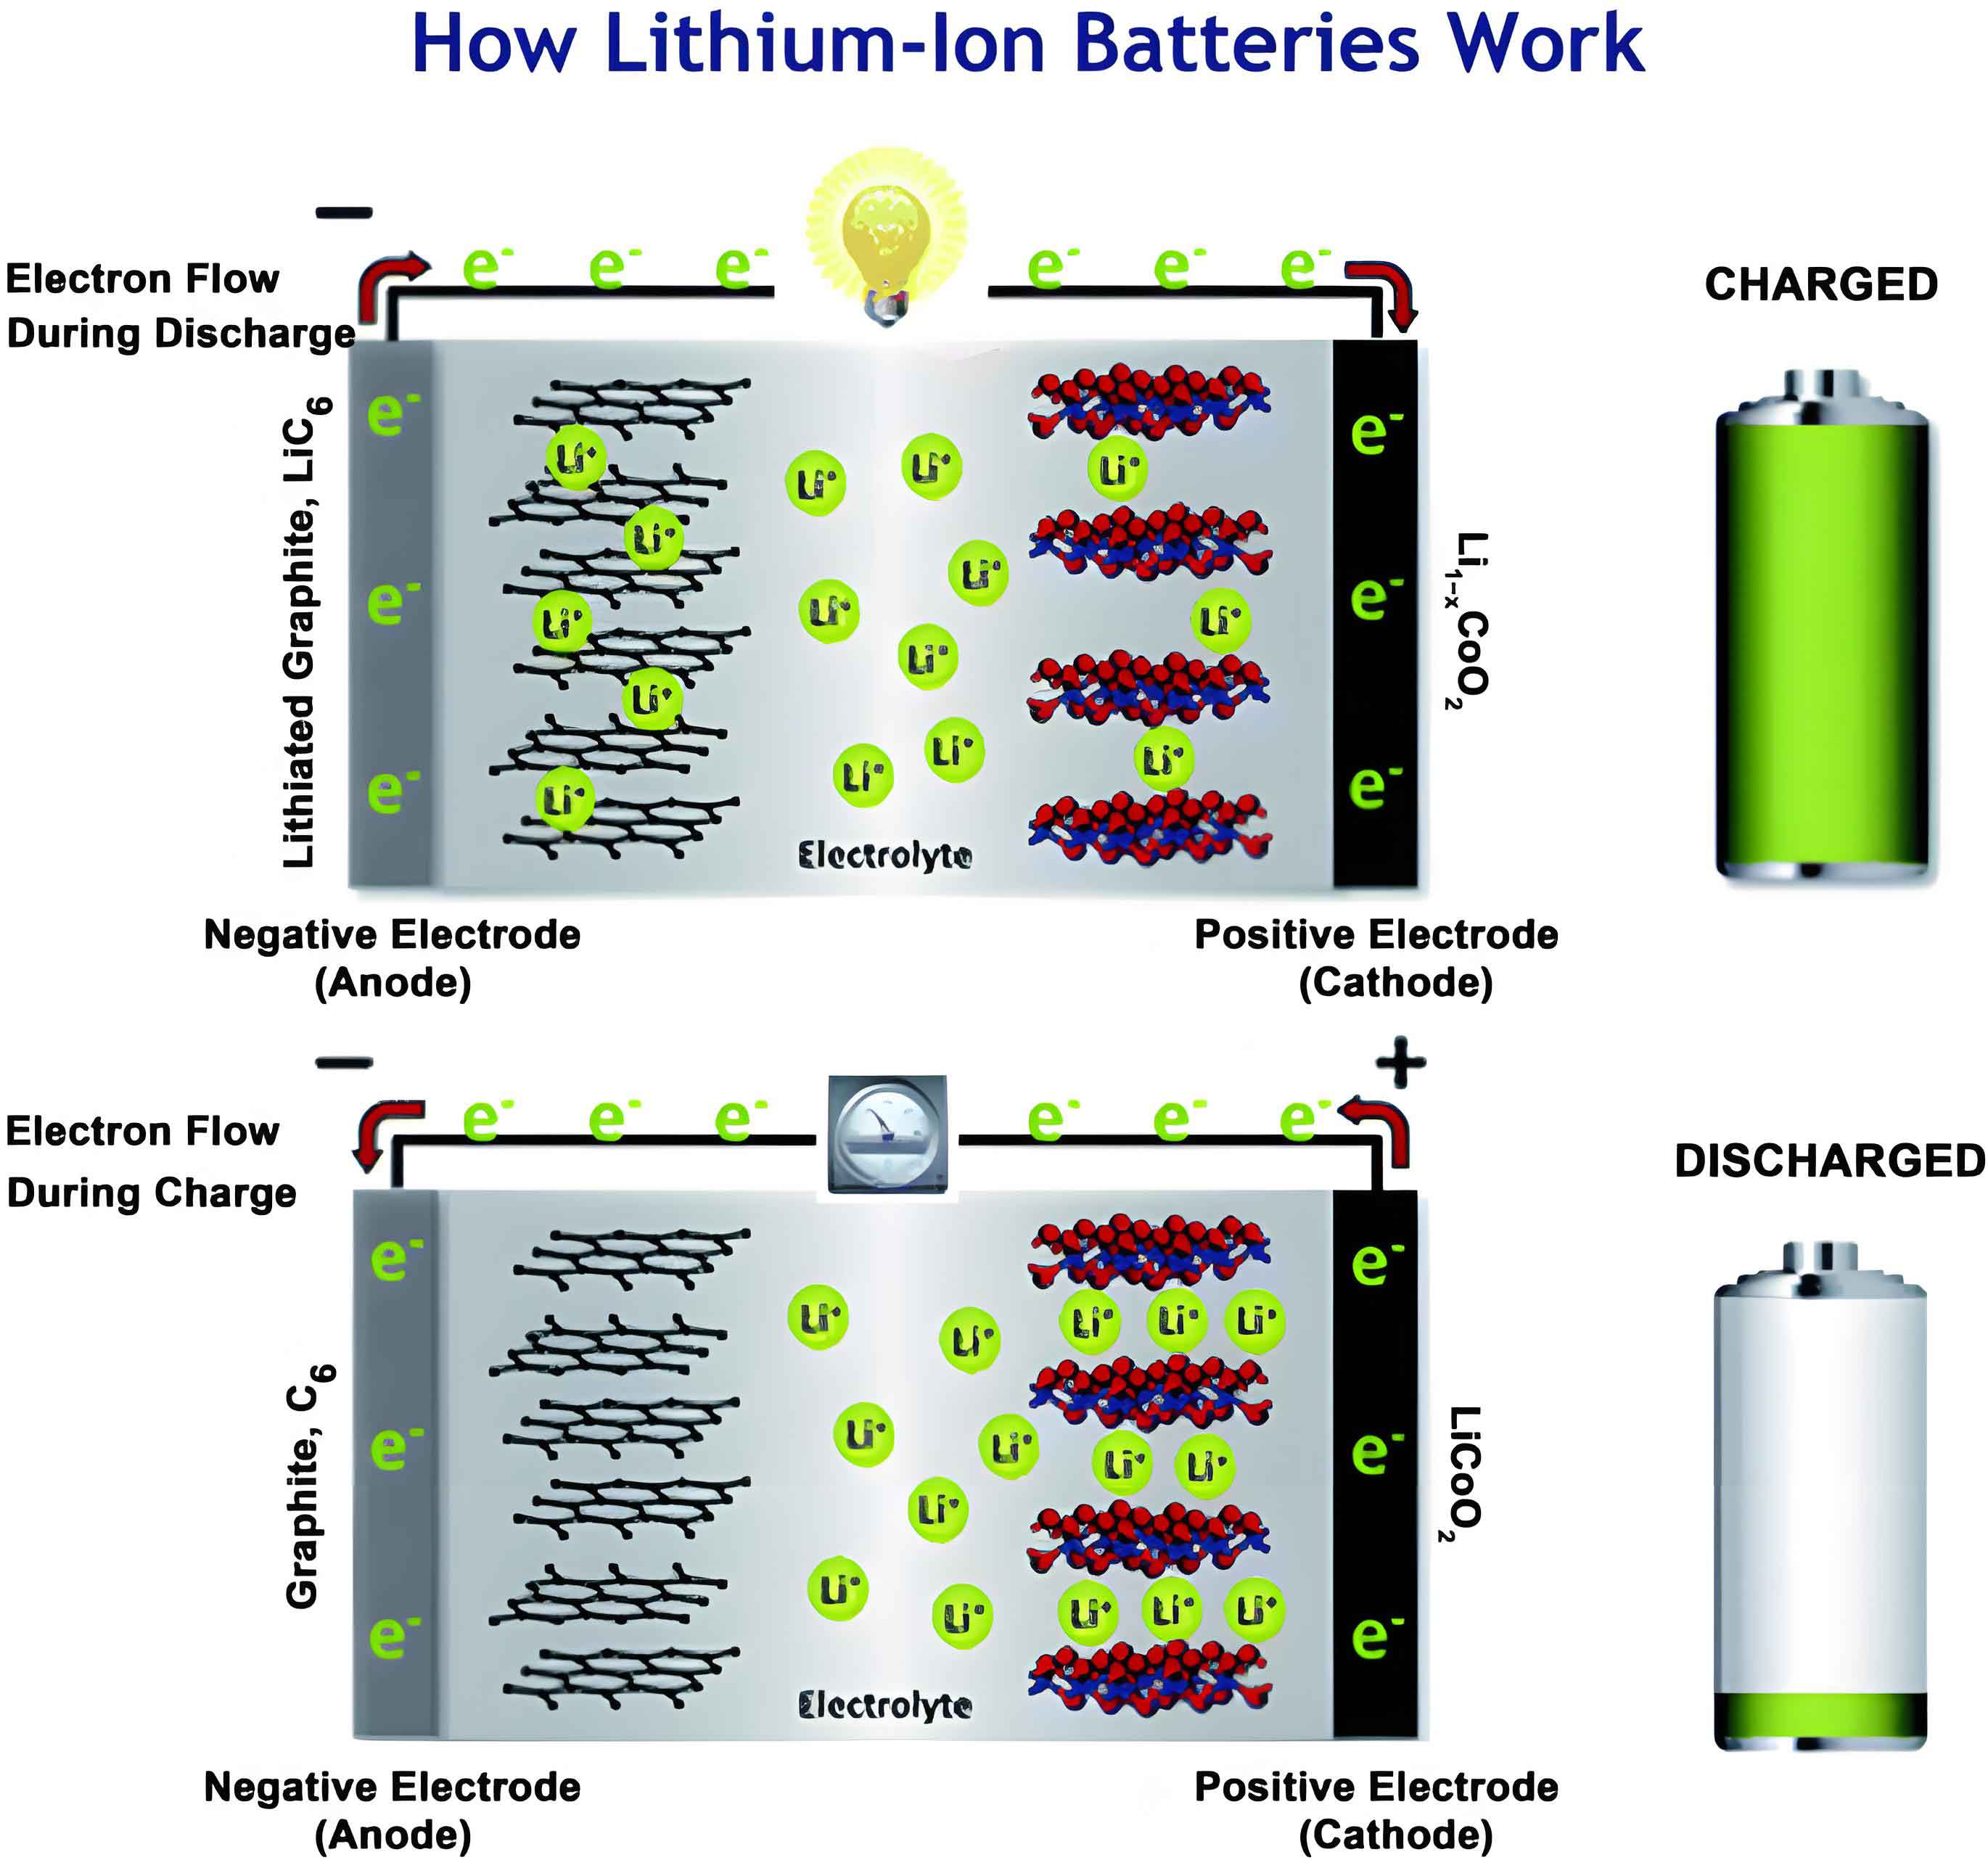
This paper primarily focuses on modeling the thermal runaway behavior of li ion battery cells under different internal states. The core of my investigation involves a detailed analysis of thermal runaway characteristics across varying States of Charge (SOC) and States of Health (SOH). I have developed and validated a lumped thermal runaway model to simulate and predict characteristic temperature points under these conditions. By comparing how these critical temperature points shift with changing SOC and SOH, I aim to provide a quantitative assessment of the associated hazards. Understanding these relationships is paramount for designing safer li ion battery management systems and storage installations.
Lumped Parameter Model for Li-ion Battery Thermal Runaway
To systematically analyze the thermal runaway process, I developed a lumped parameter model using the MATLAB Simulink platform. This model treats the li ion battery as a single entity with uniform temperature, governed by energy conservation principles. The change in battery temperature over time is described by the following integral equation, derived from the basic definition of heat capacity:
$$ T(t) = T_{\text{init}} + \frac{1}{m c_p} \int_0^t Q_{\text{total}}(\tau) \, d\tau $$
Here, \( T(t) \) represents the real-time temperature of the li ion battery in Kelvin (K). \( T_{\text{init}} \) is the initial temperature, set to 298.15 K (25°C). The parameter \( m \) denotes the mass of the cell (47 g in my simulations), and \( c_p \) is its specific heat capacity (1.02 J/g/K). The term \( Q_{\text{total}}(t) \) is the total net heat generation rate within the cell at time \( t \), measured in Watts (W). This total heat rate is the sum of all heat sources and sinks:
$$ Q_{\text{total}}(t) = Q_{\text{heat}}(t) + Q_{\text{chem}}(t) – Q_{\text{convt}}(t) $$
In this equation, \( Q_{\text{heat}}(t) \) represents the external heating power applied to the cell, simulating conditions like oven heating or internal Joule heating from abuse. \( Q_{\text{chem}}(t) \) is the total heat release rate from all exothermic chemical reactions occurring inside the li ion battery, such as solid electrolyte interphase (SEI) decomposition, negative electrode reaction with electrolyte, positive electrode decomposition, and electrolyte decomposition. \( Q_{\text{convt}}(t) \) accounts for the heat dissipated from the cell surface to the ambient environment via convection.
The chemical heat generation \( Q_{\text{chem}}(t) \) is computed as the sum of the heat release from \( N \) individual reaction steps, each modeled using Arrhenius kinetics and reaction progress:
$$ Q_{\text{chem}}(t) = \sum_{i=1}^{N} H_i \cdot \left( -\frac{dc_i(t)}{dt} \right) = \sum_{i=1}^{N} H_i \cdot A_i \exp\left( -\frac{E_{a,i}}{R_0 T(t)} \right) \cdot f(c_i(t)) $$
Where for reaction \( i \):
- \( c_i(t) \) is the normalized concentration of the reactant (from 1 to 0).
- \( H_i \) is the reaction enthalpy (J/kg).
- \( A_i \) is the pre-exponential factor (1/s).
- \( E_{a,i} \) is the activation energy (J/mol).
- \( R_0 \) is the universal gas constant (8.314 J/(mol·K)).
- \( f(c_i(t)) \) is the kinetic mechanism function, often of the form \( c_i^{n1}(t) \) or \( (1 – c_i(t))^{n2} \), where \( n1 \) and \( n2 \) are reaction orders.
The convective heat loss \( Q_{\text{convt}}(t) \) is modeled using Newton’s law of cooling:
$$ Q_{\text{convt}}(t) = h \cdot S \cdot (T(t) – T_{\text{amb}}) $$
Here, \( h \) is the convective heat transfer coefficient, set to 20 W/(m²·K) for natural convection in air. \( S \) is the surface area of the li ion battery (0.0043 m²), and \( T_{\text{amb}} \) is the constant ambient temperature (298.15 K). This lumped model, integrating these equations, allows for the simulation of the complete thermal runaway trajectory from initial heating to the final temperature decay.
Analysis of Thermal Runaway Characteristics under Different SOC
The State of Charge (SOC), defined as the ratio of remaining capacity to nominal capacity, is a primary operational parameter for any li ion battery. It significantly influences the cell’s chemical activity, thermodynamic stability, and consequently, its propensity for thermal runaway. An SOC of 100% corresponds to a fully charged cell, while 0% represents a fully discharged state. My investigation systematically explores how the thermal runaway behavior of a li ion battery changes across different SOC levels.
Phenomenological Analysis
In my simulations, the SOC is adjusted by modifying the initial normalized concentrations of the active materials in the positive and negative electrodes within the lumped model. The simulated temperature profiles for SOC levels of 100%, 75%, 50%, and 25% are plotted alongside experimental data for validation. The results show a consistent overall sequence of events across all SOC levels, but with critical shifts in timing and intensity.
The thermal runaway process for a li ion battery can be demarcated into four distinct stages based on three characteristic temperature points: Self-Heating Onset Temperature (\(T_{\text{sh}}\)), Thermal Runaway Trigger Temperature (\(T_{\text{tr}}\)), and Maximum Temperature (\(T_{\text{max}}\)).
- Stage I (Initial Slow Heating): The cell temperature increases slowly with a low average heating rate (below 0.02 °C/min in my analysis). This stage involves initial parasitic reactions like reversible capacity fade and the very beginning of SEI layer decomposition. The heat generation is modest and partially offset by endothermic processes like minor electrolyte evaporation.
- Stage II (Accelerated Self-Heating): This stage begins once the cell temperature reaches \(T_{\text{sh}}\), defined as the point where the self-heating rate sustainably exceeds 0.02 °C/min. Here, dominant exothermic reactions commence, including substantial SEI decomposition and the reaction between the intercalated lithium in the negative electrode and the electrolyte. The temperature rises steadily and more rapidly.
- Stage III (Thermal Runaway): The onset of this violent stage is marked by \(T_{\text{tr}}\), defined as the temperature at which the heating rate exceeds 60 °C/min. This drastic acceleration is caused by several concurrent events: the melting and collapse of the separator leading to large-scale internal short circuits, the exothermic decomposition of the positive electrode material, and the violent reaction of the electrolyte. A massive amount of heat is released in a very short time, driving the temperature to its peak, \(T_{\text{max}}\).
- Stage IV (Cooling): After exhausting the reactive materials, chemical heat generation ceases. The cell then cools down to ambient temperature through convection and radiation.
A clear trend observed from both simulation and experiment is that a lower SOC delays the onset of thermal runaway. A li ion battery with 25% SOC takes considerably longer to reach \(T_{\text{tr}}\) compared to one at 100% SOC under identical heating conditions. This is because at lower SOC, the negative electrode contains less lithiated carbon (LixC6), which is highly reactive with the electrolyte. Similarly, the positive electrode material in a lower state of charge (e.g., Li1-xCoO2) is more thermally stable than its fully charged counterpart (CoO2).
The characteristic temperature points extracted from my analysis for different SOC levels are summarized in the table below. The model shows good agreement with experimental data, with errors generally below 10%, validating its accuracy.
| State of Charge (SOC) | Self-Heating Onset Temp. \(T_{\text{sh}}\) (°C) | Thermal Runaway Trigger Temp. \(T_{\text{tr}}\) (°C) | Maximum Temperature \(T_{\text{max}}\) (°C) |
|---|---|---|---|
| 100% | 79.2 (Sim) / 78.5 (Exp) | 185.1 (Sim) / 182.0 (Exp) | 532.0 (Sim) / 540.0 (Exp) |
| 75% | 94.5 (Sim) / 92.0 (Exp) | 198.7 (Sim) / 195.0 (Exp) | 515.5 (Sim) / 550.0 (Exp) |
| 50% | 123.8 (Sim) / 120.0 (Exp) | 225.3 (Sim) / 220.0 (Exp) | 465.0 (Sim) / 480.0 (Exp) |
| 25% | 142.5 (Sim) / 145.0 (Exp) | 250.8 (Sim) / 255.0 (Exp) | 398.0 (Sim) / 410.0 (Exp) |
Quantitative Relationship between SOC and Characteristic Points
To quantify the observed trends, I performed polynomial curve fitting on the simulated characteristic temperatures as functions of SOC. This allows for predictive estimation of thermal runaway parameters for a given li ion battery SOC.
The relationship between SOC and the Self-Heating Onset Temperature (\(T_{\text{sh}}\)) is strongly inverse. A third-order polynomial provides an excellent fit:
$$ T_{\text{sh}}(SOC) = p_1 \cdot SOC^3 + p_2 \cdot SOC^2 + p_3 \cdot SOC + p_4 $$
where \( p_1, p_2, p_3, p_4 \) are fitted coefficients. The fit reveals that \(T_{\text{sh}}\) can vary from approximately 80°C at 95% SOC to about 145°C at 35% SOC. This underscores the heightened sensitivity of a fully charged li ion battery to thermal abuse, as its self-accelerating reactions begin at a much lower temperature.
Similarly, the Thermal Runaway Trigger Temperature (\(T_{\text{tr}}\)) exhibits an inverse relationship with SOC, described by another third-order polynomial:
$$ T_{\text{tr}}(SOC) = q_1 \cdot SOC^3 + q_2 \cdot SOC^2 + q_3 \cdot SOC + q_4 $$
The fitted curve indicates \(T_{\text{tr}}\) rises from around 185°C at 100% SOC to nearly 255°C at 25% SOC. This significant shift means a highly charged cell will transition into violent thermal runaway at a lower bulk temperature, leaving a shorter window for safety interventions.
In contrast, the Maximum Temperature (\(T_{\text{max}}\)) shows a direct, roughly proportional relationship with SOC:
$$ T_{\text{max}}(SOC) = r_1 \cdot SOC^3 + r_2 \cdot SOC^2 + r_3 \cdot SOC + r_4 $$
The peak temperature can soar to over 530°C at 95% SOC but drops to around 340°C at 35% SOC. This is logically explained by the total chemical energy stored in the cell: a higher SOC means more available lithium and higher oxidation states in the cathode, leading to more intense and complete exothermic reactions during the runaway, thereby releasing more energy and generating a higher \(T_{\text{max}}\). This relationship directly links the energy content of a li ion battery to the severity of a potential thermal runaway event.
Analysis of Thermal Runaway Characteristics under Different SOH
The State of Health (SOH) reflects the aging degree of a li ion battery, defined as the ratio of its current maximum capacity to its initial nominal capacity. A SOH of 100% indicates a fresh cell, while lower values signify degradation due to cycling and calendar aging. Aging alters internal parameters like impedance, active material mass, and electrode structure, which can influence thermal stability. My analysis models SOH indirectly by simulating the effects of equivalent cycle numbers (100 to 600 cycles) on the model parameters, primarily focusing on the increase in internal resistance and the loss of active lithium inventory.
Phenomenological Analysis
The simulated thermal runaway temperature profiles for cells at different cycle counts (representing decreasing SOH) maintain the same four-stage structure. However, the key differences lie in the timing and the self-heating onset point. A clear trend is that a lower SOH (higher cycle count) prolongs the time to reach the thermal runaway trigger point under a constant external heat flux. This is primarily attributed to the increased internal resistance (\(R_i\)) of an aged li ion battery. While this higher resistance leads to more Joule heating during operation (\(I^2R_i\)), under an external thermal abuse scenario, it also means the cell has a slightly higher baseline heat generation even before major reactions start, potentially allowing it to reach the threshold for SEI decomposition slightly sooner. More importantly, the loss of cyclable lithium (active lithium inventory) reduces the total amount of reactive material available for the major exothermic reactions involving the negative electrode.
The heating rate profiles provide further insight. While the final violent runaway stage appears similar, the initial self-heating phase can show variations in rate for aged cells, reflecting the complex interplay between increased impedance heat and reduced reactive material.
The characteristic temperature points extracted from simulations across different SOH states are summarized below. The results reveal a distinct pattern compared to SOC variations.
| Cycle Count (≈ Decreasing SOH) | Self-Heating Onset Temp. \(T_{\text{sh}}\) (°C) | Thermal Runaway Trigger Temp. \(T_{\text{tr}}\) (°C) | Maximum Temperature \(T_{\text{max}}\) (°C) |
|---|---|---|---|
| 100 | 59.8 | 184.5 | 523.8 |
| 200 | 65.2 | 182.1 | 501.2 |
| 300 | 70.1 | 183.8 | 498.5 |
| 400 | 74.3 | 181.3 | 502.7 |
| 500 | 77.9 | 185.0 | 496.9 |
| 600 | 80.5 | 182.6 | 499.5 |
Quantitative Relationship between SOH and Characteristic Points
I performed higher-order polynomial fitting on the simulated data to elucidate the trends between cycle count (inverse proxy for SOH) and the characteristic temperatures.
The Self-Heating Onset Temperature (\(T_{\text{sh}}\)) demonstrates a clear positive correlation with cycle count (i.e., negative correlation with SOH). A fifth-order polynomial fits the data well:
$$ T_{\text{sh}}(Cycle) = s_1 \cdot Cycle^5 + s_2 \cdot Cycle^4 + … + s_6 $$
\(T_{\text{sh}}\) increases from about 60°C after 100 cycles to over 80°C after 600 cycles. This rise can be attributed to the aging-induced changes: while impedance heating might promote earlier temperature rise, the dominant factor appears to be the passivation and thickening of the SEI layer, which may require a higher temperature to initiate its decomposition—the key reaction that starts the self-heating cascade. Furthermore, loss of active lithium reduces the reactivity of the anode.
The Thermal Runaway Trigger Temperature (\(T_{\text{tr}}\)) shows no consistent monotonic trend with cycle count/SOH. The values fluctuate non-systematically between 181°C and 185°C. This indicates that the fundamental chemical thermodynamics of the major decomposition reactions (especially the cathode decomposition which is a primary driver of the violent runaway) are not drastically altered by the aging mechanisms modeled here. The trigger point remains largely determined by the material properties of the electrodes and electrolyte, not solely by the aging state of the li ion battery.
Similarly, the Maximum Temperature (\(T_{\text{max}}\)) exhibits no clear trend with cycle count, hovering around 500°C ± 25°C. The slight reduction from the 100-cycle point (523.8°C) to the others (~500°C) could be linked to the loss of active lithium, which slightly reduces the total chemical energy available for release. However, the variation is not pronounced or monotonic, suggesting that for the tested aging conditions, the severity of a fully developed thermal runaway event, in terms of peak temperature, is not strongly dependent on SOH, unlike its strong dependence on SOC. The remaining energy in the aged but fully charged li ion battery is still sufficient to produce an extremely severe event.
Conclusion
Through the development and application of a lumped parameter thermal runaway model on the MATLAB Simulink platform, grounded in Arrhenius kinetics and energy conservation principles, I have conducted a systematic investigation into the thermal runaway characteristics of li ion battery cells under varying internal states. The model’s validity was confirmed by its close agreement with experimental data across different SOC levels.
The analysis of State of Charge (SOC) reveals profound and systematic influences. I established quantitative relationships demonstrating that SOC is inversely proportional to both the Self-Heating Onset Temperature (\(T_{\text{sh}}\)) and the Thermal Runaway Trigger Temperature (\(T_{\text{tr}}\)), while being directly proportional to the Maximum Temperature (\(T_{\text{max}}\)). Critically, a higher SOC leads to a significantly shorter time to trigger thermal runaway under abuse conditions. This clearly indicates that a fully charged li ion battery presents the highest imminent hazard: it becomes unstable at a lower temperature, transitions to violent runaway more quickly, and reaches a more extreme peak temperature, thereby posing a greater risk of fire propagation and gas explosion.
The analysis of State of Health (SOH), modeled via equivalent cycle counts, presents a more nuanced picture. The primary finding is that SOH has a strong inverse relationship with \(T_{\text{sh}}\); aged cells begin self-heating at a higher temperature, likely due to SEI stabilization and lithium inventory loss. However, neither the Thermal Runaway Trigger Temperature (\(T_{\text{tr}}\)) nor the Maximum Temperature (\(T_{\text{max}}\)) showed a strong, consistent monotonic dependence on SOH within the studied range. The aging mechanisms primarily increased the time to failure but did not fundamentally alter the ultimate severity of the runaway event in terms of peak temperature. Nevertheless, a lower SOH prolonged the time to thermal runaway trigger, potentially allowing a slightly longer window for detection and intervention.
These findings have direct implications for the safety management of li ion battery systems, particularly in large-scale energy storage. Risk assessments and thermal management strategies must prioritize high-SOC conditions as periods of elevated danger. Safety protocols, such as derating charging currents or enhancing cooling near full charge, could be implemented. While aged batteries may show delayed thermal response, they remain capable of catastrophic failure, and their management must not be relaxed. Integrating SOC and SOH-aware algorithms into Battery Management Systems (BMS) to dynamically adjust safety thresholds and cooling demands represents a critical step forward in mitigating the risk of thermal runaway in li ion battery installations.