
In the evolving landscape of urban mobility, A00-level micro electric vehicles have emerged as a pivotal solution to alleviate traffic congestion and reduce energy consumption due to their compact size, safety, and lightweight design. Currently, the primary power source for these vehicles is lithium-ion batteries. However, under low-temperature conditions, lithium-ion batteries suffer from significant capacity fade and increased internal resistance, leading to substantial performance degradation. Addressing these challenges in terms of power performance and driving range has become a critical technical hurdle. In contrast, sodium-ion batteries offer notable advantages, including superior low-temperature performance, lower cost, and enhanced safety. Although sodium-ion batteries generally exhibit lower energy density compared to lithium-ion batteries, their applicability in A00 micro electric vehicles is strong due to the relatively lower demands for power and range in this vehicle segment. This study, conducted from a first-person research perspective, aims to quantitatively compare the power and endurance performance of sodium-ion battery and lithium-ion battery systems in A00 micro electric vehicles under various temperature conditions, with a focus on low-temperature scenarios. Through experimental testing, modeling, and simulation, we provide insights into the feasibility and benefits of adopting sodium-ion battery technology in this context.
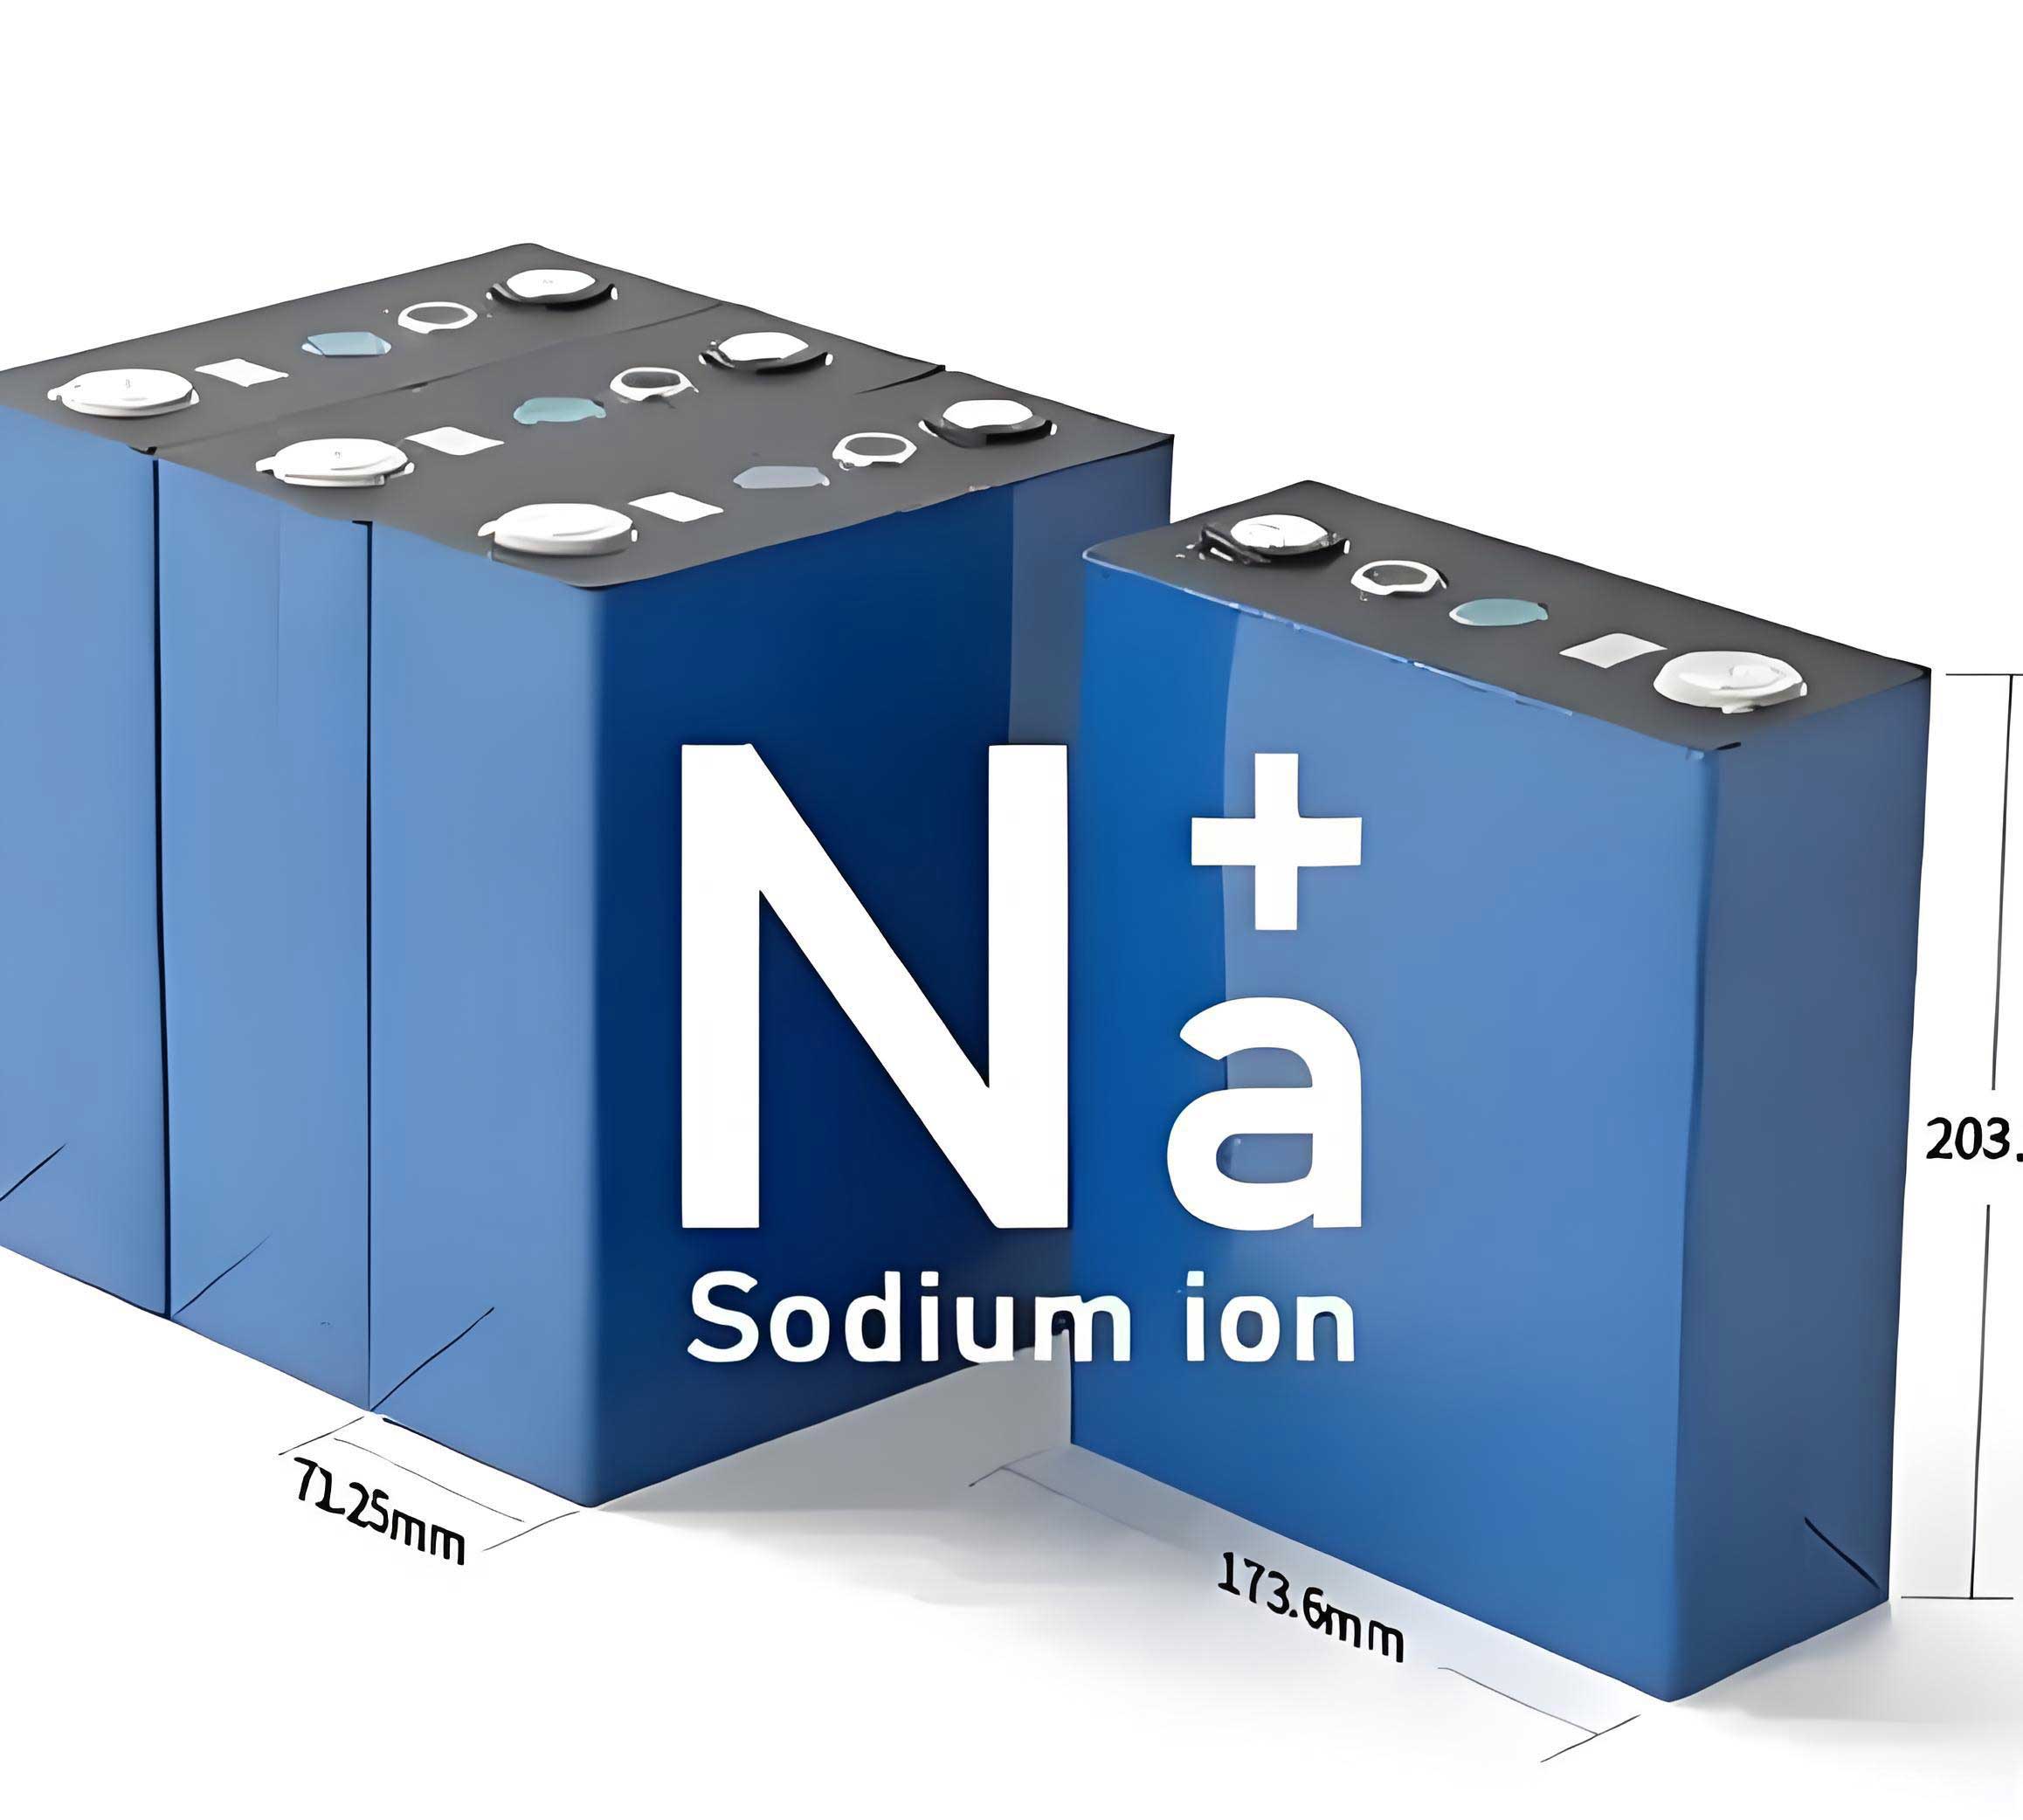
The core of this investigation lies in a detailed experimental and simulation-based approach. We begin by establishing a comprehensive performance database for both battery types under different states of charge (SOC) and temperature conditions. This is achieved through capacity calibration tests and Hybrid Pulse Power Characterization (HPPC) tests. The test platform consists of a control terminal, a battery testing system, and a programmable constant temperature and humidity test chamber, ensuring precise environmental control. Key parameters for the lithium-ion and sodium-ion battery cells used are summarized in Table 1.
| Parameter | Lithium-ion Cell | Sodium-ion Cell |
|---|---|---|
| Nominal Voltage | 3.2 V | 3.0 V |
| Nominal Capacity | 1.8 Ah | 1.3 Ah |
| Charge Cut-off Voltage | 3.65 V | 4.00 V |
| Discharge Cut-off Voltage | 2.0 V | 2.0 V |
| Maximum Discharge Current | 5.4 A | 13.0 A |
| Maximum Charge Current | 1.8 A | 2.6 A |
| Operating Temperature Range | -20 °C to 60 °C | -10 °C to 40 °C |
The capacity calibration tests, conducted at 25°C, involved multiple cycles of constant-current and constant-voltage charging followed by constant-current discharging. The results, as shown in Figure 1, indicate that while lithium-ion batteries have a higher capacity per unit volume, their capacity is more sensitive to temperature decreases. From 35°C to -5°C, the average discharge capacity of the lithium-ion battery decreased by approximately 26.67% of its nominal capacity. In contrast, the sodium-ion battery exhibited a more gradual decline, with only an 11.2% reduction at -5°C. This highlights a key advantage of the sodium-ion battery in maintaining capacity stability across temperatures.
Subsequently, HPPC tests were performed at various temperatures (-5°C, 0°C, 15°C, 25°C, and 35°C) to capture the dynamic response and internal resistance characteristics. The test protocol involved a series of discharge and charge pulses at different SOC levels. The terminal voltage profiles, for instance at 25°C, revealed distinct behaviors: the lithium-ion battery voltage showed an initial drop followed by relative stability as SOC decreased, whereas the sodium-ion battery voltage decreased more linearly. The data from these tests are crucial for parameter identification in the battery model.
To simulate the battery pack behavior in a vehicle, we adopted a simplified second-order RC equivalent circuit model. This model effectively balances accuracy and computational efficiency. The circuit comprises an open-circuit voltage source (Uoc), an ohmic resistor (R0), and two RC parallel networks (R1C1 and R2C2) representing polarization effects. The governing equations are derived from Kirchhoff’s laws. The current I through the circuit is given by:
$$ I = \frac{U_1}{R_1} + C_1 \frac{dU_1}{dt} $$
$$ I = \frac{U_2}{R_2} + C_2 \frac{dU_2}{dt} $$
The terminal voltage UL is:
$$ U_L = U_{oc} + I R_0 + U_1 + U_2 $$
Solving these differential equations leads to the final expression for terminal voltage:
$$ U_L = U_{oc} + I R_0 + I R_1 \left(1 – e^{-\frac{t}{\tau_1}}\right) + I R_2 \left(1 – e^{-\frac{t}{\tau_2}}\right) $$
where the time constants are $\tau_1 = R_1 C_1$ and $\tau_2 = R_2 C_2$. The equivalent total resistance as a function of time is:
$$ R = R_0 + R_1 \left(1 – e^{-\frac{t}{\tau_1}}\right) + R_2 \left(1 – e^{-\frac{t}{\tau_2}}\right) $$
Using the HPPC test data, we performed parameter identification for both battery types across different temperatures and SOC levels. The process minimized the root mean square error (RMSE) between the model output and experimental data. The identified internal resistance matrices are summarized in Table 2 for key SOC points at -5°C and 35°C, illustrating the comparative behavior.
| Battery Type | T (°C) | SOC 0.2 | SOC 0.5 | SOC 0.8 |
|---|---|---|---|---|
| Lithium-ion | -5 | 0.85 | 0.62 | 0.48 |
| 35 | 0.12 | 0.09 | 0.07 | |
| Sodium-ion | -5 | 0.38 | 0.25 | 0.18 |
| 35 | 0.25 | 0.17 | 0.12 |
The results clearly show that the internal resistance of the lithium-ion battery increases dramatically at low temperatures, especially at low SOC, whereas the sodium-ion battery exhibits a more moderate and consistent change. This fundamental difference underpins the performance trends observed in vehicle simulations.
For vehicle-level analysis, we developed a comprehensive powertrain model incorporating vehicle dynamics, motor characteristics, and the battery pack model. The vehicle dynamics account for rolling resistance, aerodynamic drag, and inertial forces. The total resistive force Fres opposing motion is given by:
$$ F_{roll} = m_f g \mu $$
$$ F_{aero} = \frac{1}{2} \rho c_w A_f u^2 $$
$$ F_{iner} = m_f (1 + \beta) \frac{du}{dt} $$
$$ F_{res} = F_{roll} + F_{aero} + F_{iner} $$
where $m_f$ is the vehicle mass, $g$ is gravitational acceleration, $\mu$ is the rolling resistance coefficient, $\rho$ is air density, $c_w$ is the drag coefficient, $A_f$ is frontal area, $u$ is vehicle speed, and $\beta$ is the rotational mass factor. The motor power $P_w$ is calculated from torque $T$ and speed $n$:
$$ P_w = \frac{T n}{9550} $$
The battery pack was constructed by connecting individual cells in series and parallel to match typical A00 vehicle specifications, as detailed in Table 3. The sodium-ion battery pack required a different configuration to achieve a comparable nominal voltage and capacity to the lithium-ion pack, reflecting the lower nominal voltage and capacity per cell of the sodium-ion technology.
| Parameter | Lithium-ion Pack | Sodium-ion Pack |
|---|---|---|
| Cell Nominal Voltage | 3.2 V | 3.0 V |
| Series Cells | 45 | 48 |
| Pack Nominal Voltage | 144 V | 144 V |
| Cell Nominal Capacity | 1.8 Ah | 1.3 Ah |
| Parallel Cells | 56 | 77 |
| Pack Nominal Capacity | 100.8 Ah | 100.1 Ah |
The battery SOC is updated discretely at each simulation time step $\Delta t$ (1 second) using a power-based calculation that incorporates the identified internal resistance and open-circuit voltage maps:
$$ S_{i+1} = 1 – \frac{1}{Q_n} \sum_{i=1}^{n} \int_{t_i}^{t_i + \Delta t} \frac{U_{oc}(S_i) – \sqrt{U_{oc}^2(S_i) – 4 P_b R_i(S_i)}}{2 R_i(S_i)} \, dt $$
where $Q_n$ is the total charge capacity, $P_b$ is the load power (positive for discharge), and $R_i(S_i)$ is the internal resistance at time $i$ obtained via lookup based on temperature and SOC $S_i$.
The simulation was run under the China Light-duty vehicle Test Cycle for Passenger cars (CLTC-P) to evaluate driving range. For power performance, maximum vehicle speed was determined at different SOC levels and temperatures, considering the limitations imposed by the battery management system (BMS), which dynamically restricts maximum charge/discharge currents based on temperature and SOC.
The simulation results for maximum speed are summarized in Table 4. At high temperatures (35°C) and high SOC, both battery types allow the vehicle to reach similar top speeds. However, under low-temperature conditions (-5°C), a significant divergence occurs. The sodium-ion battery powered vehicle maintains a higher maximum speed in the mid-SOC range (0.6 to 0.8) compared to its lithium-ion counterpart. Specifically, at -5°C and SOC 0.7, the sodium-ion battery vehicle achieves a speed 3.4 km/h higher. This advantage stems from the lower internal resistance of the sodium-ion battery at low temperatures, which reduces voltage sag and associated power losses under high load. Conversely, the lithium-ion battery’s internal resistance surge at low temperatures severely limits the available current, curtailing power output.
| SOC | -5°C | 25°C | 35°C | |||
|---|---|---|---|---|---|---|
| Li-ion | Na-ion | Li-ion | Na-ion | Li-ion | Na-ion | |
| 0.9 | 114.0 | 114.0 | 118.5 | 117.8 | 119.0 | 118.2 |
| 0.7 | 98.6 | 102.0 | 117.0 | 116.5 | 118.0 | 117.5 |
| 0.5 | 78.2 | 81.5 | 115.5 | 115.0 | 117.0 | 116.0 |
| 0.3 | 60.1 | 58.9 | 113.8 | 113.2 | 115.5 | 114.0 |
| 0.1 | 47.6 | 42.3 | 110.5 | 109.8 | 112.0 | 110.5 |
The driving range simulation under the CLTC-P cycle yields crucial insights into endurance performance. The results, plotted across the temperature spectrum from -5°C to 35°C, are presented in Table 5. The lithium-ion battery vehicle demonstrates a clear advantage at high temperatures, offering a range approximately 45 km longer than the sodium-ion battery vehicle at 35°C. This is primarily due to the higher energy density of lithium-ion chemistry. However, as temperature decreases, the range of the lithium-ion vehicle declines sharply. In contrast, the range attenuation for the sodium-ion battery vehicle is far more gradual. At the low extreme of -5°C, this relationship reverses: the sodium-ion battery vehicle achieves a driving range that is 37 km longer than the lithium-ion battery vehicle. This crossover point occurs around 10-15°C, indicating the temperature regime where sodium-ion battery technology becomes competitive or superior for this application.
| Temperature (°C) | Lithium-ion Battery Vehicle | Sodium-ion Battery Vehicle | Range Difference (Na-ion – Li-ion) |
|---|---|---|---|
| -5 | 183 | 220 | +37 |
| 0 | 195 | 225 | +30 |
| 15 | 218 | 230 | +12 |
| 25 | 228 | 235 | +7 |
| 35 | 240 | 195 | -45 |
The underlying reasons for these performance trends are multifaceted. For the sodium-ion battery, the relatively stable capacity and resistance characteristics across temperatures are attributed to the lower charge transfer resistance and faster ion diffusion kinetics of sodium ions in electrolytes at low temperatures compared to lithium ions. The sodium-ion battery’s chemistry, particularly when using Prussian blue analogue cathodes as in this study, appears less susceptible to the severe electrolyte freezing and slowed electrode processes that plague lithium-ion batteries in the cold. The mathematical representation of the voltage drop under load $\Delta V$ clearly shows the impact of internal resistance $R_{int}$:
$$ \Delta V = I \cdot R_{int}(T, SOC) $$
For a given current demand $I$, a lower $R_{int}$ at low $T$, as exhibited by the sodium-ion battery, results in a smaller voltage drop, preserving operational voltage and enabling higher power delivery and efficiency.
Furthermore, the energy consumption breakdown during simulation reveals additional factors. At low temperatures, a significant portion of energy in the lithium-ion battery system is diverted to heating the battery pack itself to maintain operability, either through external heating or internal Joule heating due to high resistance. This ancillary load directly reduces the energy available for propulsion. The sodium-ion battery, with its inherently lower resistance, requires less thermal management energy, contributing to its longer range in cold climates. The total energy consumption $E_{total}$ can be expressed as:
$$ E_{total} = E_{propulsion} + E_{auxiliary} + E_{loss} $$
$$ E_{loss} = \int I^2 R_{int} \, dt $$
where $E_{propulsion}$ is the energy for driving, $E_{auxiliary}$ includes thermal management and other loads, and $E_{loss}$ is the resistive loss. The $I^2R_{int}$ loss term is markedly lower for the sodium-ion battery at low temperatures.
In conclusion, this comprehensive analysis demonstrates a compelling case for the application of sodium-ion batteries in A00-level micro electric vehicles, especially for use in regions with cold climates. While lithium-ion batteries retain an advantage in energy density and high-temperature range, the sodium-ion battery exhibits superior resilience to low-temperature conditions. Its smoother capacity fade, more stable internal resistance, and consequently better power delivery and driving range at temperatures below 15°C make it a viable and attractive alternative. The adoption of sodium-ion battery technology could significantly enhance the usability and customer satisfaction of micro electric vehicles in winter, addressing a key limitation of current electric mobility solutions. Future work should focus on optimizing the sodium-ion battery pack design for even greater energy density and conducting real-world vehicle tests to validate these simulation findings under diverse driving conditions. The potential for cost reduction and improved safety further bolsters the argument for integrating sodium-ion battery systems into the next generation of urban electric vehicles.