
The widespread adoption of electrochemical energy storage systems, particularly for grid-scale applications, has driven intensive research into lithium-ion batteries due to their high energy density and efficiency. Among various cathode chemistries, lithium iron phosphate (LiFePO4) has emerged as a leading candidate for stationary energy storage cells, owing to its inherent thermal stability, safety profile, abundance of raw materials, and cost-effectiveness. However, the development of long-cycle-life energy storage cells is often hampered by the extensive time required for lifecycle testing, which can consume up to 80% of the product development cycle. Accelerating these tests while accurately predicting service life remains a critical challenge. Temperature is commonly employed as an acceleration factor in such tests, aligning with the Arrhenius empirical model, which relates the degradation rate to thermal energy. Yet, beyond a certain threshold, elevated temperatures may alter the fundamental degradation mechanisms, leading to non-linear aging behavior and complicating life prediction models. This study systematically investigates the capacity fading behavior of graphite||LiFePO4 pouch-type energy storage cells cycled at various temperatures (25, 45, 60, 70, and 80 °C). By combining electrochemical analysis with post-mortem material characterization, we aim to delineate the evolution of degradation pathways with temperature, identify the critical temperature for mechanism shift, and provide insights for designing accelerated testing protocols and lifespan prediction models for lithium iron phosphate-based energy storage systems.
The performance and longevity of an energy storage cell are dictated by complex interplays between electrochemical reactions, material stability, and interfacial phenomena. In graphite||LiFePO4 systems, the primary contributors to capacity fade are generally categorized as loss of active lithium (LLI) and loss of active material (LAM). LLI predominantly results from irreversible consumption of lithium ions during the continuous formation, decomposition, and reformation of the solid electrolyte interphase (SEI) on the graphite anode, alongside electrolyte decomposition. LAM can arise from structural degradation of electrode materials, particle cracking, and detachment from current collectors. While these processes occur at room temperature, they are thermally activated. The Arrhenius relationship provides a framework for modeling this temperature dependence:
$$ \theta = A e^{\frac{E_a}{k_B T}} $$
where $\theta$ represents a characteristic lifetime, $A$ is the pre-exponential factor, $E_a$ is the apparent activation energy for the dominant degradation process, $k_B$ is the Boltzmann constant (8.617 × 10⁻⁵ eV/K), and $T$ is the absolute temperature. However, this model assumes a single, constant activation energy. If the dominant failure mode changes with temperature, the Arrhenius plot may exhibit a breakpoint, indicating a shift in the underlying degradation mechanism. Identifying this breakpoint is crucial for defining the valid temperature range for accelerated testing of energy storage cells.
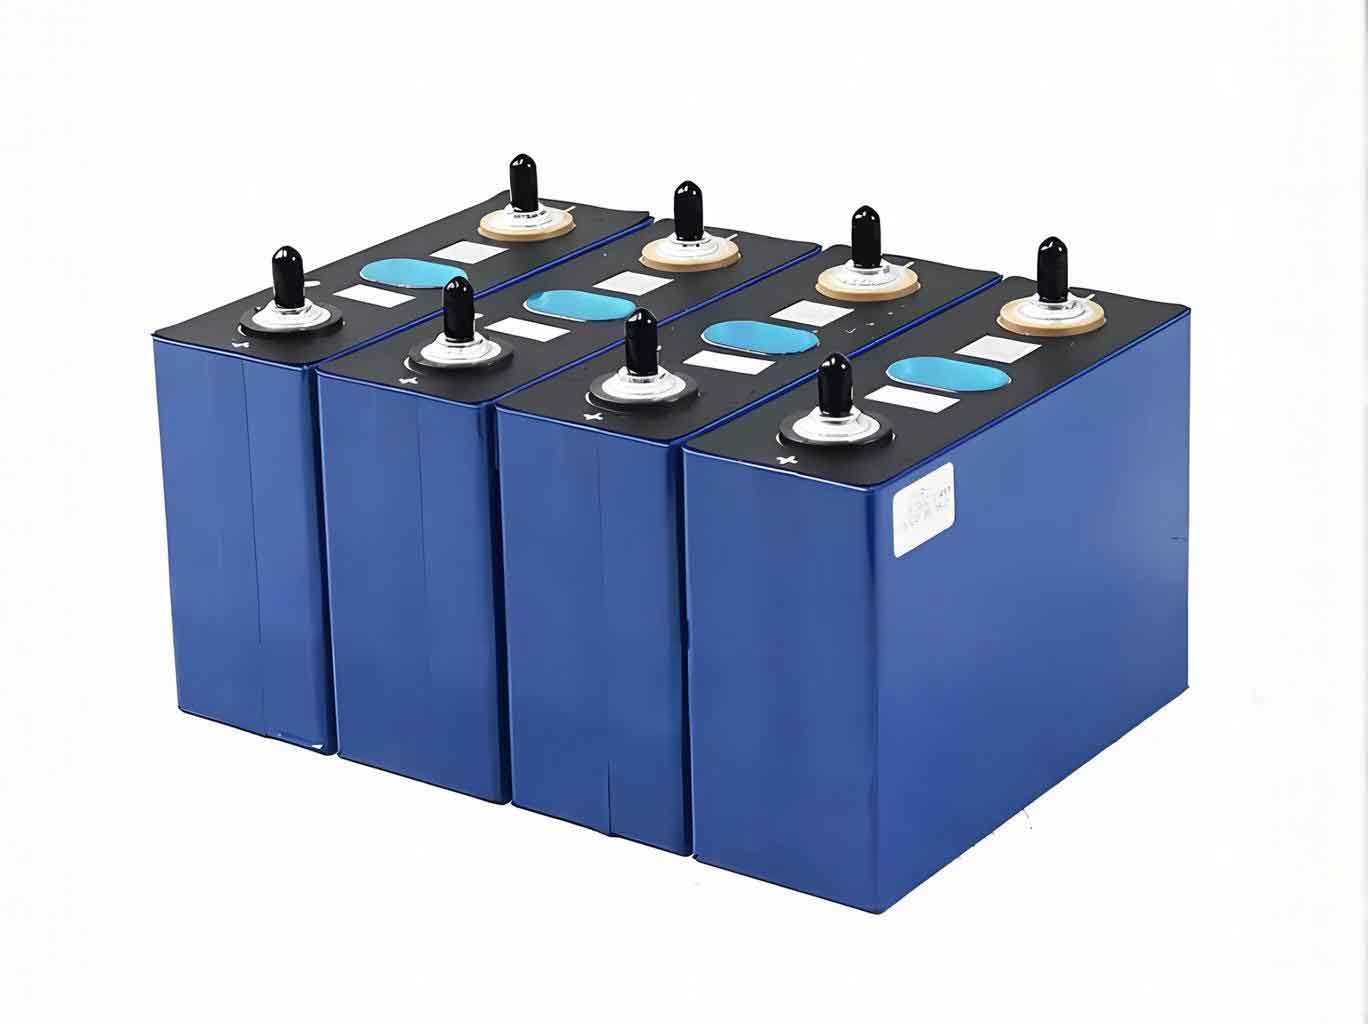
In this work, we fabricated and cycled commercial-grade 2.5 Ah graphite||LiFePO4 pouch cells. The positive electrode comprised carbon-coated LiFePO4, the negative electrode used artificial graphite, a polypropylene separator, and a liquid electrolyte consisting of 1 M LiPF6 in a mixture of ethylene carbonate (EC), ethyl methyl carbonate (EMC), and dimethyl carbonate (DMC) with 2 wt% vinylene carbonate (VC) additive. All cells underwent an initial formation and grading process. The cycling tests were conducted in controlled temperature chambers at 25, 45, 60, 70, and 80 °C. The cycling protocol involved a constant current-constant voltage (CC-CV) charge at 1C rate (2.5 A) to 3.65 V, followed by a constant voltage hold until the current dropped to 0.05C, a 30-minute rest, a constant current discharge at 1C to 2.5 V, and another 30-minute rest. This sequence constituted one full cycle. Cells were cycled until reaching specified states of health (SOH), typically 95% or 90% of their initial capacity, determined from the third formation cycle. To account for the initial capacity increase at higher temperatures due to improved kinetics, we utilized the concept of equivalent full cycles (EFC) for comparative analysis, calculated as the total accumulated charge/discharge capacity divided by twice the nominal cell capacity:
$$ N_{eq} = \frac{C_{cumulative}}{2C_0} $$
where $C_0$ is the nominal capacity (2.5 Ah). Electrochemical analysis focused on voltage-capacity profiles and differential capacity (dQ/dV) curves, which are sensitive indicators of electrode-specific degradation. Post-mortem analysis was performed on cells discharged to 2.5 V. Electrodes were carefully extracted, washed in dimethyl carbonate (DMC), and dried in a vacuum. Characterization techniques included scanning electron microscopy (SEM) for electrode morphology, X-ray diffraction (XRD) for crystal structure analysis, and inductively coupled plasma optical emission spectroscopy (ICP-OES) for quantitative elemental analysis of electrode materials, particularly to detect transition metal dissolution.
The cycling performance of the energy storage cells across different temperatures revealed a strong thermal dependence. Figure 1(a) in the original study illustrated the capacity retention over 1200 cycles. At 25 °C, the cell retained about 95% of its initial capacity after 1200 cycles. As temperature increased, degradation accelerated significantly. After the same number of cycles, capacity retention dropped to approximately 90%, 85%, 80%, and 75% at 45, 60, 70, and 80 °C, respectively. The initial charge-discharge curves (Figure 1(b) original) showed a higher delivered capacity at elevated temperatures (e.g., ~5% higher at 45°C compared to 25°C), attributable to enhanced Li-ion diffusion and reduced polarization. However, this kinetic benefit is quickly overshadowed by accelerated degradation, as seen in the voltage profiles after 1200 cycles (Figure 1(c) original). To quantitatively analyze the degradation rate, we modeled the capacity loss $Q_{loss}$ (defined as $1 – SOH$) as a function of temperature and equivalent cycles:
$$ Q_{loss}(T, N_{eq}) = A e^{(-\frac{E_a}{RT})} N_{eq}^z $$
where $R$ is the universal gas constant, and $z$ is the power-law factor. Taking the logarithm, we obtain:
$$ \ln(Q_{loss}) = \ln(A) – \frac{E_a}{RT} + z \ln(N_{eq}) $$
For a period where capacity fade is relatively linear with $N_{eq}$, plotting $\ln(Q_{loss})$ versus $\ln(N_{eq})$ yields a line with a y-intercept $ \ln(Q_0) = \ln(A) – \frac{E_a}{RT}$. The values of $\ln(Q_0)$ extracted from linear fits for cells cycled at different temperatures are summarized in Table 1.
| Cycle Temperature (°C) | Absolute Temperature, T (K) | 1/T (K-1) | $\ln(Q_0)$ (from fit) | Calculated Activation Energy, Ea (eV) for T ≤ 60°C |
|---|---|---|---|---|
| 25 | 298.15 | 0.003354 | -5.82 | ~0.58 ± 0.03 |
| 45 | 318.15 | 0.003143 | -5.15 | |
| 60 | 333.15 | 0.003002 | -4.73 | |
| 70 | 343.15 | 0.002914 | -4.35 | Deviation observed |
| 80 | 353.15 | 0.002832 | -3.98 | Deviation observed |
According to the Arrhenius model, a plot of $\ln(Q_0)$ versus the inverse absolute temperature ($-1/T$) should be linear if the activation energy $E_a$ is constant. Our data, plotted in Figure 3 of the original study, showed a clear linear relationship for temperatures up to 60 °C. A linear regression through the points for 25, 45, and 60 °C yielded an apparent activation energy of approximately 0.58 eV. This value is consistent with reported activation energies for SEI growth and related interfacial reactions in graphite-based anodes. However, the data points for 70 and 80 °C deviated significantly below the extrapolated line from the lower temperature data. This deviation indicates a change in the dominant degradation mechanism, leading to an effective increase in the degradation rate constant beyond what would be predicted by the lower-temperature activation energy. We identify this inflection point, around 60-70 °C, as the critical temperature for degradation mechanism shift in this specific energy storage cell chemistry.
To deconvolute the contributions of LLI and LAM to capacity fade, differential capacity (dQ/dV) analysis was employed. The dQ/dV curves for fresh and aged energy storage cells at various temperatures are shown in Figure 4 of the original manuscript. For LiFePO4 cells, the major peaks in the dQ/dV curve correspond to the two-phase redox reaction between LiFePO4 and FePO4. The area under Peak I (around 3.4-3.45 V during charge) is primarily associated with the amount of cyclable lithium, while the area under Peak II (around 3.32-3.38 V during discharge) is more sensitive to the available active material in the positive electrode. Shifts in peak positions indicate changes in polarization. We observed that for cells cycled at higher temperatures (60, 70, 80 °C) and aged to 90% SOH, Peak I showed a more pronounced reduction in area compared to a cell cycled at 25 °C to 95% SOH. Furthermore, the peaks shifted slightly to higher voltages at elevated temperatures, indicating reduced electrochemical polarization due to faster kinetics. The quantitative analysis of capacity loss partitioning is presented in Table 2, based on the relative area changes of Peaks I and II.
| Aging Condition (Temperature – Final SOH) | Active Lithium Loss (LLI) Contribution to Total Fade | Active Material Loss (LAM) Contribution to Total Fade | Notes on dQ/dV Peak Changes |
|---|---|---|---|
| 25 °C – 95% SOH | ~65% | ~35% | Minor peak shift, moderate area reduction in both peaks. |
| 45 °C – 90% SOH | ~72% | ~28% | Increased LLI share, peak shift towards higher voltage. |
| 60 °C – 90% SOH | ~78% | ~22% | LLI dominates, more significant Peak I area loss. |
| 70 °C – 90% SOH | ~82% | ~18% | Strong LLI dominance, noticeable positive peak broadening. |
| 80 °C – 90% SOH | ~85% | ~15% | LLI is the overwhelming factor, peaks show voltage shift and shape change. |
The results clearly demonstrate that as cycling temperature increases, the proportion of capacity fade attributable to LLI rises significantly, becoming the dominant factor above 60 °C. This points towards accelerated interfacial side reactions at the graphite anode as the primary driver for performance decay under high-temperature cycling of this energy storage cell.
Post-mortem material characterization provided direct evidence supporting the electrochemical analysis and elucidating the physical and chemical changes. SEM images of the graphite anode surfaces (representative of Figure 6 original) revealed a progressive increase in surface deposits with cycling temperature. At 25 and 45 °C, the graphite particles were covered with a relatively thin, uniform SEI layer. At 70 and 80 °C, cycled to 90% SOH, the particles were heavily coated with thick, inhomogeneous deposits, indicating massive electrolyte decomposition and SEI overgrowth. More critically, cross-sectional SEM analysis (Figure 7 original) showed that while graphite particles from cells cycled at ≤60 °C remained largely intact, those from cells cycled at 70 and 80 °C exhibited extensive internal cracking. This micro-cracking creates fresh surfaces for continuous electrolyte reduction, perpetuating a vicious cycle of SEI repair, lithium consumption, and mechanical stress generation, ultimately leading to particle isolation and LAM.
On the cathode side, SEM of LiFePO4 particles (Figures 8 & 9 original) showed that temperatures up to 60 °C caused some internal micro-cracks within large secondary particles, likely due to repeated lattice stress from Li-ion insertion/extraction. However, at 70 and 80 °C, these cracks became more severe and widespread, with some particles showing near-complete fracture. This severe mechanical degradation directly contributes to LAM by disconnecting active material from the conductive matrix and increasing impedance.
ICP-OES analysis of the cycled graphite anodes yielded compelling data on the nature of side reactions. The detected levels of phosphorus (P) and iron (Fe) are summarized in Table 3. Phosphorus originates from the decomposition of the LiPF6 salt and subsequent reaction products (e.g., LixPFyOz, LiF). The monotonic increase in P content with temperature confirms accelerated electrolyte decomposition. The presence of iron is a clear indicator of transition metal dissolution from the LiFePO4 cathode. The dissolution reaction is acid-catalyzed:
$$ 2H^+ + LiFePO_4 \rightarrow Fe^{2+} + LiH_2PO_4 $$
Acidic species like HF are generated from thermal and hydrolytic decomposition of LiPF6:
$$ LiPF_6 \rightleftharpoons LiF + PF_5 $$
$$ PF_5 + H_2O \rightarrow POF_3 + 2HF $$
This process is highly temperature-sensitive. The dissolved Fe2+ ions migrate through the electrolyte and separator, ultimately reducing and depositing on the graphite anode surface. These metallic deposits can catalytically promote further electrolyte decomposition and SEI growth, exacerbating LLI. The data shows a dramatic jump in Fe deposition between 60 and 70 °C, aligning perfectly with the identified mechanism shift temperature.
| Cycling Condition (Temperature – Final SOH) | P Content in Anode (ppm by mass) | Fe Content in Anode (ppm by mass) | Inferred Processes |
|---|---|---|---|
| 25 °C – 95% SOH | ~1600 | ~99 | Baseline SEI formation, minimal Fe dissolution. |
| 45 °C – 90% SOH | ~2610 | ~137 | Accelerated electrolyte/SEI reactions, slight increase in Fe. |
| 60 °C – 90% SOH | ~3252 | ~460 | Significant electrolyte decomposition, Fe dissolution becomes notable. |
| 70 °C – 90% SOH | ~3737 | ~682 | Severe electrolyte breakdown, strong Fe dissolution/deposition. |
| 80 °C – 90% SOH | ~5670 | ~802 | Very severe side reactions, high catalytic Fe deposition. |
| 80 °C – 80% SOH | ~8237 | ~2288 | Extreme degradation state, massive Fe accumulation. |
XRD analysis provided insights into the structural stability of the electrode materials. For the graphite anode (Figure 10 original), the (002) diffraction peak position remained stable across all temperatures, confirming that the layered structure was not destroyed. However, the full width at half maximum (FWHM) of the peak increased with cycling temperature, as calculated in Table 4. Using the Scherrer equation, $D = \frac{K\lambda}{\beta \cos\theta}$, where $D$ is the crystallite size, $K$ is the shape factor (~0.9), $\lambda$ is the X-ray wavelength, and $\beta$ is the FWHM in radians, we observed a clear decrease in crystallite size. This suggests grain refinement or increased micro-strain, consistent with the progressive cracking observed in SEM.
| Cycling Condition (Temperature – Final SOH) | Graphite (002) Peak 2θ (°) | FWHM (002) (°) | Estimated Crystallite Size, D (nm) |
|---|---|---|---|
| Fresh Electrode | 26.45 | 0.180 | ~490 |
| 25 °C – 95% SOH | 26.444 | 0.230 | ~392 |
| 45 °C – 90% SOH | 26.444 | 0.234 | ~385 |
| 60 °C – 90% SOH | 26.443 | 0.237 | ~380 |
| 70 °C – 90% SOH | 26.442 | 0.240 | ~374 |
| 80 °C – 90% SOH | 26.440 | 0.243 | ~370 |
For the LiFePO4 cathode in the fully discharged state (Figure 11 original), XRD patterns showed no phase change, but Rietveld refinement was used to quantify the relative amounts of LiFePO4 and FePO4 phases. A fully discharged, healthy cathode should be predominantly in the FePO4 state. Our analysis, summarized in Table 5, revealed an increasing residual LiFePO4 fraction with cycling temperature for cells at the same SOH endpoint. This indicates a growing inventory of “trapped” lithium that cannot be extracted during discharge, directly evidencing LLI. The jump in residual LiFePO4 between 60 and 70 °C further corroborates the mechanism shift.
| Cycling Condition (Temperature – Final SOH) | LiFePO4 Phase Fraction in Discharged Cathode (%) | FePO4 Phase Fraction in Discharged Cathode (%) | Implied Active Lithium Inventory Loss |
|---|---|---|---|
| 25 °C – 95% SOH | ~12.7 | ~87.3 | Moderate |
| 45 °C – 90% SOH | ~15.0 | ~85.0 | Increased |
| 60 °C – 90% SOH | ~16.6 | ~83.4 | Significant |
| 70 °C – 90% SOH | ~18.9 | ~81.1 | Severe |
| 80 °C – 90% SOH | ~20.5 | ~79.5 | Very Severe |
The collective findings paint a coherent picture of temperature-dependent degradation in this lithium iron phosphate energy storage cell. At moderate temperatures (≤60 °C), the primary aging mechanism is the gradual, continuous growth and restructuring of the SEI on the graphite anode, consuming active lithium. The activation energy for this process is around 0.58 eV. While some particle cracking and minor transition metal dissolution occur, they are not the dominant factors. This regime is suitable for Arrhenius-based extrapolation for accelerated life testing. However, when the cycling temperature exceeds approximately 60 °C, a cascade of aggravated degradation processes is triggered, leading to a mechanistic shift. The key exacerbating factors include: (1) Exponential acceleration of SEI-related reactions: The Arrhenius factor $e^{-E_a/RT}$ causes a rapid increase in the rate of electrolyte reduction and SEI formation/repair. (2) Mechanical degradation of active materials: Enhanced kinetics lead to greater volumetric changes per cycle, and higher temperature may reduce material toughness, promoting extensive cracking in both graphite and LiFePO4 particles. This cracking creates new surfaces, fueling further side reactions (LLI) and causing active material isolation (LAM). (3) Thermally-driven electrolyte and salt decomposition: LiPF6 stability decreases markedly above 60-70 °C, generating acidic by-products like PF5 and HF. (4) Acid-catalyzed transition metal dissolution: The increased acidity attacks the LiFePO4 cathode, dissolving Fe2+ ions. These ions migrate and deposit on the anode, where they act as catalysts for further electrolyte decomposition, creating a positive feedback loop that drastically accelerates capacity fade. The synergy of these processes results in a breakdown of the simple Arrhenius relationship, as observed in the $\ln(Q_0)$ vs. $-1/T$ plot.
This understanding has critical implications for the development and qualification of lithium iron phosphate energy storage cells. Firstly, for the purpose of accelerated lifecycle testing to predict room-temperature performance, the acceleration temperature should be kept below the identified mechanism shift point (around 60°C for this cell chemistry and design). Using temperatures at or above 70°C for acceleration will likely yield non-conservative and inaccurate life predictions because the degradation pathways differ. Secondly, the findings highlight specific weaknesses that can be targeted for material and cell design improvements. For instance, enhancing the thermal stability of the electrolyte (e.g., using more stable lithium salts or additives), improving the mechanical resilience of electrode particles (via morphological control or binders), and employing effective cathode coating or doping to suppress transition metal dissolution could significantly extend the high-temperature cycle life of these energy storage cells. Furthermore, this work underscores the importance of using multi-modal diagnostic techniques—combining electrochemistry with advanced material characterization—to fully understand complex degradation phenomena in operating energy storage cells.
In conclusion, this comprehensive study elucidates the evolution of capacity fading mechanisms in graphite||LiFePO4 energy storage cells as a function of cycling temperature. We have quantitatively demonstrated that while temperature accelerates degradation, a fundamental shift in the dominant failure modes occurs when the temperature exceeds approximately 60°C. Below this threshold, capacity fade is primarily governed by SEI growth on the graphite anode with a consistent activation energy. Above this threshold, a synergistic combination of severe SEI overgrowth, active material particle fracture, and catalytic cycle involving electrolyte decomposition and iron dissolution leads to dramatically accelerated decay. This mechanistic shift invalidates simple Arrhenius extrapolation from very high temperatures. Therefore, for reliable accelerated life testing of lithium iron phosphate-based energy storage cells, it is recommended to use moderate acceleration temperatures (e.g., 45-55°C) that remain within the same degradation regime as the intended operating temperature. The insights gained from this work provide a valuable framework for designing more durable cells and developing accurate predictive models for the long-term performance of lithium-ion energy storage systems.