
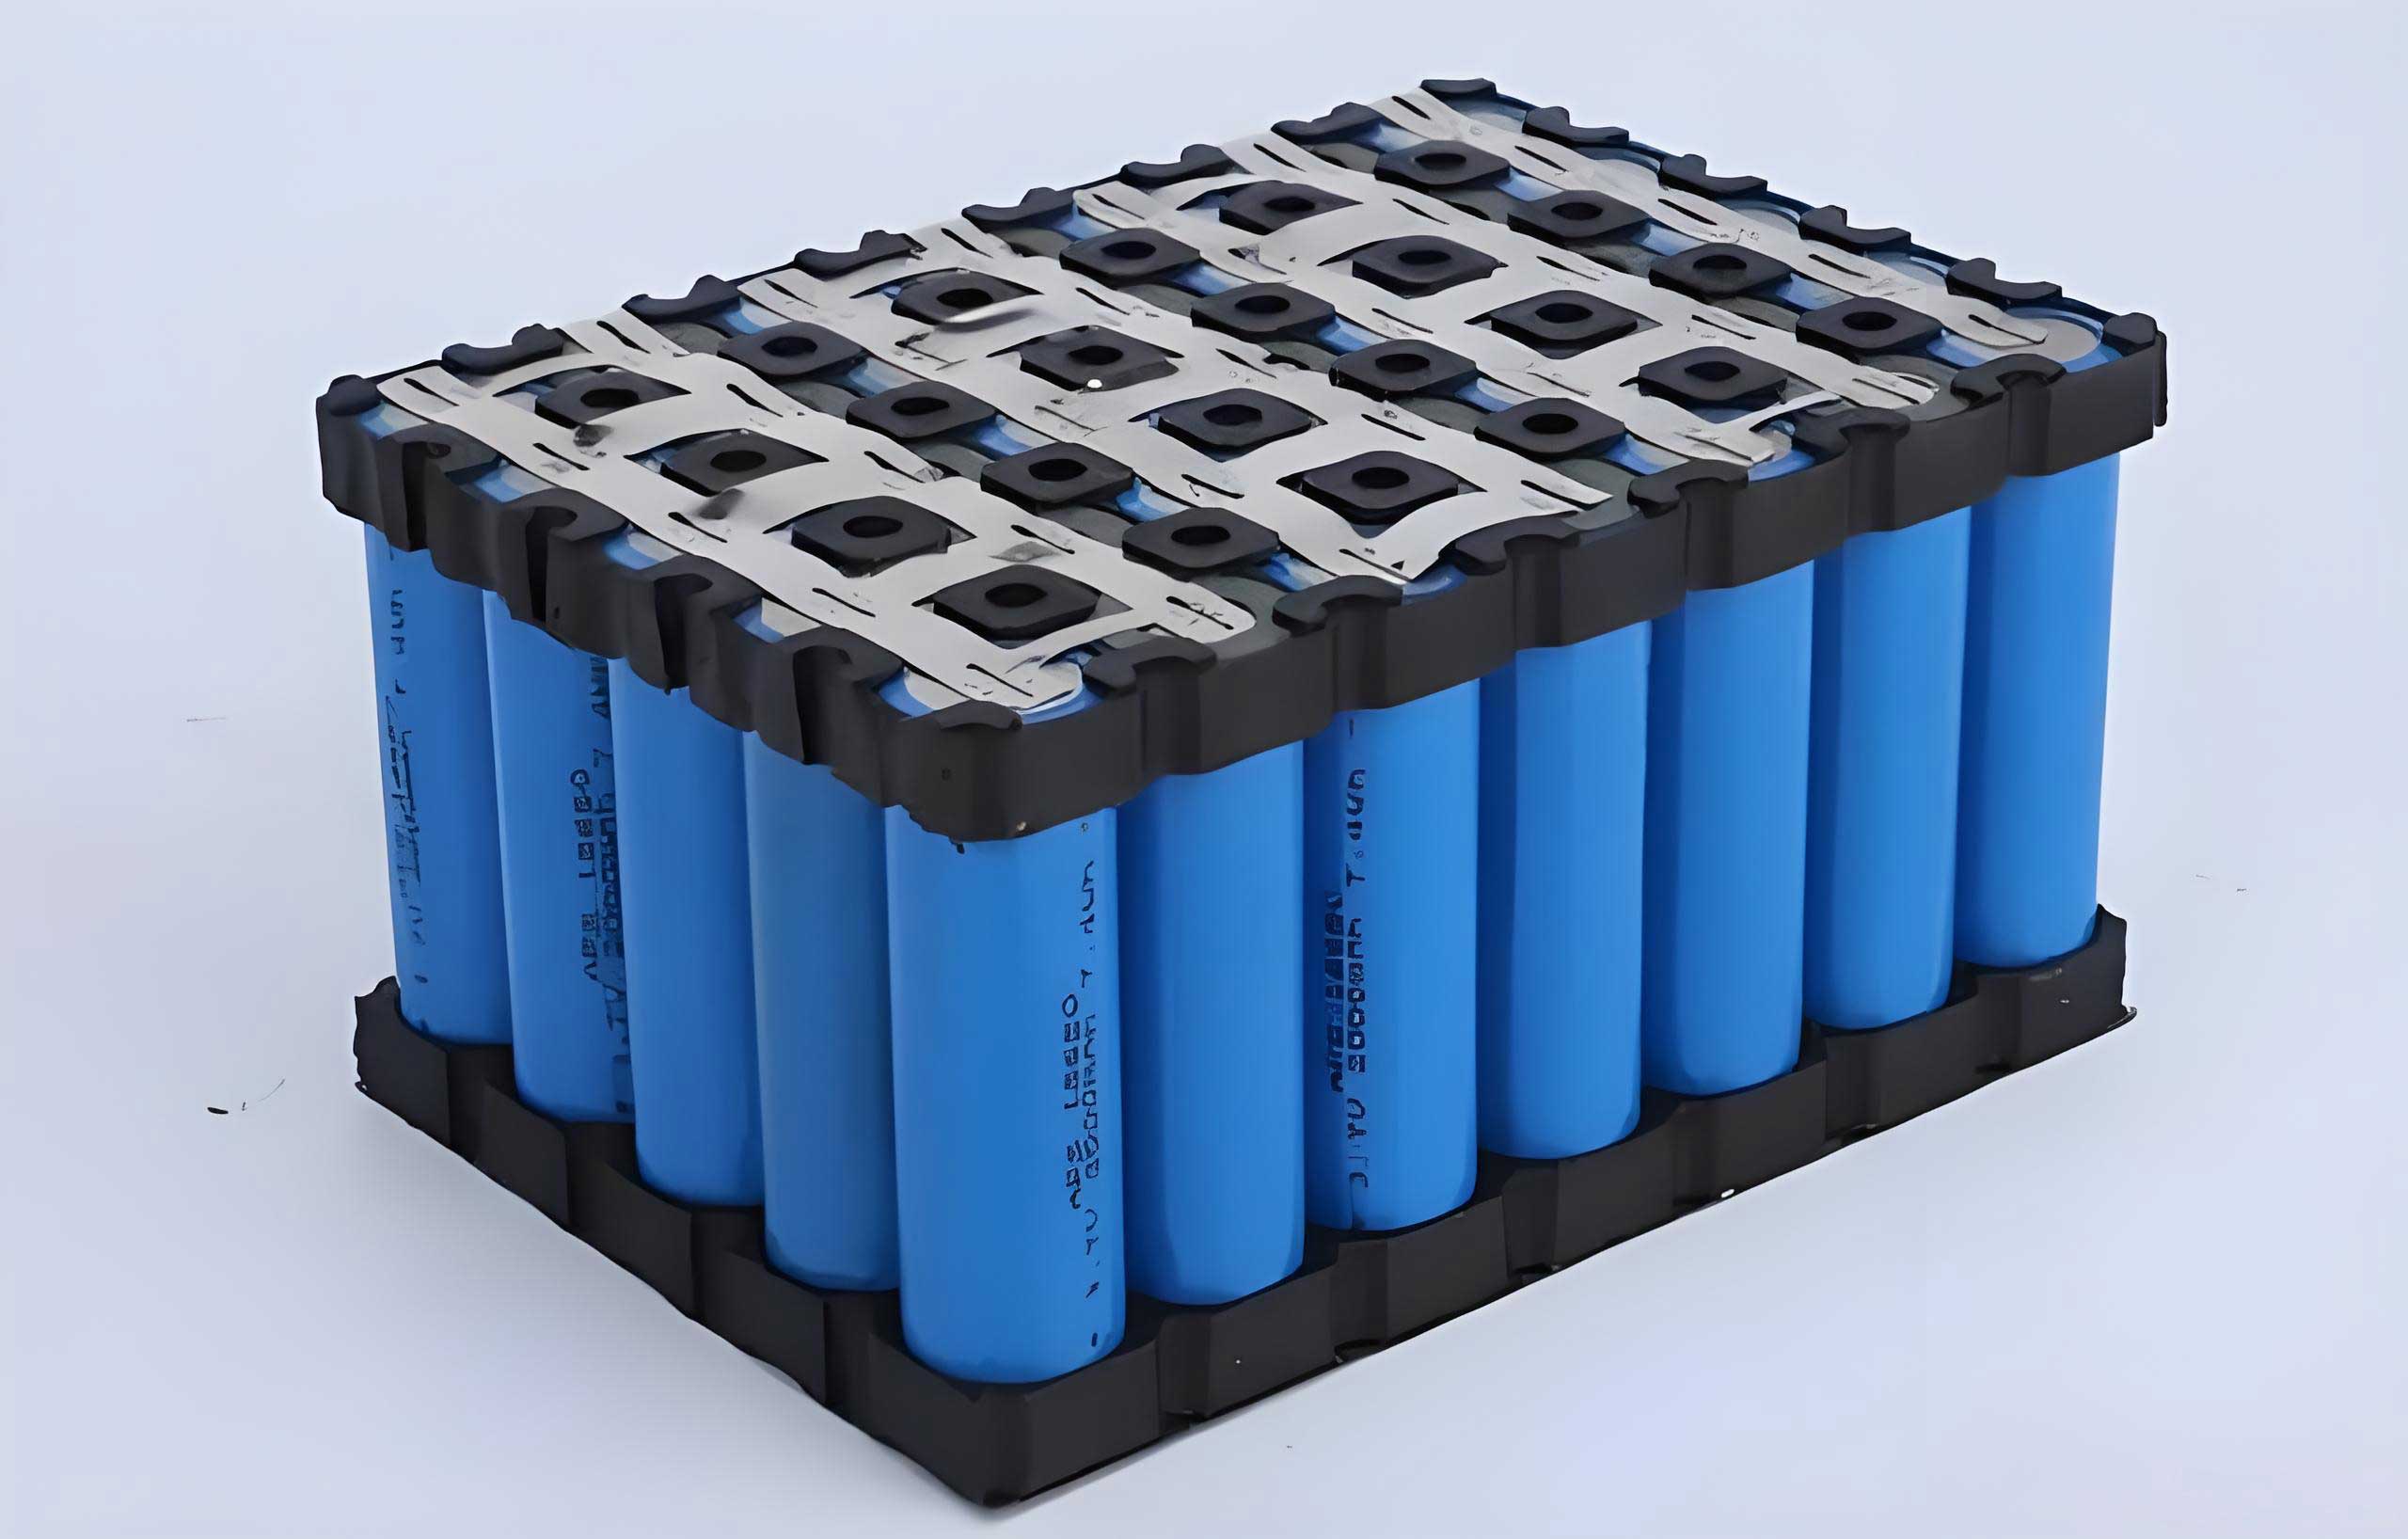
Accurate estimation of the State of Charge (SOC) is a fundamental requirement for the safe and efficient operation of battery management systems (BMS). Among various battery chemistries, lithium iron phosphate (LiFePO4, LFP) batteries have gained widespread adoption in electric vehicles, energy storage systems, and other applications due to their superior safety profile, long cycle life, and good thermal stability. However, a significant challenge in managing LiFePO4 batteries stems from the characteristic flat plateau in their open-circuit voltage (OCV) versus SOC curve, particularly within the 20% to 80% SOC range. This flatness leads to low sensitivity of electrical signals (voltage) to SOC changes, complicating precise SOC estimation using conventional voltage-based methods and introducing pronounced hysteresis effects.
Traditional SOC estimation methods can be broadly categorized into four groups: look-up table methods based on characterization parameters, coulomb counting (Ampere-hour integration), model-based methods (e.g., equivalent circuit models combined with Kalman filters), and data-driven approaches. While model-based and data-driven methods offer promising accuracy, they often rely heavily on monitoring electrical parameters like current and terminal voltage. An alternative, promising avenue of research involves probing the changes in the internal physical state of a battery, as the electrochemical processes during charging and discharging inevitably alter material properties such as density, Young’s modulus, and internal stress within the electrodes. These physical changes affect the propagation characteristics of acoustic waves traveling through the battery structure. Consequently, ultrasonic testing, a non-destructive evaluation technique, has emerged as a powerful tool for internal state interrogation. By analyzing the changes in transmitted or reflected ultrasonic signals, it is possible to infer the SOC of a LiFePO4 battery, offering a complementary or alternative sensing modality that is less affected by the flat OCV plateau.
This article presents a novel, high-accuracy method for estimating the SOC of LiFePO4 batteries. The core of our approach lies in the fusion of highly correlated ultrasonic time-frequency domain features with an advanced deep learning model optimized by the Apollo algorithm. We begin by detailing the experimental setup for acquiring ultrasonic data from LiFePO4 batteries under various constant-current (CC) charging and discharging rates. We then systematically extract a comprehensive set of features from the ultrasonic waveforms. Through rigorous correlation analysis, we identify and select the subset of features most strongly linked to the battery’s SOC. Subsequently, we construct a bidirectional gated recurrent unit (BiGRU) neural network, a type of recurrent neural network adept at capturing temporal dependencies in sequential data like our ultrasonic feature time series. To enhance the model’s convergence and final performance, we employ the Apollo stochastic optimization algorithm. Finally, we rigorously validate the proposed Apollo-BiGRU model’s estimation accuracy and robustness across multiple current rates and under dynamic driving cycle profiles, demonstrating its superior performance compared to other established machine learning and deep learning models.
Principles of Ultrasonic SOC Detection in LiFePO4 Batteries
Ultrasonic waves are mechanical vibrations at frequencies above the human audible range (typically >20 kHz). Their utility in non-destructive testing stems from their ability to propagate through materials, with their velocity, attenuation, and reflection characteristics being sensitive to the material’s elastic properties and density. For a longitudinal wave traveling through a medium, the acoustic impedance \(Z\) is a key property defined as:
$$Z = \rho v$$
where \(\rho\) is the material density and \(v\) is the speed of sound within the medium. The sound speed itself is related to the material’s elastic modulus and density:
$$v = \sqrt{\frac{E}{\rho}}$$
where \(E\) is the Young’s modulus. A commercial LiFePO4 battery is a multi-layer structure comprising a positive electrode (LiFePO4), a negative electrode (typically graphite), a separator, electrolyte, and current collectors. During the charging and discharging of a LiFePO4 battery, lithium ions (\(Li^+\)) shuttle between the positive and negative electrodes. This intercalation and de-intercalation process causes volumetric changes and modifications in the mechanical properties (e.g., \(E\) and \(\rho\)) of the electrode materials. As these core material properties evolve with the lithium concentration (i.e., SOC), the effective acoustic impedance of the electrode layers changes. Consequently, when an ultrasonic wave is transmitted through the battery, its interaction with the internal layers—including transmission, reflection, and attenuation—is modulated by the SOC. These modulations manifest as measurable changes in the received ultrasonic signal’s characteristics, such as its time-of-flight (TOF), amplitude, and spectral composition. Therefore, by monitoring these ultrasonic signatures, one can establish a functional relationship to estimate the SOC of the LiFePO4 battery, providing a physically-grounded sensing approach that is decoupled from the problematic flat voltage plateau.
Experimental Platform for Ultrasonic Testing of LiFePO4 Batteries
To investigate the relationship between ultrasonic signals and the SOC of LiFePO4 batteries, a dedicated experimental platform was established. We utilized four pouch-type LiFePO4 batteries with high consistency and identical aging history. The key specifications of these LiFePO4 batteries were: a nominal voltage of 3.2V, a nominal capacity of 10 Ah, with charge and discharge cut-off voltages of 3.8V and 2.3V, respectively.
The experimental setup integrated electrical cycling and synchronized ultrasonic measurement. Each LiFePO4 battery was connected to a high-precision battery cycler (e.g., a CT6002A system) to perform controlled charge-discharge cycles under constant current (CC) conditions. Voltage, current, and surface temperature (monitored by a thermocouple) were recorded simultaneously. For ultrasonic interrogation, a through-transmission mode was adopted. Two identical 4 MHz longitudinal wave piezoelectric transducers (e.g., 4P20 type) were placed on opposite sides of the battery’s central region. A high-vacuum couplant was used to ensure efficient acoustic energy transfer. One transducer, connected to an ultrasonic pulser-receiver (e.g., CTS-8077PR), acted as the transmitter, generating pulsed waves. The other transducer acted as the receiver, capturing the signal that propagated through the LiFePO4 battery. The received signal was digitized and displayed by a high-speed digital oscilloscope (e.g., Tektronix MSO44) and subsequently saved to a computer for offline analysis. A custom fixture held the transducers in place with consistent pressure to ensure measurement repeatability. The entire assembly was placed inside a thermal chamber maintained at a constant temperature of 25°C to isolate environmental temperature effects.
To evaluate the method’s robustness under different operational conditions, each of the four LiFePO4 batteries was subjected to CC charge-discharge cycles at a distinct C-rate: 0.4C, 0.6C, 0.8C, and 1.0C. Ultrasonic A-scans were captured at regular intervals (e.g., every minute) throughout each cycle. Prior to feature extraction, the raw ultrasonic signals were preprocessed using a wavelet denoising technique to enhance the signal-to-noise ratio.
Ultrasonic Feature Extraction and High-Correlation Feature Selection
Feature Extraction from Time and Frequency Domains
To comprehensively characterize the ultrasonic signals, a total of 21 distinct features were extracted from both the time and frequency domains of the denoised A-scan waveforms. From the time-domain perspective, we extracted 10 features. These included 6 waveform-based features: Maximum Amplitude, Time of Maximum Amplitude, Minimum Amplitude, Time of Minimum Amplitude, Rise Time (time from 25% of max amplitude to peak), and Fall Time (time from peak to 25% of max amplitude). Additionally, 4 statistical time-domain features were calculated: Average Absolute Value, Variance, Root Mean Square (RMS), and Temporal Centroid.
Transforming the signal to the frequency domain via the Fast Fourier Transform (FFT) reveals information not readily apparent in the time domain. From the signal’s amplitude spectrum, we extracted 11 statistical frequency-domain features. These included shape descriptors like Spectral Peak Factor, Spectral Impulse Factor, Spectral Margin Factor, and Spectral Waveform Factor. We also calculated features describing the spectrum’s distribution: Spectral Flatness, Spectral Centroid, Spectral Spread, Spectral Skewness, Spectral Kurtosis, and Spectral Variance. Finally, Spectral Entropy, which quantifies the spectral complexity or randomness, was computed.
Selection of Highly SOC-Correlated Features
Not all extracted features are equally informative for SOC estimation. To identify the most relevant features for our LiFePO4 battery SOC model, we performed a correlation analysis. Using the dataset from the 0.8C rate test, we calculated the Spearman’s rank correlation coefficient between each of the 21 ultrasonic features and the corresponding battery SOC. The absolute values of these coefficients were ranked. A subset of 6 features exhibited an exceptionally high correlation (absolute Spearman coefficient > 0.9) with SOC, indicating their strong potential as model inputs. The top features and their correlation strengths are summarized in the table below.
| Rank | Ultrasonic Feature | Absolute Spearman Coefficient |
|---|---|---|
| 1 | Time of Maximum Amplitude | 0.968 |
| 2 | Rise Time | 0.952 |
| 3 | Time of Minimum Amplitude | 0.927 |
| 4 | Maximum Amplitude | 0.902 |
| 5 | Spectral Entropy | 0.901 |
| 6 | Spectral Flatness | 0.900 |
The evolution of these six high-correlation features over two consecutive charge-discharge cycles clearly shows consistent, monotonic relationships with SOC. Features like Time of Maximum Amplitude, Rise Time, and Spectral Entropy increase with SOC, while Spectral Flatness decreases. The near-perfect overlap of the curves from consecutive cycles underscores the repeatability and stability of these ultrasonic signatures for the LiFePO4 battery, confirming their suitability for reliable SOC estimation.
Model Architecture: Apollo-Optimized Bidirectional GRU Network
Bidirectional Gated Recurrent Unit (BiGRU)
Sequential data, such as our time-series of ultrasonic features, contains temporal dependencies where past and future context can inform the present state. Standard Gated Recurrent Units (GRUs) process sequences in one direction (forward), which limits their ability to utilize information from “future” time steps in the sequence. For SOC estimation, the battery’s state is a continuous function of its history and immediate future trajectory. To capture this bidirectional context, we employ a Bidirectional GRU (BiGRU) network. A BiGRU consists of two independent GRU layers: one processes the sequence from start to end (forward pass), and the other processes it from end to start (backward pass). The hidden state outputs from both directions at each time step are typically concatenated or summed to form the final output. This allows the network to learn patterns based on both preceding and succeeding ultrasonic feature states, leading to a richer representation for SOC prediction. The combined hidden state \(h_t\) at time \(t\) can be represented as:
$$h_t = w_{t1} \overrightarrow{h_t} + w_{t2} \overleftarrow{h_t} + b_t$$
where \(\overrightarrow{h_t}\) and \(\overleftarrow{h_t}\) are the hidden states from the forward and backward GRUs, respectively, \(w_{t1}\) and \(w_{t2}\) are learnable weights, and \(b_t\) is a bias term.
Apollo Optimization Algorithm
The choice of optimization algorithm is critical for training deep neural networks effectively. We utilize the Apollo optimizer, a stochastic quasi-Newton method designed for non-convex optimization problems. Unlike first-order methods like Stochastic Gradient Descent (SGD) which use a fixed or simply adapted learning rate per parameter, or adaptive methods like Adam which use running averages of gradients, Apollo incorporates second-order curvature information. It maintains a diagonal approximation of the Hessian matrix, which is updated efficiently. This allows Apollo to automatically adjust the learning rate for each parameter based on the local geometry of the loss landscape. It addresses issues of ill-conditioning often encountered in SGD and can avoid shallow local minima more effectively than Adam in certain scenarios, often leading to faster convergence and superior final accuracy. Its computational cost remains linear in the number of parameters, making it suitable for deep networks like our BiGRU model designed for the LiFePO4 battery SOC task.
Integrated Apollo-BiGRU Model for LiFePO4 Battery SOC Estimation
Our proposed SOC estimation framework integrates the selected high-correlation ultrasonic features with the Apollo-BiGRU model. The pipeline is as follows: The six selected time-frequency ultrasonic features (Time of Max Amplitude, Rise Time, Time of Min Amplitude, Max Amplitude, Spectral Entropy, Spectral Flatness) are first normalized and formatted as a multivariate time series. This sequential data serves as the input to the BiGRU network. The BiGRU layers learn the complex temporal dynamics mapping the ultrasonic feature evolution to the battery’s SOC. The output from the BiGRU layers is fed into a fully connected (dense) layer with a rectified linear unit (ReLU) activation function, which finally produces the estimated SOC value. To prevent overfitting, dropout regularization is applied within the network. The entire model is trained end-to-end using the Apollo optimizer to minimize the mean squared error (MSE) between the estimated SOC and the true SOC (calculated via coulomb counting with calibration). The performance of the trained model is evaluated using two standard error metrics: Mean Absolute Error (MAE) and Root Mean Square Error (RMSE), defined as:
$$MAE = \frac{1}{n}\sum_{i=1}^{n} |Y_{true}^{(i)} – Y_{est}^{(i)}|$$
$$RMSE = \sqrt{\frac{1}{n}\sum_{i=1}^{n} (Y_{true}^{(i)} – Y_{est}^{(i)})^2}$$
where \(n\) is the number of test samples, \(Y_{true}\) is the reference SOC, and \(Y_{est}\) is the estimated SOC from our Apollo-BiGRU model for the LiFePO4 battery.
Results and Discussion
Model Comparison and Optimization Algorithm Selection
We first validated the effectiveness of our model architecture and optimization choice using data from the LiFePO4 battery tested at 0.8C. Data from two consecutive cycles were used for training, and a separate third cycle was held out for testing. We compared our Apollo-BiGRU model against several state-of-the-art and classic data-driven models, including Convolutional Neural Networks (CNN), unidirectional GRU, Random Forest (RF), and Support Vector Machine (SVM). For a fair comparison among deep learning models, Adam optimizer was initially used for all. The results, including SOC estimation curves and error metrics, clearly demonstrated the superiority of the BiGRU architecture in modeling the temporal sequence of ultrasonic features from the LiFePO4 battery.
To further refine the BiGRU model, we then compared three different optimizers: Adam, SGD, and Apollo, while keeping the BiGRU architecture constant. The following table summarizes the key performance comparison.
| Estimation Model | MAE (%) | RMSE (%) |
|---|---|---|
| Adam-CNN | 2.93 | 3.73 |
| Adam-GRU | 2.25 | 2.59 |
| Adam-BiGRU | 1.90 | 2.38 |
| Random Forest (RF) | 2.55 | 3.26 |
| Support Vector Machine (SVM) | 5.53 | 6.32 |
| SGD-BiGRU | 3.31 | 4.35 |
| Apollo-BiGRU (Proposed) | 1.09 | 1.31 |
The results show that the BiGRU architecture outperforms other models when using the same Adam optimizer. More importantly, when the Apollo optimizer is applied to the BiGRU network, the performance improves significantly, achieving the lowest errors with an MAE of 1.09% and an RMSE of 1.31% for the LiFePO4 battery at 0.8C. The Apollo optimizer’s ability to leverage curvature information facilitates more effective navigation of the loss landscape, leading to a more accurate and stable convergence point for the LiFePO4 battery SOC estimation model.
Performance Validation Under Different Current Rates
A critical test for any SOC estimation method is its robustness under varying operational conditions. To evaluate this, we trained a single Apollo-BiGRU model using data from the LiFePO4 battery cycled at 0.8C. We then tested this pre-trained model directly on the ultrasonic feature data from the other three LiFePO4 batteries cycled at 0.4C, 0.6C, and 1.0C, without any retraining or fine-tuning. This tests the model’s ability to generalize across different C-rates, which affect the kinetics and potentially the internal state dynamics of the LiFePO4 battery. The estimation errors across all rates are presented below.
| C-rate | MAE (%) | RMSE (%) |
|---|---|---|
| 0.4C | 1.26 | 1.46 |
| 0.6C | 1.13 | 1.39 |
| 0.8C | 1.09 | 1.31 |
| 1.0C | 1.15 | 1.40 |
The proposed method maintains high accuracy across all tested current rates, with MAE consistently below 1.26% and RMSE below 1.46%. This demonstrates the strong generalization capability and reliability of the ultrasonic-feature-based Apollo-BiGRU model. The physical nature of the ultrasonic signals makes them inherently less sensitive to the rate of current flow compared to terminal voltage, contributing to this robust performance across different C-rates for the LiFePO4 battery.
Validation Under Dynamic Stress Profiles
Real-world battery operation rarely involves constant current. To assess practical viability, we tested our method under standardized dynamic driving cycles: the Dynamic Stress Test (DST) and the New European Driving Cycle (NEDC). These profiles involve rapidly varying current loads, closely mimicking real electric vehicle operation. We compared the performance of our Apollo-BiGRU model against other SOC estimation models commonly cited in literature that use ultrasonic or other data. The results are summarized in the following table.
| Operating Condition | Estimation Model | MAE (%) | RMSE (%) |
|---|---|---|---|
| DST | SVM | 6.03 | 6.61 |
| Random Forest | 2.62 | 5.16 | |
| BP Neural Network | 2.10 | 3.33 | |
| Apollo-BiGRU (Proposed) | 1.42 | 1.79 | |
| NEDC | SVM | 6.73 | 7.95 |
| Random Forest | 5.80 | 7.71 | |
| BP Neural Network | 3.23 | 4.47 | |
| Apollo-BiGRU (Proposed) | 1.85 | 2.28 |
The proposed Apollo-BiGRU model significantly outperforms all other models in both dynamic profiles. For the LiFePO4 battery under test, it achieved an MAE/RMSE of 1.42%/1.79% for DST and 1.85%/2.28% for NEDC. This superior performance under complex, realistic loading conditions underscores the practical effectiveness and accuracy of our ultrasonic-based deep learning approach for estimating the SOC of LiFePO4 batteries.
Conclusion
This article presented a novel, high-fidelity method for estimating the State of Charge (SOC) of lithium iron phosphate (LiFePO4) batteries, a task complicated by their characteristic flat voltage plateau. The method synergistically combines the physical insights from ultrasonic testing with the powerful pattern recognition capabilities of deep learning. We systematically extracted a wide array of time and frequency domain features from ultrasonic signals transmitted through a LiFePO4 battery during operation. Through correlation analysis, we identified six highly SOC-correlated features, establishing a robust physical basis for the estimation model. We then developed a Bidirectional Gated Recurrent Unit (BiGRU) neural network, specifically designed to capture the temporal dependencies in the sequential ultrasonic data. The network was optimized using the advanced Apollo stochastic quasi-Newton algorithm, which enhanced convergence and final estimation accuracy.
Experimental validation on LiFePO4 batteries under various constant-current rates (0.4C to 1.0C) demonstrated the method’s exceptional accuracy and strong generalization capability, with SOC estimation errors (RMSE) consistently below 1.5%. Furthermore, rigorous testing under demanding dynamic stress profiles (DST and NEDC) confirmed the model’s practicality and superior performance compared to other state-of-the-art machine learning models, achieving RMSE values below 2.3%. The proposed Apollo-BiGRU model, fueled by high-correlation ultrasonic features, provides a reliable, accurate, and model-free solution for SOC estimation in LiFePO4 batteries. This approach effectively circumvents the challenges posed by the flat OCV-SOC curve, offering significant potential for enhancing the performance and safety of battery management systems in real-world applications for LiFePO4 battery packs.