
In the context of China’s new energy strategy, photovoltaic power generation has developed extensively. Super-large photovoltaic projects can feature solar panel arrays spanning dozens of rows and columns. In our study, we employed a combination of wind tunnel tests and CFD numerical simulations to investigate the shape coefficients and the shielding effect on solar panels within super-large arrays. Understanding the wind loads on these solar panels is crucial for ensuring structural safety and optimizing material costs. Conventional standards often do not account for the significant shielding effects present in dense arrays, leading to overly conservative designs. Our research aims to provide more accurate design recommendations.
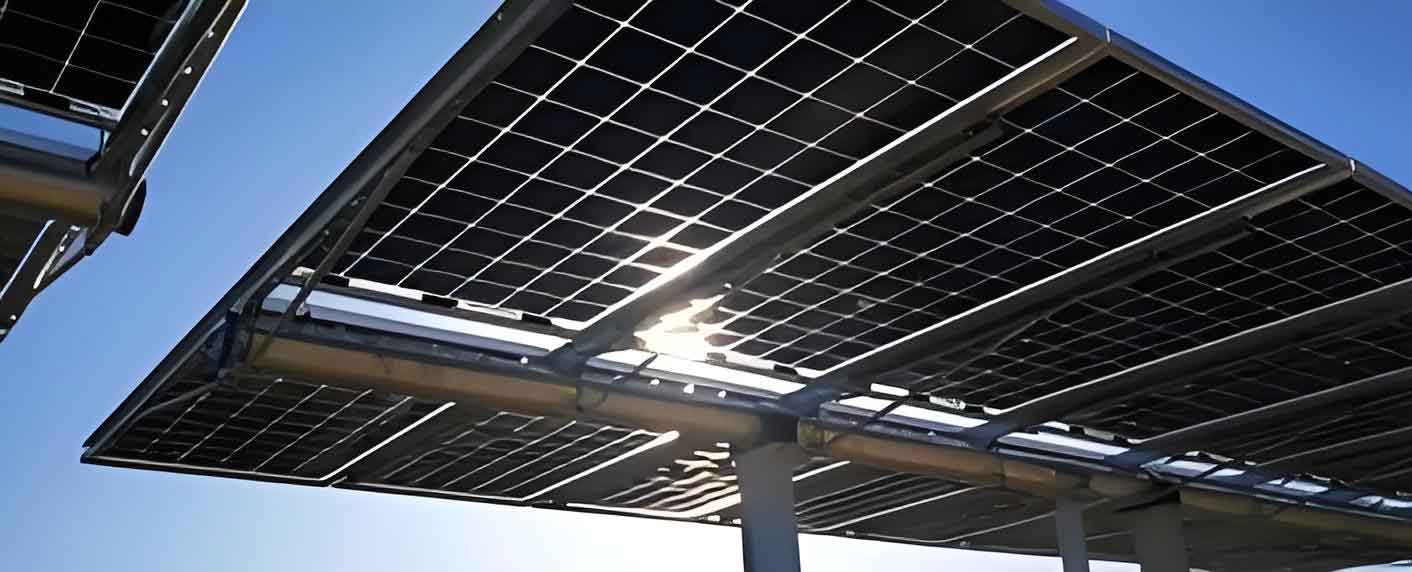
To accurately simulate the two-dimensional flow characteristics typical of the central region of a super-large array, we designed our wind tunnel experiment with models fully occupying the tunnel’s width. This setup effectively replicates the wind flow patterns around a long row of solar panels. Using a large-scale rigid model and synchronous pressure measurement on both the upper and lower surfaces, we determined the wind pressure coefficient distribution, shape coefficients, and the shielding effect for a tandem array of five solar panels with a tilt angle of 12°. Concurrently, we employed CFD simulations using the realizable k-ε turbulence model, which we validated by comparing its results against our experimental data.
Our experiments defined the solar panel shape coefficient (μ) using the area-weighted average of the net pressure coefficients, calculated as follows:
$$ \mu = \frac{\sum_{i=1}^{N} \mu_i A_i}{A} $$
where μi is the net wind pressure coefficient at tap point i, Ai is the tributary area for that tap, and A is the total area of the solar panel. The shielding effect was quantified using a reduction factor (ηk) for the k-th solar panel (with panel 1 being the most upstream), defined as:
$$ \eta_k = \frac{\mu_{sk}}{\mu_{s1}} $$
The results from the wind tunnel test for the five-panel array at a 12° tilt angle are summarized in the table below. It clearly shows a significant reduction in shape coefficients for downstream panels, especially for the 0° wind direction (windward side facing the panel back).
Table 1: Average Shape Coefficient and Reduction Factor from Wind Tunnel Test (θ = 12°)
| Wind Direction | Isolated Panel | Panel 1 (μ / η) | Panel 2 (μ / η) | Panel 3 (μ / η) | Panel 4 (μ / η) |
|---|---|---|---|---|---|
| 0° | 0.51 | 0.83 / 1.00 | 0.39 / 0.47 | 0.28 / 0.34 | 0.19 / 0.24 |
| 180° | -0.58 | -0.83 / 1.00 | -0.59 / 0.71 | -0.53 / 0.64 | -0.56 / 0.66 |
Our study found that for a tilt angle of 12°, the shielding effect was more pronounced under the 0° wind direction compared to the 180° wind direction. This indicates that the aerodynamic interaction is highly sensitive to the orientation of the solar panels relative to the wind. Furthermore, the isolated panel data highlights that a single, stand-alone solar panel experiences lower absolute wind loads than the lead panel in a two-dimensional array, emphasizing the importance of considering the array’s group effect.
Based on the validated CFD method, we extended our analysis to simulate larger arrays with 16, 24, and 32 tandem solar panels. The purpose was to understand how the shape coefficient evolves as the number of upstream panels increases, and to determine if a stable, fully-shielded zone exists. The CFD simulations confirmed the trends observed in the wind tunnel tests and provided deeper insights. The results for the various array sizes are generally consistent for the first few panels, confirming the reliability of our simulation model.
The table below presents the fitting parameters (A0, B0, C0) for the reduction factor equation used to model the behavior in the gradient zone (panels 2 through 12). The equation is:
$$ \eta_i = A_0 k^2 + B_0 k + C_0 $$
where k is the row number of the solar panel in the direction of the wind flow (k = 2, 3, 4, … 12).
Table 2: Parameters for Fitting Formula of Reduction Factor in the Gradient Zone
| Parameter | 0° Wind (Leeward) θ=12° | 0° Wind (Leeward) θ=20° | 180° Wind (Windward) θ=12° | 180° Wind (Windward) θ=20° |
|---|---|---|---|---|
| A0 | 0.00291 | 0.00267 | 0.00162 | 0.00055 |
| B0 | -0.0853 | -0.0725 | -0.0572 | -0.0197 |
| C0 | 0.7665 | 0.5991 | 0.8173 | 0.3764 |
Our CFD analysis also revealed significant differences in the shielding effect at different tilt angles. For the first panel, the shape coefficient was larger for the 20° tilt angle. However, for the subsequent solar panels (from panel 2 onwards), the shape coefficient at a 20° tilt was significantly smaller than that at a 12° tilt. This indicates that the shielding effect is stronger for steeper panel inclinations. This is an important design consideration, as it suggests that increasing the tilt angle not only increases the load on the front row but also enhances the protection provided to the inner rows.
One of the key findings from our CFD simulations is the determination of the point at which the shape coefficient stabilizes. The results consistently showed that for arrays with 12 or more solar panels in tandem, the shape coefficients for the downstream panels (13th and beyond) remain virtually unchanged. This defines the boundary between the ‘gradient zone’ and the ‘stable zone’. The proposed zoning and the corresponding recommended shape coefficients and reduction factors for a super-large solar panel array are summarized in the table below.
Table 3: Recommended Shape Coefficient Values for Super-Large Solar Panel Arrays
| Zone of Array | Rows of Solar Panels | 0° Wind Direction (Leeward) | 180° Wind Direction (Windward) | ||
|---|---|---|---|---|---|
| θ = 12° | θ = 20° | θ = 12° | θ = 20° | ||
| Edge Zone | Row 1 (Lead panel) | μ = 0.72 | μ = 0.78 | μ = -0.58 | μ = -0.62 |
| Gradient Zone | Rows 2 to 12 | Use reduction factor ηi = A0k2 + B0k + C0 | |||
| Stable Zone | Row 12 onwards | μ = 0.12 | μ = 0.09 | μ = -0.21 | μ = -0.14 |
In conclusion, our combined experimental and numerical study provides a comprehensive understanding of the shielding effect on shape coefficients for super-large solar panel arrays. We have demonstrated that the shielding effect is significant and varies with wind direction and panel tilt angle. The stabilization of the shape coefficient after the 12th row of solar panels allows for a simplified, zonal-based design approach. For structural design, the edge zone (first row) requires the strongest wind load resistance. The gradient zone (rows 2-12) can benefit from a progressively reduced reduction factor. The stable zone (all rows after the 12th) can be designed with a constant, minimized shape coefficient. These recommendations provide a pathway to more economical and structurally sound designs for large-scale photovoltaic power plants.