
The widespread adoption of electric vehicles (EVs) and electrochemical energy storage systems represents a pivotal technological pathway for nations striving to achieve carbon neutrality and peak carbon emissions. Central to this transition is the advancement of the li ion battery, which dominates these applications due to its high voltage, superior specific energy, long cycle life, and favorable balance between energy and power density. However, a fundamental challenge persists: every charge and discharge cycle contributes to the gradual degradation of a battery’s capacity. This fading is intrinsic to the electrochemical processes within the cell. Accurate estimation of the maximum available capacity is therefore not merely a diagnostic metric but a critical cornerstone for ensuring safe, reliable, and efficient management throughout the entire lifecycle of a li ion battery system. It informs strategies for battery pack rebalancing, predicts end-of-life, and safeguards against operational failures.
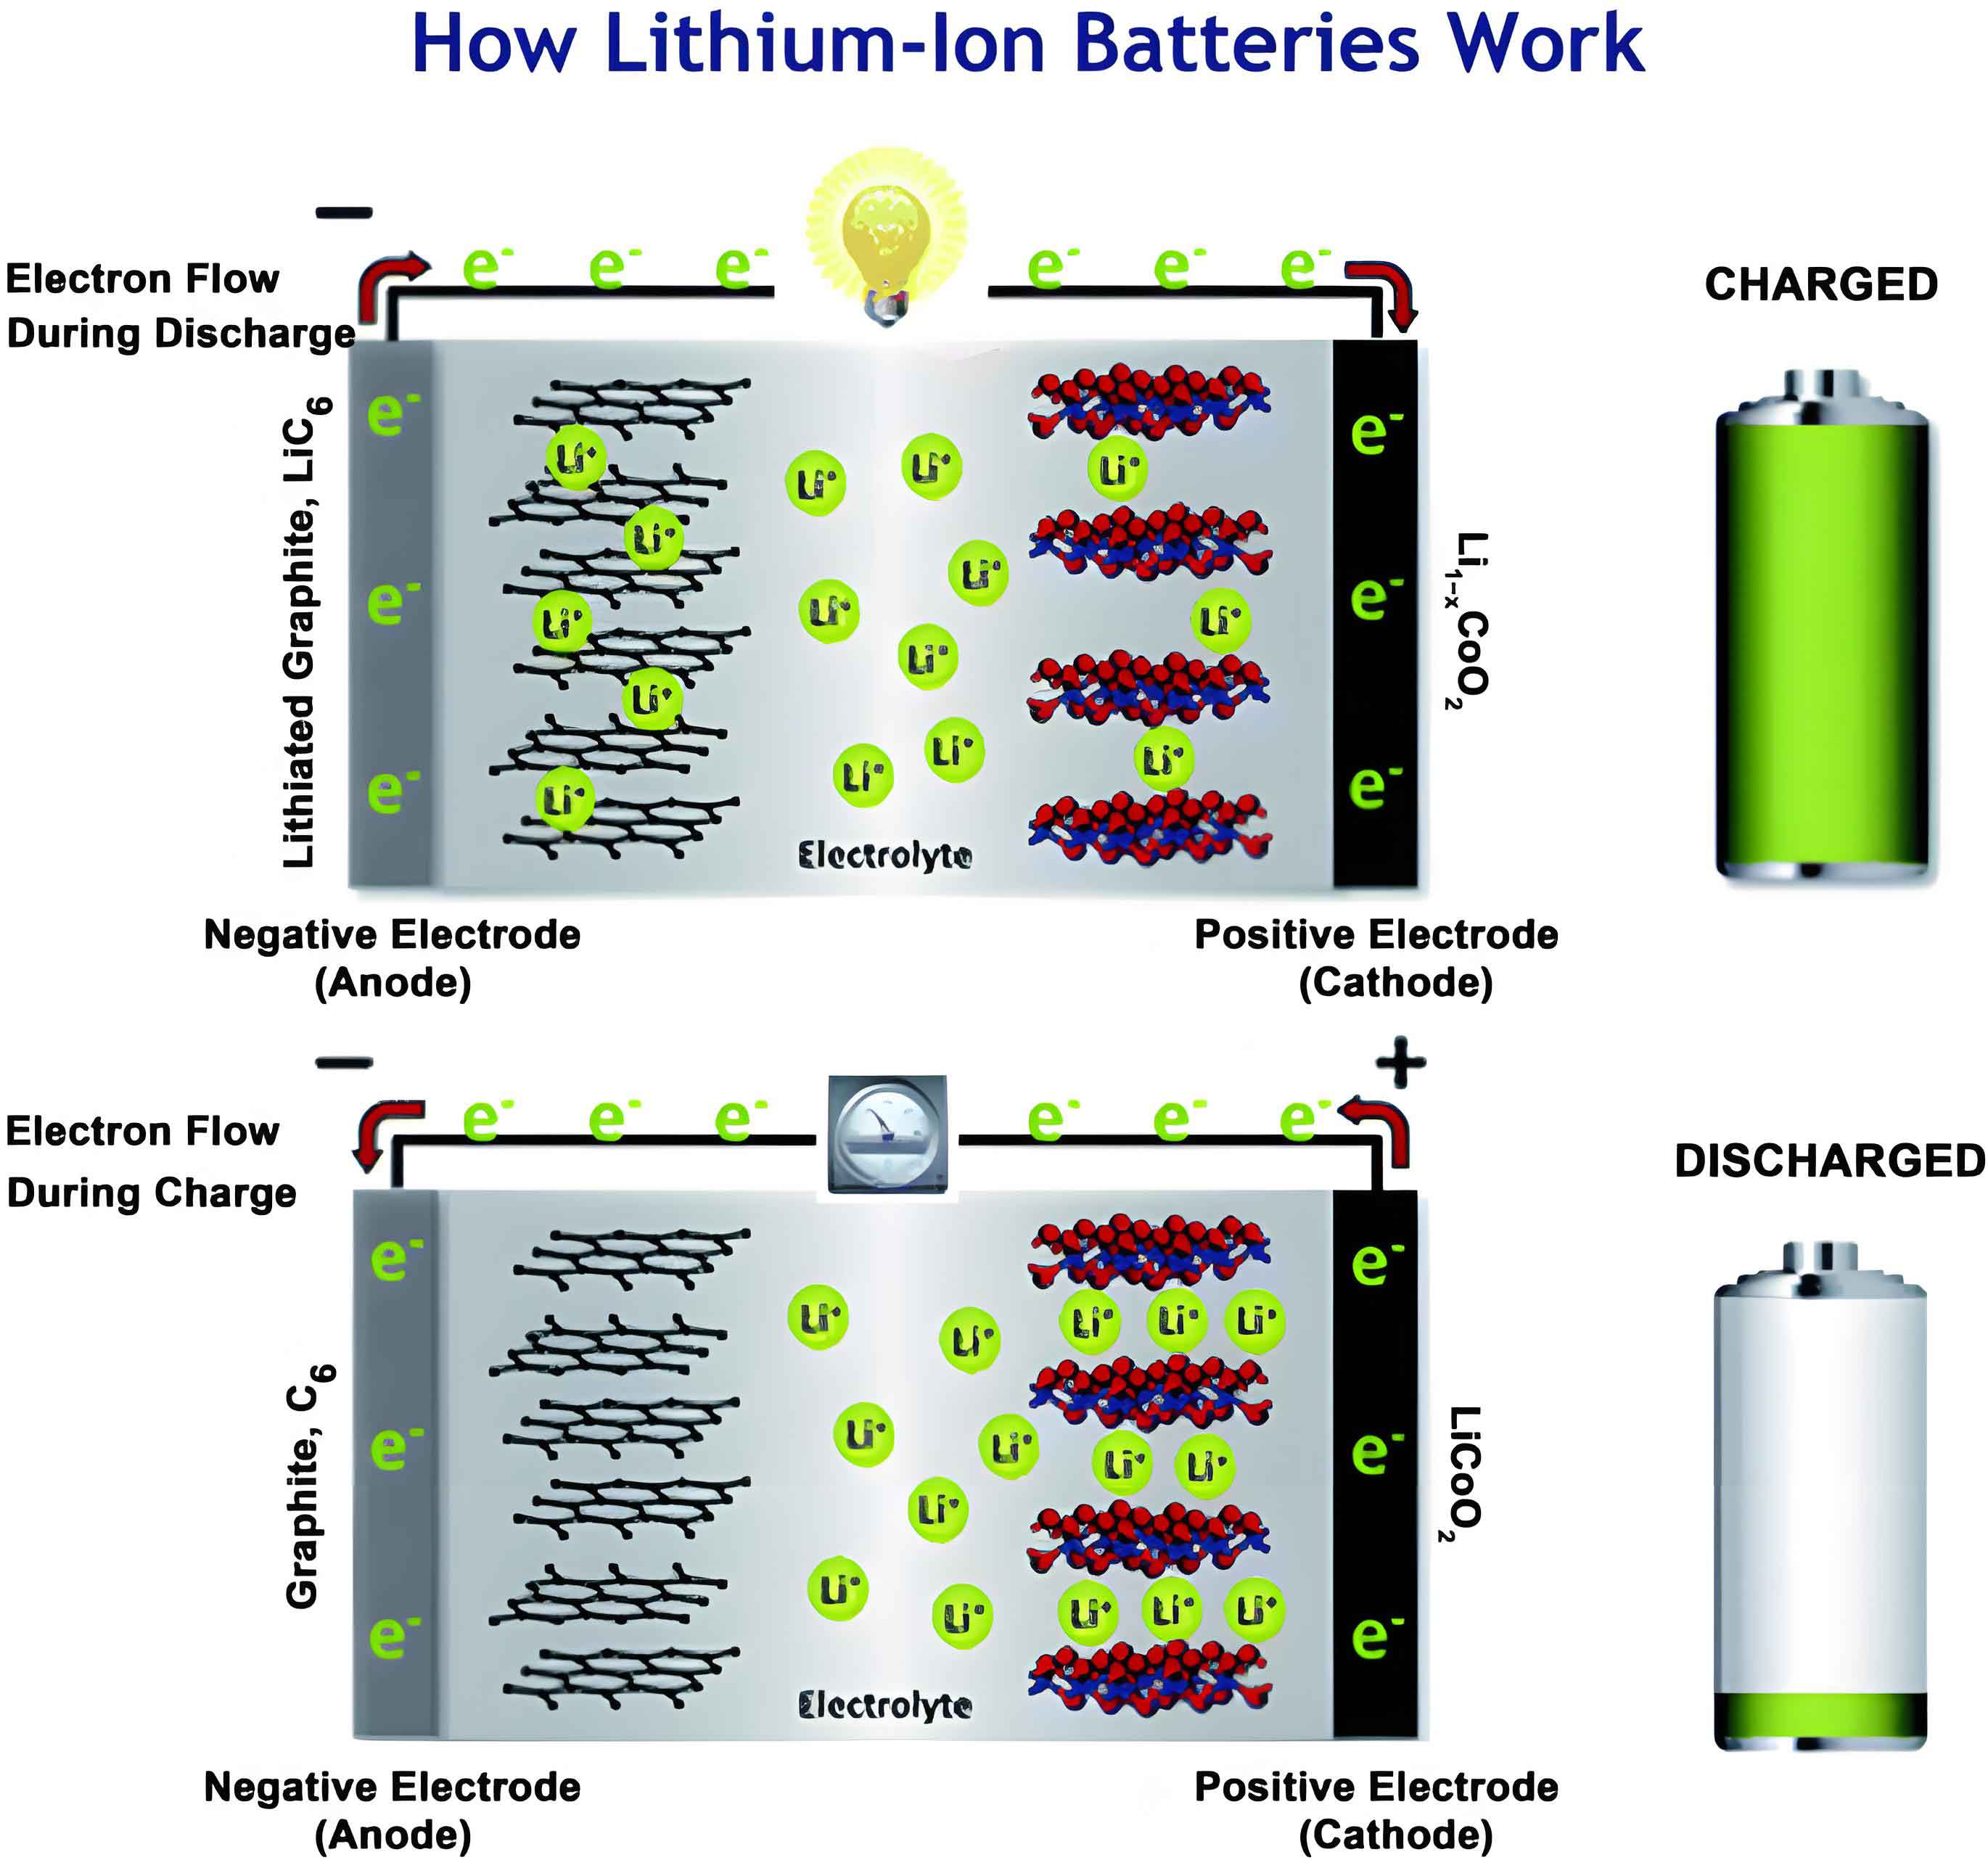
In practical applications, such as in an EV or a grid-scale storage unit, performing a full, controlled charge-discharge cycle solely to measure capacity is often infeasible. It disrupts normal operation and consumes time and energy. Consequently, the development of algorithms capable of estimating capacity from operational data without requiring special calibration procedures has become a focal point in Battery Management System (BMS) research. Traditional methods face significant limitations. Definition-based methods, like coulomb counting, suffer from cumulative error and depend heavily on the accuracy of the initial state-of-charge (SOC). Model-based approaches, which treat capacity as a parameter to be identified within equivalent circuit or electrochemical models, can be computationally intensive and their accuracy is inherently coupled to the model’s fidelity and the chosen optimization process. Machine learning methods offer promise but often require vast amounts of labeled training data, which may not be readily available for all battery types and conditions.
Among the most promising techniques are those based on Health Indicators (HIs). The principle is intuitive: identify a feature extracted from readily available operational data—such as voltage, current, and temperature—that exhibits a strong, consistent correlation with the battery’s fading capacity. This feature, the HI, serves as a proxy for health. By establishing a mathematical mapping between the HI and the actual capacity, one can estimate the latter simply by computing the HI from a standard operation, like a partial charge. Incremental Capacity (IC) analysis, which involves analyzing the derivative of capacity with respect to voltage ($dQ/dV$), is a powerful tool for generating such HIs. IC curves magnify the subtle phase transitions occurring within the battery’s electrodes, making age-related changes more discernible than in raw voltage curves. Common HIs extracted from IC curves include peak position, peak height, peak distance, and peak area. However, many existing methods developed in laboratory settings often overlook the complexities of real-world operation. They may be validated under fixed temperatures and constant, low charge rates, failing to account for the wide temperature fluctuations and varying charge currents (C-rates) encountered in EVs.
This work addresses these gaps by proposing a robust, online capacity estimation method for li ion battery systems. We first delve into the mechanistic understanding of capacity fade, linking observable changes in the IC curve to the dominant degradation mode. We then introduce a novel HI—the half-peak area of a specific characteristic peak in the charging IC curve. Crucially, we develop a recursive update algorithm for its online calculation, making it suitable for implementation on embedded BMS hardware with limited memory and processing power. Finally, and key to real-world applicability, we establish correction functions to account for the coupled effects of ambient temperature and charge C-rate on the extracted HI, enabling accurate capacity estimation across a broad spectrum of operating conditions.
1. Understanding Capacity Fade: Modes and Signatures
The gradual loss of capacity in a li ion battery is not a monolithic process but the result of several intertwined physical and chemical degradation mechanisms. These mechanisms manifest as distinct, quantifiable “modes” of capacity loss. Understanding these modes is essential for selecting a meaningful HI. The three primary capacity fade modes are:
- Loss of Lithium Inventory (LLI): This refers to the permanent loss of cyclable lithium ions from the system. Lithium ions become irreversibly trapped, typically in the Solid Electrolyte Interphase (SEI) layer that forms on the graphite anode. The SEI continuously breaks and reforms during cycling, consuming fresh lithium and electrolyte. Lithium plating under harsh conditions (low temperature, high charge rate) also contributes to LLI. Since the number of shuttling lithium ions directly determines the capacity, LLI is often the primary driver of capacity fade.
- Loss of Active Material at the Negative Electrode (LAMNE): This involves a reduction in the amount of electrochemically active material (e.g., graphite) in the anode. Causes include graphite particle cracking or exfoliation due to mechanical stress from volume changes, loss of electrical contact with the current collector, or corrosion of the binder material.
- Loss of Active Material at the Positive Electrode (LAMPE): Similar to LAMNE, this is the degradation of the cathode’s active material (e.g., LiFePO4), often through structural disordering, transition metal dissolution, or loss of electrical contact.
In a commercial li ion battery, these modes are coupled. For instance, SEI growth (causing LLI) may also lead to pore clogging, isolating some anode material (causing LAMNE). The goal of a diagnostic HI is to be sensitive to the dominant fade mode.
Incremental Capacity (IC) Analysis provides a non-invasive, in-situ method to observe these fade modes. For a LiFePO4 (LFP)/graphite cell, the charging IC curve reveals several peaks. Each peak corresponds to a specific phase transition in the graphite anode, superimposed onto the long, flat voltage plateau of the LFP cathode. The evolution of these peaks with aging tells the degradation story. A shrinking peak area, particularly for the peak associated with the final stage of graphite lithiation, is a direct signature of LLI, as fewer lithium ions are available to complete the phase transition. In contrast, significant shifts in peak voltage or the disappearance of peaks might indicate LAM or increased internal resistance. For the LFP batteries studied here, IC analysis confirmed that LLI is the principal capacity fade mechanism, with minimal observable LAM throughout the aging tests.
2. The Proposed Method: Half-Peak Area as a Robust Health Indicator
Building on the mechanistic insight that LLI is dominant and is reflected in a specific IC peak, we propose using the area under a segment of this peak—the “half-peak area”—as the primary Health Indicator.
2.1 Definition and Rationale
The half-peak area is defined as the integral of the IC curve over a fixed voltage interval ($\delta U$) symmetrically surrounding the characteristic peak’s maximum. Formally, for a peak located at voltage $U_{peak}$ with an IC curve $IC(U)$, the half-peak area $S$ is:
$$S = \int_{U_{peak} – \delta U/2}^{U_{peak} + \delta U/2} IC(U) dU$$
This is equivalent to the charge capacity injected during the voltage span $\delta U$ centered on the peak. Compared to using a single-point feature like peak height or position, the half-peak area offers superior robustness against data noise, sampling irregularities, and minor fluctuations in the charging process. It inherently averages information from multiple points around the peak, making the HI more stable and reliable for online implementation.
2.2 Online Extraction via Recursive Update Algorithm
A critical challenge for vehicle BMS implementation is the limited memory. Storing an entire high-resolution charge curve for offline IC analysis is often impractical. We overcome this with an efficient recursive update algorithm that computes the half-peak area in real-time during a charge event, with minimal memory footprint.
The algorithm proceeds as follows, executed at each voltage sampling step during a constant-current (CC) charge phase:
- IC Value Calculation: The incremental capacity $IC_k$ at voltage $U_k$ is calculated using a discrete approximation over a small voltage window $\Delta U$ (e.g., 1 mV):
$$IC_k \approx \frac{\Delta Q_k}{\Delta U} = \frac{ \sum_{i}^{l} I_i (t_{i+1} – t_i) / 3600}{\Delta U}$$
where $\Delta Q_k$ is the charge accumulated while the voltage increases from $U_k$ to $U_k + \Delta U$, and $l$ is the number of data points in that interval. Prior filtering (e.g., moving average) is applied to raw voltage data to smooth noise. - Peak Detection: The algorithm monitors the sequence of $IC_k$ values. As long as $IC_{k} \geq IC_{k-1}$, it is on the rising edge of a peak. The current voltage $U_k$ is continuously stored as a candidate $U_{peak}$.
- Area Integration: When $IC_{k} < IC_{k-1}$ is detected, it signifies the descent from the peak. The last stored $U_{peak}$ is confirmed as the actual peak voltage. Integration begins: starting from $U_{peak} – \delta U/2$, every subsequent unit of charge $\Delta Q$ is added to an accumulator $S$ until the voltage reaches $U_{peak} + \delta U/2$.
$$S = S + \Delta Q_j \quad \text{for } U_j \in [U_{peak} – \delta U/2, \,\, U_{peak} + \delta U/2]$$ - Output: The final value of $S$ at the end of the integration interval is the extracted half-peak area HI for that charge session.
This method is computationally lightweight and only requires storing a few running variables (current $U_{peak}$, accumulator $S$, previous $IC_{k-1}$). It automatically processes the correct peak because, during a full charge, the integration result for later, higher-voltage peaks will overwrite those of earlier ones.
2.3 Mapping the HI to Capacity
To establish the relationship between the half-peak area $S$ and the actual maximum capacity $C$, a baseline characterization is performed. Using high-precision, low-rate charge data (e.g., 0.025C) at a reference temperature (e.g., 25°C) from a battery aged to different states, we extract $S$ and measure the true capacity $C$. The mapping is typically a simple low-order polynomial. For the LFP cells studied, a quadratic relationship provided an excellent fit:
$$C = k_1 S^2 + k_2 S + k_3$$
where $k_1$, $k_2$, and $k_3$ are fitting coefficients. The high coefficient of determination ($R^2 > 0.998$) confirms the strong correlation. This polynomial serves as the core estimation model. Once the coefficients are determined from baseline tests, online capacity estimation reduces to: 1) extracting $S$ from a charge, and 2) evaluating the polynomial.
3. Accounting for Real-World Conditions: Temperature and C-Rate Corrections
The baseline model above assumes ideal, low-rate charging at a constant reference temperature. Real vehicle charging occurs at various C-rates (0.1C to 1C+) and across a wide ambient temperature range. Both factors significantly influence the shape and position of the IC curve, and thus the value of $S$, independently of aging. An uncorrected $S$ would lead to large capacity estimation errors. Therefore, we develop explicit correction functions.
The coupling effect of temperature and C-rate is illustrated in the figure below. Higher temperatures reduce internal resistance, shifting the IC curve to lower voltages and increasing peak heights. Higher C-rates increase polarization, shifting the curve to higher voltages and generally depressing and broadening the peaks.
To decouple these effects, we model them separately. First, we characterize the influence of temperature at a fixed, low C-rate. The half-peak area $S_{n}(t)$ at C-rate $n$ and temperature $t$ can be expressed relative to its value at the reference temperature $t_{ref}$ (e.g., 25°C):
$$S_{n}(t_{ref}) = S_{n}(t) – \delta_{temp}$$
where the temperature correction $\delta_{temp}$ is modeled as a function of the average temperature within the half-peak window:
$$\delta_{temp} = p_1 (t – t_{ref}) + p_2 (t – t_{ref})^2$$
Here, $p_1$ and $p_2$ are coefficients determined empirically.
Next, we characterize the influence of C-rate at the reference temperature. After applying the temperature correction to data collected at different C-rates but varying temperatures, we obtain $S_{n}(t_{ref})$. The C-rate effect is then modeled relative to the reference C-rate $n_{ref}$ (e.g., 0.025C):
$$S_{n_{ref}}(t_{ref}) = S_{n}(t_{ref}) – \delta_{rate}$$
where the C-rate correction $\delta_{rate}$ is:
$$\delta_{rate} = q_1 (n – n_{ref}) + q_2 (n – n_{ref})^2$$
with $q_1$ and $q_2$ as empirical coefficients.
Combined Correction: For online estimation, the half-peak area $S_{n}(t)$ extracted from an arbitrary charge at C-rate $n$ and temperature $t$ is first corrected to the reference condition $S_{n_{ref}}(t_{ref})$ before being input to the capacity estimation polynomial.
$$S_{n_{ref}}(t_{ref}) = S_{n}(t) – [p_1 (t – t_{ref}) + p_2 (t – t_{ref})^2] – [q_1 (n – n_{ref}) + q_2 (n – n_{ref})^2]$$
This two-step correction enables universal capacity estimation. The correction coefficients ($p_1, p_2, q_1, q_2$) are determined once from a characterization dataset involving charges at multiple temperatures and C-rates.
4. Experimental Validation and Results
The proposed method was validated using commercial LFP/graphite li ion battery cells with a nominal capacity of 202 Ah. A comprehensive testing platform was employed, including a battery cycler, a climate chamber, and a data acquisition system.
4.1 Test Matrix
Cells underwent several test protocols:
- Reference Capacity Test: Periodic full charge-discharge cycles at 25°C to establish the ground-truth capacity over life.
- OCV Test: Low-rate (0.025C) charge-discharge tests at various states-of-health to generate precise IC curves for baseline model fitting.
- Multi-Condition Charge Tests: Constant-current charges at different temperatures (15°C, 25°C, 45°C) and different C-rates (0.25C, 0.5C, 0.6C, 0.8C) to characterize and validate the temperature/C-rate corrections.
- Aging Test: Accelerated aging was performed at 45°C with 1C charge/discharge cycles to induce significant capacity fade.
4.2 Estimation Performance
The capacity estimation algorithm was constructed as follows:
- The baseline $S$-$C$ polynomial (Eq. 3) was fitted using data from one cell (LFP5) aged to different states.
- The temperature and C-rate correction coefficients ($p_1, p_2, q_1, q_2$) were determined using multi-condition charge data from a separate cell (LFP4).
- The fully constructed algorithm (online HI extraction + correction + polynomial evaluation) was then tested on different cells (LFP1, LFP3, LFP4) at various aging states, temperatures, and C-rates.
The results demonstrated high accuracy and robustness. The tables below summarize the capacity estimation error (as a percentage of the true measured capacity) for cells LFP1 and LFP3 under various conditions.
| Temperature (°C) | 0.5C Error (%) | 0.6C Error (%) | 0.8C Error (%) |
|---|---|---|---|
| 15 | 0.11 | – | – |
| 25 | 0.45 | 0.44 | 0.73 |
| 45 | 0.69 | 1.04 | 1.79 |
| Temperature (°C) | 0.5C Error (%) | 0.6C Error (%) | 0.8C Error (%) |
|---|---|---|---|
| 15 | 0.72 | – | – |
| 25 | 2.02 | 1.41 | 1.54 |
| 45 | 1.61 | 2.95 | 0.41 |
The key findings are:
- The maximum estimation error across all tests was below 3%, which is well within acceptable limits for most BMS applications.
- The algorithm performed reliably across a wide temperature range (15°C to 45°C) and at practical C-rates up to 0.8C.
- The method showed good generalizability, providing accurate estimates for cells not used in the initial model fitting (LFP1, LFP3).
This validates that the temperature and C-rate corrections effectively decouple the operational effects from the aging signal encapsulated in the half-peak area.
5. Conclusion
This work presents a robust, mechanism-informed, and practical method for online capacity estimation of li ion battery systems. By integrating electrochemical diagnostics with algorithm design suited for embedded systems, the method bridges the gap between laboratory analysis and real-world application.
The principal contributions are threefold:
- Mechanistic Foundation: The method is grounded in the analysis of capacity fade modes. By identifying LLI as the dominant mechanism for the studied LFP batteries, the half-peak area of the corresponding IC curve is established as a physically meaningful Health Indicator strongly correlated with capacity loss.
- Computational Efficiency: The proposed recursive update algorithm for online half-peak area extraction eliminates the need to store complete charge curves, making it highly suitable for implementation on resource-constrained vehicle BMS or edge computing devices in energy storage systems.
- Operational Robustness: The explicit mathematical correction for ambient temperature and charge C-rate is crucial. It enables the algorithm to maintain high estimation accuracy (error < 3%) across the wide range of conditions encountered in actual EV operation, moving beyond the limitations of fixed-condition laboratory models.
The proposed method offers a balanced solution, providing model-based insight without excessive complexity, and data-driven accuracy without requiring massive labeled datasets. It represents a significant step towards achieving reliable, real-time state-of-health monitoring for li ion battery packs, thereby enhancing their safety, longevity, and operational efficiency in electric vehicles and grid storage applications. Future work may focus on extending the correction models to a broader array of battery chemistries and dynamically updating the polynomial coefficients as the battery ages beyond the initial characterization range.