
In the context of global energy challenges, the integration of renewable energy sources into building design has become a critical focus. As a researcher dedicated to advancing sustainable architecture, I have extensively explored the potential of solar systems, particularly photovoltaic (PV) technologies, to enhance building performance. This article presents a comprehensive numerical simulation study based on the collaborative use of Ecotect and Radiance software, investigating the impact of external PV shading structures—specifically external PV panels and PV louver systems—on indoor daylighting quality and power generation. The solar system, as a key component of modern building envelopes, offers a promising pathway to reduce reliance on traditional energy sources and mitigate environmental impacts. Through this work, I aim to provide insights into optimizing solar system configurations for improved energy efficiency and occupant comfort.
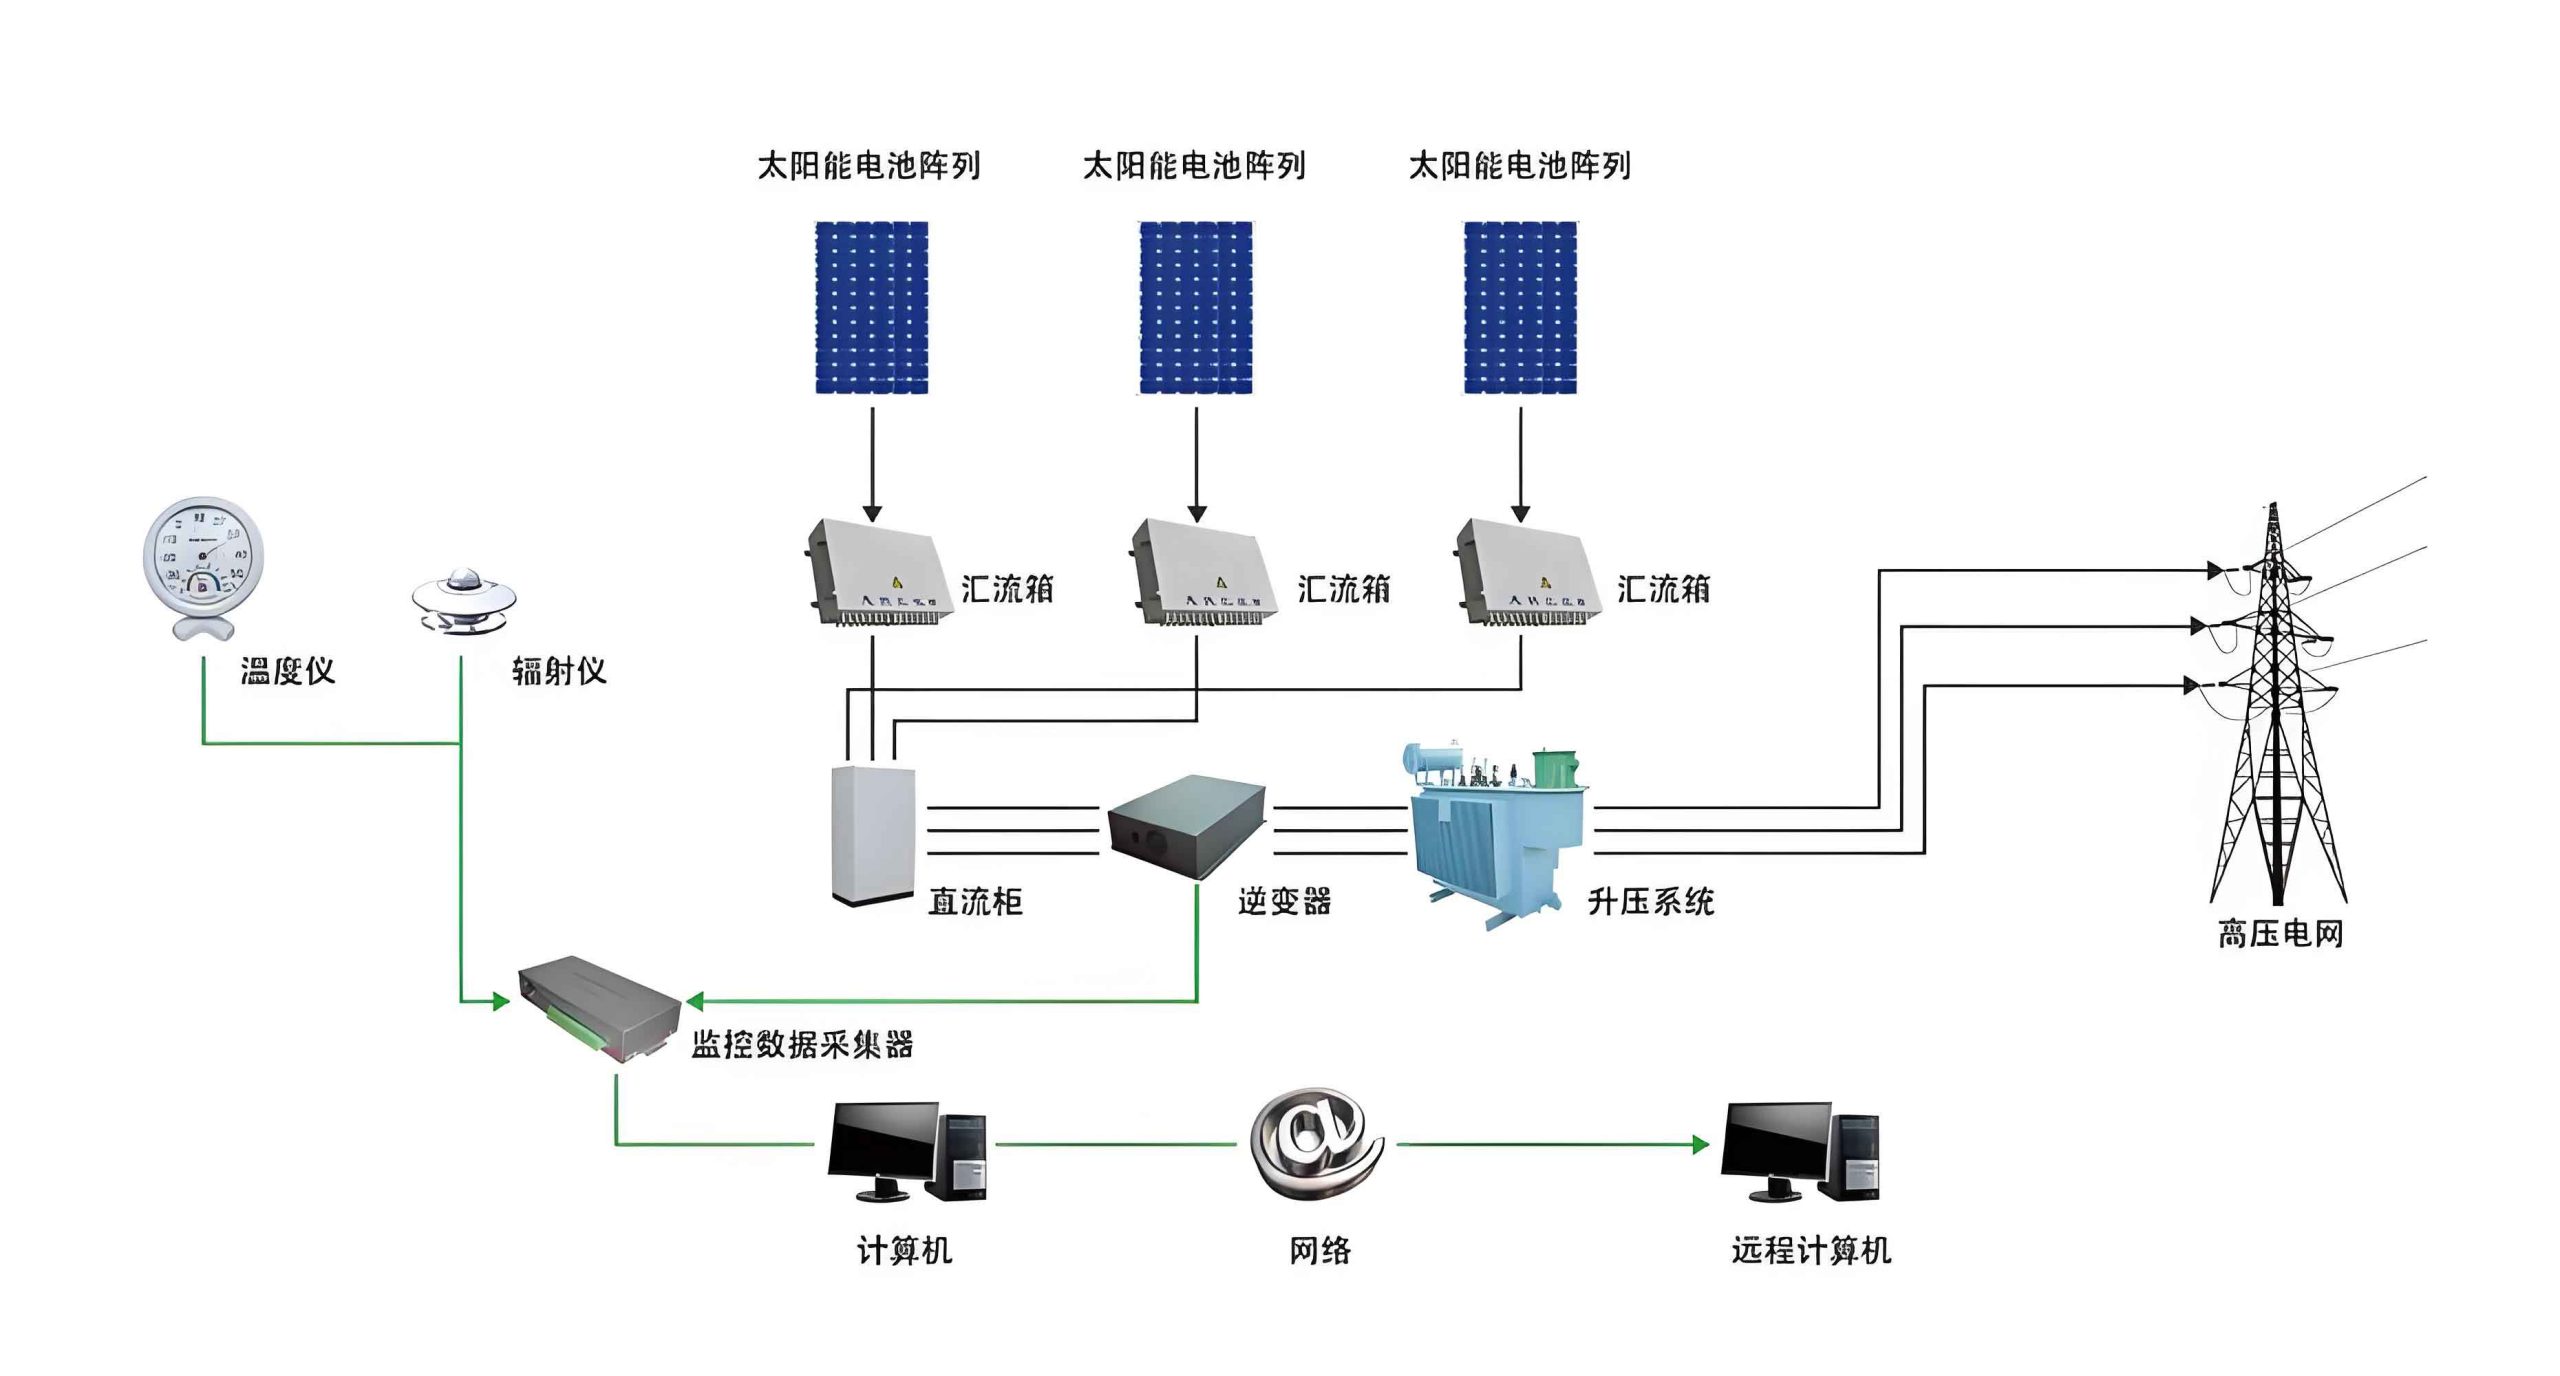
The importance of solar systems in building integration cannot be overstated. With buildings accounting for a significant portion of global energy consumption, harnessing solar energy through PV systems can substantially cut carbon emissions and operational costs. In this study, I focus on external shading structures that serve dual purposes: they act as daylighting controls and electricity generators. By simulating various parameters, such as length, angle of inclination (AOB), transparency, and window-to-wall ratio (WWR), I assess how these factors influence key metrics like daylight factor (DF), daylight autonomy (DA), and annual power output. The solar system design is evaluated under the climatic conditions of a representative region, with an emphasis on achieving a balance between natural lighting and energy production.
To quantify daylighting performance, I utilize standard metrics. The daylight factor (DF) is defined as the ratio of indoor illuminance under overcast sky conditions to outdoor illuminance, expressed as a percentage. Mathematically, it can be represented as:
$$ DF = \frac{E_i}{E_o} \times 100\% $$
where \( E_i \) is the illuminance at a point indoors, and \( E_o \) is the unobstructed horizontal illuminance outdoors. Another critical metric is daylight autonomy (DA), which measures the percentage of annual daytime hours when a minimum illuminance level (e.g., 300 lux) is met solely by natural light. This is given by:
$$ DA = \frac{T_{adequate}}{T_{total}} \times 100\% $$
where \( T_{adequate} \) is the time when illuminance exceeds the threshold, and \( T_{total} \) is the total daytime hours considered. For power generation, the output of the solar system is calculated based on PV panel efficiency, irradiance, and orientation. The energy yield \( P \) can be approximated as:
$$ P = A \times \eta \times G \times \cos(\theta) $$
where \( A \) is the area of the PV panel, \( \eta \) is the conversion efficiency, \( G \) is the solar irradiance, and \( \theta \) is the angle of incidence. These formulas underpin the analysis presented in this study, allowing for a systematic evaluation of solar system performance.
In the simulation setup, I model a room with dimensions 6 m in length, 4 m in width, and 3.5 m in height, representing a typical office space. The window is positioned at a height of 900 mm, and the reference plane for illuminance measurements is set at 750 mm above the floor. The materials used in the model have specific optical properties, as summarized in Table 1. These properties influence light reflection and transmission, crucial for accurate daylighting simulation. The solar system components, including external PV panels and PV louvers, are integrated into the south-facing facade to maximize solar exposure. Simulations are conducted for the worst-case scenario of a fully overcast day on December 21st at 14:00, as well as for annual daylighting hours from 08:00 to 18:00 daily.
| Material | Reflectance | Transmittance |
|---|---|---|
| Floor | 0.4 | – |
| Ceiling | 0.7 | – |
| Walls | 0.6 | – |
| Window Glass | 0.2 | 0.6 |
The external PV panel structure consists of opaque monocrystalline silicon panels attached to the building exterior. I vary the panel length from 40 cm to 80 cm and the AOB from 0° to 45° to analyze their effects on DF and DA. The results indicate that increasing the panel length generally reduces both DF and DA, as the solar system blocks more incoming daylight. For instance, as shown in Table 2, when the AOB is fixed at 30°, DF decreases from approximately 3.8% to 3.2% as length increases from 40 cm to 80 cm. Similarly, DA drops from around 72% to 64% under the same conditions. This highlights the trade-off between shading for energy generation and maintaining adequate indoor lighting. The solar system’s angle also plays a role; steeper angles reduce DF more significantly, especially between 0° and 30°, due to decreased window exposure.
| Panel Length (cm) | DF (%) | DA (%) |
|---|---|---|
| 40 | 3.8 | 72 |
| 50 | 3.6 | 70 |
| 60 | 3.4 | 68 |
| 70 | 3.3 | 66 |
| 80 | 3.2 | 64 |
To further explore daylighting performance, I examine the influence of WWR and minimum illuminance thresholds on DA. For a solar system with external PV panels (length = 60 cm, AOB = 30°, transparency = 0.6), DA varies with WWR and illuminance requirements. As presented in Table 3, when the minimum illuminance is set at 300 lux, increasing WWR from 0.23 to 0.34 raises DA from 65% to over 85%. This demonstrates that larger windows enhance natural lighting, but they must be balanced against potential thermal losses. Notably, for rooms with a 300 lux threshold, a WWR above 0.26 allows DA to exceed 70%, meaning the solar system can support adequate lighting for most of the day without artificial sources. The relationship between DA and WWR can be modeled as:
$$ DA = a \times \ln(\text{WWR}) + b $$
where \( a \) and \( b \) are coefficients derived from simulation data, emphasizing the logarithmic improvement in daylight autonomy with window size.
| WWR | DA at 200 lux (%) | DA at 300 lux (%) | DA at 400 lux (%) | DA at 500 lux (%) |
|---|---|---|---|---|
| 0.23 | 75 | 65 | 55 | 45 |
| 0.26 | 80 | 70 | 60 | 50 |
| 0.29 | 85 | 75 | 65 | 55 |
| 0.32 | 88 | 78 | 68 | 58 |
| 0.34 | 90 | 80 | 70 | 60 |
Regarding power generation, the solar system’s orientation significantly affects annual energy yield. I simulate external PV panels with varying AOBs and find that an AOB of 15° maximizes total annual output, reaching approximately 79.247 kWh. In contrast, panels at 90° (parallel to the window) perform poorly due to reduced irradiance capture. However, monthly analysis reveals that the optimal AOB shifts throughout the year; for example, in January, a 30° angle yields higher generation than 15°. This suggests that adaptive solar systems, which adjust tilt monthly, could enhance overall performance. The monthly energy output \( E_m \) for a given AOB can be estimated as:
$$ E_m = \sum_{d=1}^{N} A \times \eta \times G_d \times \max(0, \cos(\theta_d)) $$
where \( G_d \) is the daily irradiance, \( \theta_d \) is the incidence angle on day \( d \), and \( N \) is the number of days in the month. By optimizing \( \theta_d \) through adjustable structures, the solar system can achieve higher annual efficiency.
To address the limitations of fixed external panels, I propose a PV louver structure that combines daylighting control with adaptive power generation. This solar system features slatted PV elements that can be tilted individually, allowing for dynamic adjustment of transparency and angle. Simulations are conducted with louver spacing from 6 cm to 9 cm and transparency from 0 to 0.6. The results show that increasing transparency dramatically improves DF and DA, as more light penetrates indoors. For instance, as transparency rises from 0 to 0.6, DF nearly doubles under constant spacing conditions. This effect is summarized in Table 4, where DF increases from 1.5% to 3.0% for a spacing of 8 cm. In contrast, louver spacing has a milder impact; widening gaps from 6 cm to 9 cm boosts DF by only about 0.5%. This underscores the importance of material transparency in solar system design for daylighting.
| Transparency | DF at 6 cm spacing (%) | DF at 7 cm spacing (%) | DF at 8 cm spacing (%) | DF at 9 cm spacing (%) |
|---|---|---|---|---|
| 0.0 | 1.5 | 1.6 | 1.7 | 1.8 |
| 0.2 | 2.0 | 2.1 | 2.2 | 2.3 |
| 0.4 | 2.5 | 2.6 | 2.7 | 2.8 |
| 0.6 | 3.0 | 3.1 | 3.2 | 3.3 |
Similarly, DA benefits from higher transparency in the PV louver solar system. As shown in Table 5, for a spacing of 8 cm, DA improves from 60% to 75% as transparency increases from 0 to 0.6. The effect of spacing is less pronounced, especially at higher transparencies, indicating that transparency is the dominant factor. Moreover, WWR plays a crucial role; for a minimum illuminance of 300 lux, a WWR above 0.26 ensures DA over 70%, similar to the external panel case. This consistency across solar system types highlights the universal importance of window design in daylighting performance. The interaction between transparency and spacing can be expressed through a linear model:
$$ \text{DF} = c_1 \times T + c_2 \times S + c_3 $$
where \( T \) is transparency, \( S \) is spacing, and \( c_1, c_2, c_3 \) are constants derived from regression analysis. Such models aid in optimizing solar system parameters for specific building requirements.
| Transparency | DA at 6 cm spacing (%) | DA at 7 cm spacing (%) | DA at 8 cm spacing (%) | DA at 9 cm spacing (%) |
|---|---|---|---|---|
| 0.0 | 60 | 62 | 63 | 64 |
| 0.2 | 65 | 67 | 68 | 69 |
| 0.4 | 70 | 72 | 73 | 74 |
| 0.6 | 75 | 76 | 77 | 78 |
Power generation from the PV louver solar system also shows promising results. With an AOB of 15°, the annual energy output reaches about 126.755 kWh, outperforming fixed external panels due to better adaptability. However, monthly variations persist, suggesting that dynamic angle adjustment could further boost yield. For instance, in summer months, lower tilt angles may capture more direct sunlight, while in winter, steeper angles might be optimal. The total annual energy \( E_{\text{total}} \) for an adaptive system can be formulated as:
$$ E_{\text{total}} = \sum_{m=1}^{12} \max_{\theta} \left( \int_{t} A \times \eta \times G_m(t, \theta) \, dt \right) $$
where \( G_m(t, \theta) \) is the time-dependent irradiance in month \( m \) at angle \( \theta \). This optimization approach ensures that the solar system operates at peak efficiency year-round.
In addition to quantitative metrics, I consider the visual comfort aspects of solar system integration. Glare reduction and uniform light distribution are critical for occupant well-being. The PV louver structure, with its adjustable slats, can diffuse sunlight effectively, minimizing harsh contrasts. Simulations show that higher transparency louvers reduce dark spots indoors, creating a more evenly lit environment. This aligns with the broader goal of solar system design: to enhance both energy performance and human-centric factors. The uniformity index \( U \), defined as the ratio of minimum to average illuminance, can be used to assess this:
$$ U = \frac{E_{\text{min}}}{E_{\text{avg}}} $$
Values closer to 1 indicate better uniformity, and my simulations reveal that PV louvers with transparency above 0.4 achieve \( U > 0.7 \), surpassing fixed panels.
To synthesize the findings, I develop a comparative analysis between external PV panels and PV louvers. Table 6 summarizes key performance indicators under optimal conditions. The solar system with PV louvers demonstrates superior daylighting and energy generation, thanks to its flexibility. However, external panels may be simpler to install and maintain. The choice depends on specific project constraints, such as budget, climate, and architectural design. In all cases, integrating a solar system requires careful parameter tuning to balance multiple objectives.
| Parameter | External PV Panels | PV Louvers |
|---|---|---|
| Optimal AOB | 15° | 15° (adjustable) |
| Annual Energy Output (kWh) | 79.247 | 126.755 |
| DF at Worst-case (%) | 3.4 | 3.2 |
| DA at 300 lux (%) | 70 | 77 |
| Recommended Transparency | 0.6 | 0.6 |
| Recommended WWR | >0.26 | >0.26 |
| Uniformity Index (U) | 0.65 | 0.75 |
Furthermore, I explore the implications of climate variability on solar system performance. While this study focuses on a specific region, the methodology can be extended globally. For instance, in sunnier climates, higher transparency may lead to overheating, necessitating additional shading controls. Conversely, in cloudy areas, maximizing light transmission becomes paramount. The solar system must be tailored to local solar geometry and weather patterns. A generalized model for predicting performance can be derived using climatic data:
$$ \text{Performance} = f(\text{latitude}, \text{irradiance}, \text{temperature}, \text{system parameters}) $$
where \( f \) is a function determined through machine learning or empirical correlations. This holistic approach ensures that solar systems contribute effectively to sustainable building design worldwide.
In conclusion, this numerical simulation study underscores the potential of solar photovoltaic external shading structures in building integration. Through detailed analysis using Ecotect and Radiance, I demonstrate that key parameters—such as length, angle, transparency, and window-to-wall ratio—significantly influence indoor daylighting quality and power generation. The solar system with PV louvers offers enhanced adaptability, achieving higher daylight autonomy and energy yields compared to fixed external panels. For most applications, a transparency above 0.2 and a WWR above 0.26 are recommended to maintain adequate natural lighting. Moreover, dynamic angle adjustment can optimize monthly energy capture, making the solar system more efficient year-round. These insights provide a foundation for architects and engineers to design high-performance building envelopes that leverage solar energy effectively. As the world transitions to renewable sources, innovative solar systems will play a pivotal role in creating energy-efficient, comfortable, and sustainable built environments.
Future research could expand on this work by incorporating thermal simulations to assess overall energy balance, including heating and cooling loads. Additionally, real-world validation through prototyping and monitoring would strengthen the findings. The integration of smart controls, such as sensors and actuators, could enable fully adaptive solar systems that respond in real-time to changing conditions. Ultimately, the goal is to advance solar system technology towards net-zero energy buildings, where every facet of design contributes to a greener future. By continuing to explore and refine these systems, we can harness the sun’s power more effectively, reducing our ecological footprint while enhancing human comfort and productivity.