
The pursuit of sustainable and cost-effective energy solutions has driven extensive research into photovoltaic technologies. Among these, thin film solar panels offer advantages such as material savings, flexibility, and the potential for low-temperature, large-area manufacturing. Identifying optimal absorber materials is crucial for advancing this technology. Tin sulfide (SnS) emerges as a particularly compelling candidate for the absorber layer in next-generation thin film solar panels. It is composed of earth-abundant, non-toxic elements and possesses a near-ideal direct bandgap ranging from 1.3 to 1.5 eV, coupled with a high absorption coefficient exceeding 104 cm-1 in the visible spectrum. These intrinsic properties theoretically allow for high power conversion efficiencies while keeping material costs low. However, the practical efficiencies of SnS-based thin film solar panels reported to date, with a record of 4.8%, remain significantly below the theoretical limit of approximately 24%. This performance gap is attributed to challenges including the presence of secondary phases (like SnS2, Sn2S3), non-ideal band alignment at heterojunction interfaces, and suboptimal device architecture.
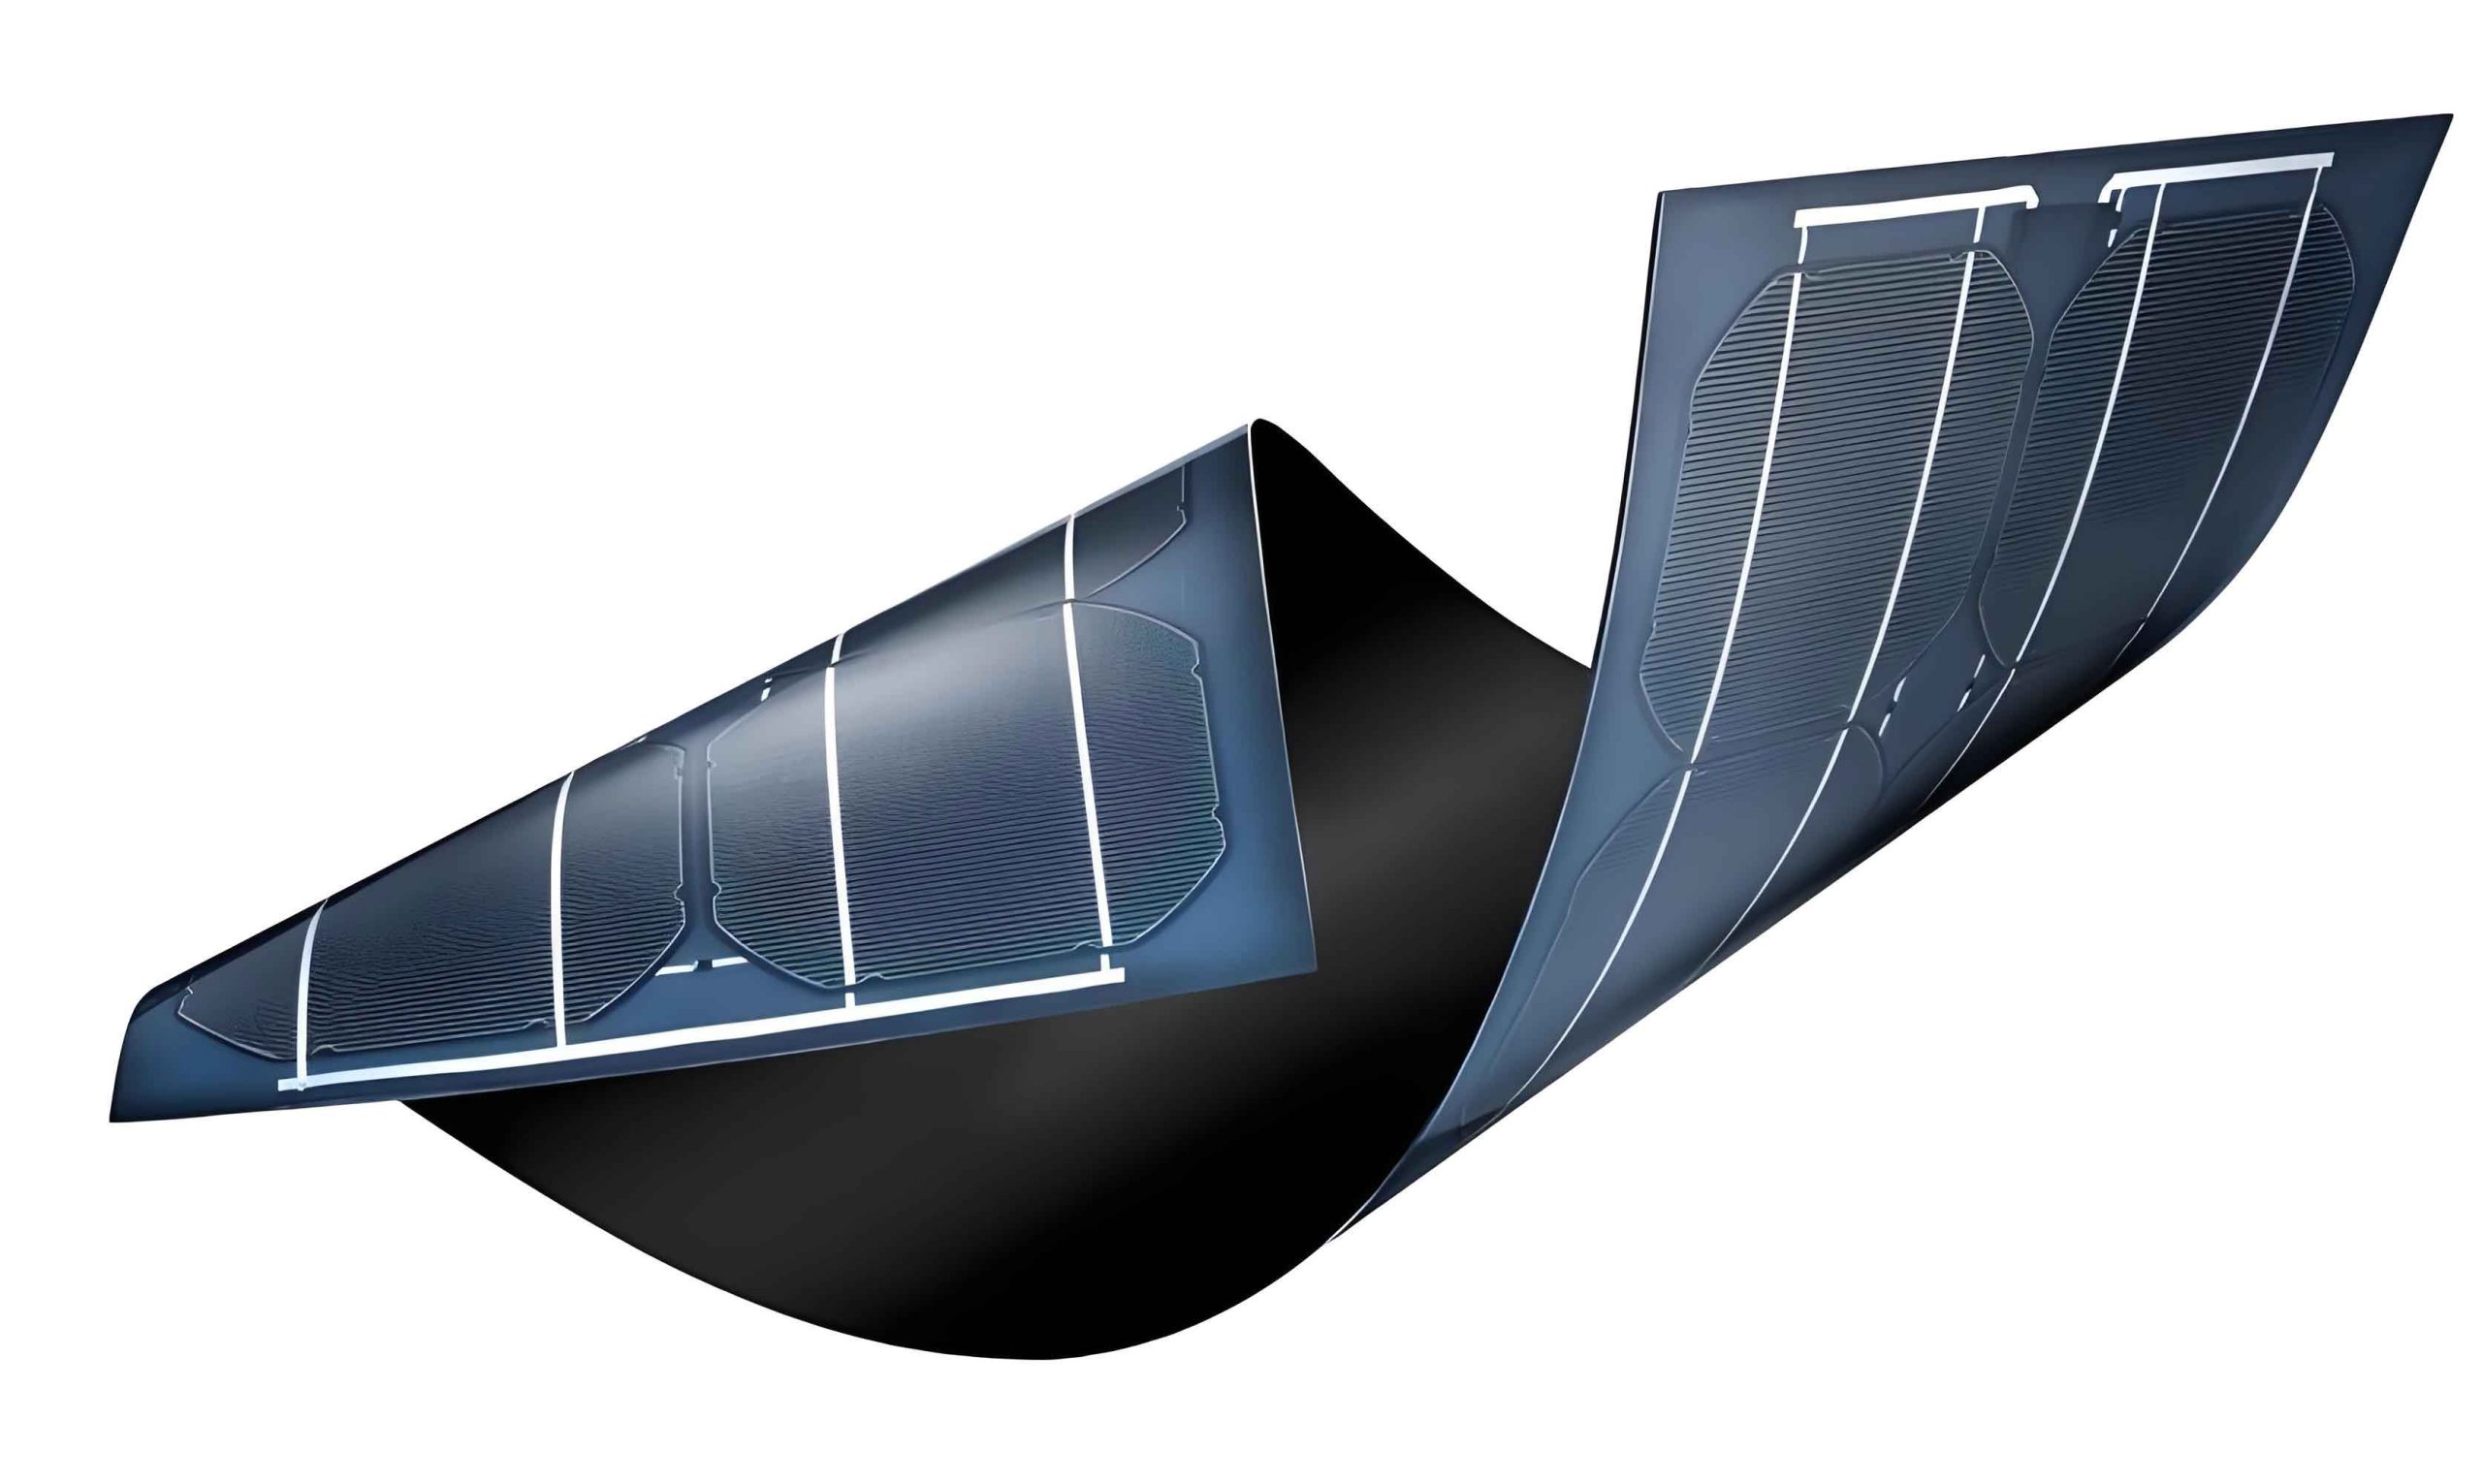
To address these challenges and unlock the potential of SnS, careful design and optimization of the complete device stack are essential. The choice of buffer layer material, which forms the heterojunction with the SnS absorber, is critical for effective charge carrier separation and collection. While cadmium sulfide (CdS) has been widely used, its toxicity and relatively narrow bandgap have prompted the search for alternatives. Titanium dioxide (TiO2) presents an excellent option due to its non-toxicity, chemical stability, low cost, and wider bandgap (~3.2 eV), which minimizes parasitic absorption. The current champion SnS thin film solar panel utilizes a TiO2 buffer, indicating its great promise. This study employs numerical simulation to comprehensively investigate and optimize the key parameters of a Mo/SnS/TiO2/ZnO:Al thin film solar panel structure, providing a detailed theoretical roadmap for achieving high-efficiency devices.
Computational Methodology and Device Modeling
Simulation Framework
The numerical analysis in this work is performed using the one-dimensional solar cell capacitance simulator (SCAPS-1D) software. SCAPS solves the fundamental semiconductor equations under steady-state conditions to simulate device performance. The core equations governing the electrostatic potential and charge carrier transport are the Poisson equation and the electron/hole continuity equations:
Poisson’s Equation:
$$\frac{d^2\psi(x)}{dx^2} = \frac{e}{\epsilon_0 \epsilon_r} \left(p(x) – n(x) + N_D – N_A + \rho_p – \rho_n\right)$$
Electron Continuity Equation:
$$\frac{d}{dx} J_n(x) – e \frac{\partial n(x)}{\partial t} – e \frac{\partial \rho_n}{\partial t} = G(x) – R(x)$$
Hole Continuity Equation:
$$\frac{d}{dx} J_p(x) + e \frac{\partial p(x)}{\partial t} + e \frac{\partial \rho_p}{\partial t} = G(x) – R(x)$$
Where $\psi$ is the electrostatic potential, $e$ is the elementary charge, $\epsilon_0$ and $\epsilon_r$ are the vacuum and relative permittivities, $n$ and $p$ are the free electron and hole concentrations, $N_D$ and $N_A$ are the donor and acceptor doping densities, $\rho_n$ and $\rho_p$ are the trapped electron and hole densities, $J_n$ and $J_p$ are the electron and hole current densities, and $G(x)$ and $R(x)$ are the carrier generation and recombination rates, respectively. By defining a device model with specific layer parameters, SCAPS calculates key performance metrics such as current-voltage (J-V) characteristics, quantum efficiency (QE), and electric field profiles.
Device Architecture and Material Parameters
The simulated thin film solar panel structure is Mo / p-SnS / n-TiO2 / n+-ZnO:Al. Molybdenum serves as the back contact and substrate. The p-type SnS layer is the primary light absorber. The n-type TiO2 layer acts as the buffer, forming the main charge-separating heterojunction with SnS. The heavily doped n-type ZnO:Al layer functions as the transparent front contact and window layer. The standard AM1.5G solar spectrum is used for illumination, and the default simulation temperature is 300 K. Series and shunt resistances are set to 4.25 Ω·cm² and 400 Ω·cm², respectively. The material parameters for each layer, compiled from literature and established databases, are summarized in Table 1.
| Parameter | SnS (Absorber) | TiO2 (Buffer) | ZnO:Al (Window) |
|---|---|---|---|
| Thickness (nm) | Variable (500-3000) | Variable (10-100) | 200 |
| Bandgap, Eg (eV) | 1.3 | 3.2 | 3.3 |
| Electron Affinity, χ (eV) | 4.2 | 4.2 | 4.4 |
| Relative Permittivity, εr | 13 | 9 | 9 |
| NC (cm-3) | 1.18×10¹⁸ | 2.20×10¹⁸ | 2.20×10¹⁸ |
| NV (cm-3) | 4.76×10¹⁸ | 1.80×10¹⁹ | 1.80×10¹⁹ |
| Electron Mobility, μn (cm²/V·s) | 30 | 100 | 100 |
| Hole Mobility, μp (cm²/V·s) | 90 | 25 | 25 |
| Donor Concentration, ND (cm-3) | – | Variable (1014-1019) | 1×10²⁰ |
| Acceptor Concentration, NA (cm-3) | Variable (1014-1017) | – | – |
| Defect Density (cm-3) | 1.0×10¹⁴ | 1.0×10¹⁶ | 1.0×10¹⁸ |
Band Alignment Analysis
The energy band diagram of the optimized thin film solar panel structure is crucial for understanding carrier transport. The electron affinities of SnS and TiO2 are equal at 4.2 eV. Therefore, the conduction band offset ($\Delta E_C$) at the SnS/TiO2 heterojunction is:
$$\Delta E_C = \chi_{SnS} – \chi_{TiO_2} = 0 \text{ eV}$$
This forms a “cliff-like” or zero-offset structure favorable for electron injection from the absorber into the buffer layer. The corresponding valence band offset ($\Delta E_V$) is large:
$$\Delta E_V = E_{g,TiO_2} – E_{g,SnS} – \Delta E_C = 1.9 \text{ eV}$$
This large $\Delta E_V$ creates a significant barrier that effectively blocks holes from recombining at the interface or traversing into the buffer layer, thereby enhancing charge separation. This favorable band alignment is a key reason why TiO2 is a promising buffer layer for SnS-based thin film solar panels.
Results, Discussion, and Optimization
Impact of Absorber Layer Thickness and Doping
The thickness and doping concentration of the SnS absorber layer are primary factors determining light absorption and the built-in electric field. Figure 1 shows the simulated cell parameters as the SnS thickness varies from 0.5 to 3.0 μm, with a fixed acceptor density (NA) of 1×1015 cm-3.
Short-Circuit Current Density (JSC): JSC increases monotonically with thickness, initially rising sharply and then saturating beyond 2 μm. This is directly linked to enhanced photon absorption, as confirmed by the external quantum efficiency (EQE) simulations shown in Figure 2. Thicker films capture more long-wavelength photons, boosting the photocurrent.
Open-Circuit Voltage (VOC) and Fill Factor (FF): VOC shows a similar increasing and saturating trend, governed by the relationship $V_{OC} \propto \ln(J_{SC}/J_0)$, where $J_0$ is the reverse saturation current. The FF initially improves due to reduced series resistance but starts to decline for thicknesses > 0.75 μm. This decline is attributed to increased bulk recombination and series resistance for carriers generated far from the depletion region, hindering their collection.
Power Conversion Efficiency (η): The efficiency follows JSC and VOC, reaching a plateau near 2 μm. Considering the trade-off between performance gain, material usage, and potential FF loss, an absorber thickness of 2.0 μm is selected as optimal for this thin film solar panel design.
Next, the doping density of the SnS layer (NA) is optimized for a fixed thickness of 2.0 μm. The results are plotted in Figure 3. VOC increases steadily with NA due to the enlargement of the built-in potential ($V_{bi}$). However, JSC begins to drop significantly for NA > 1016 cm-3 because higher doping increases Shockley-Read-Hall (SRH) bulk recombination, reducing carrier lifetime. The fill factor initially benefits from lower series resistance but is eventually limited by recombination. The efficiency peaks at an NA of approximately 1×1016 cm-3, yielding a simulated η of 15.66%. This represents a crucial optimization point for the absorber in this thin film solar panel.
Impact of Buffer Layer Thickness and Doping
With the SnS layer optimized (2.0 μm, 1016 cm-3), the influence of the TiO2 buffer layer is investigated. Figure 4 shows that all cell parameters (JSC, VOC, FF, η) degrade as the buffer thickness increases from 10 to 100 nm. Thicker TiO2 layers absorb more high-energy photons (λ < 387 nm, see EQE in Figure 5) that could otherwise contribute to photocurrent if absorbed in SnS. Furthermore, a thicker buffer increases the distance photogenerated electrons must travel to the front contact, raising the probability of recombination. Since performance stabilizes after a sharp initial drop, a practical and efficient thickness of 50 nm is chosen.
The doping concentration of the TiO2 buffer (ND) also plays a vital role, as shown in Figure 6. VOC remains largely unaffected. JSC, FF, and η remain constant for ND < 2×1015 cm-3, then improve until ND reaches ~1017 cm-3, after which they saturate. Higher doping increases the electric field in the buffer, improving charge collection. However, very high doping can also introduce defects that act as recombination centers. The optimal buffer doping for this thin film solar panel is found to be 1×1017 cm-3.
Influence of Operating Temperature
The performance of thin film solar panels in real-world applications is affected by ambient temperature. Figure 7 illustrates the temperature dependence of the device parameters from 280 K to 360 K. The key observations are:
- VOC decreases linearly with temperature. This is primarily due to the increase in the intrinsic carrier concentration ($n_i$) and the corresponding increase in the reverse saturation current ($J_0$), as described by the diode equation.
- JSC shows a slight increase because the bandgap of semiconductors typically decreases with temperature ($dE_g/dT < 0$), allowing absorption of slightly more long-wavelength photons.
- FF decreases moderately due to increased carrier scattering and recombination rates at higher temperatures.
The net effect is a linear decline in conversion efficiency (η) with temperature. The calculated temperature coefficient for this SnS-based thin film solar panel is -0.029 %/K. This value is comparable to or slightly better than many commercial silicon and thin-film panels, indicating reasonable thermal stability.
Effect of Back Contact Metal Work Function
An efficient ohmic back contact is essential for extracting holes from the p-type SnS absorber. A Schottky barrier at this interface can lead to significant series resistance and carrier accumulation. Figure 8 shows the dramatic impact of the back contact metal work function ($\phi_m$) on cell performance. When $\phi_m$ is low (e.g., 4.4 eV), a large Schottky barrier forms, causing severe band bending at the SnS/Mo interface that impedes hole transport. As $\phi_m$ increases, this barrier diminishes. For $\phi_m$ ≥ 5.1 eV, the contact becomes effectively ohmic, leading to optimal performance with efficiency stabilizing around 16.8%. This highlights that selecting a high-work-function metal or engineering the back interface (e.g., with a thin MoOx layer) is critical for high-performance SnS thin film solar panels.
Optimized Device Performance
After systematic optimization of the key parameters—SnS thickness (2.0 μm), SnS doping (1×1016 cm-3), TiO2 thickness (50 nm), and TiO2 doping (1×1017 cm-3)—the simulated current-density-voltage (J-V) characteristic under standard test conditions is shown in Figure 9. The optimized thin film solar panel exhibits the following performance parameters:
- Open-Circuit Voltage, VOC = 822.5 mV
- Short-Circuit Current Density, JSC = 31.56 mA/cm²
- Fill Factor, FF = 60.32 %
- Power Conversion Efficiency, η = 15.66 %
This simulated efficiency of 15.66% represents a substantial potential improvement over the current experimental record (4.8%), underscoring the significant opportunity for performance enhancement in SnS-based thin film solar panels through careful device engineering.
Conclusion
This comprehensive numerical simulation study provides a detailed theoretical framework for designing and optimizing high-efficiency SnS thin film solar panels employing a TiO2 buffer layer. The SCAPS-1D software was used to analyze the intricate effects of layer thicknesses, doping concentrations, operating temperature, and back contact properties. The key findings are:
- The optimal SnS absorber layer should be approximately 2.0 μm thick with an acceptor density of 1×1016 cm-3 to balance light absorption and carrier collection.
- The TiO2 buffer layer should be thin (~50 nm) and highly doped (~1×1017 cm-3) to minimize parasitic absorption and maximize the electric field for carrier extraction.
- The favorable band alignment (zero conduction band offset, large valence band offset) at the SnS/TiO2 interface is instrumental for efficient charge separation.
- The simulated device shows a temperature coefficient of -0.029 %/K, indicating acceptable thermal performance for a thin film solar panel.
- A high-work-function back contact (>5.1 eV) is essential to form an ohmic contact with the p-SnS layer and avoid performance-limiting Schottky barriers.
The optimized structure yields a simulated power conversion efficiency of 15.66%, demonstrating the considerable latent potential of the SnS/TiO2 heterojunction system. This work outlines a clear pathway for experimental efforts aimed at realizing high-performance, low-cost, and environmentally benign SnS-based thin film solar panels. Future work should focus on experimentally achieving the high-quality material properties assumed in this simulation, particularly regarding defect density control and interface engineering.