
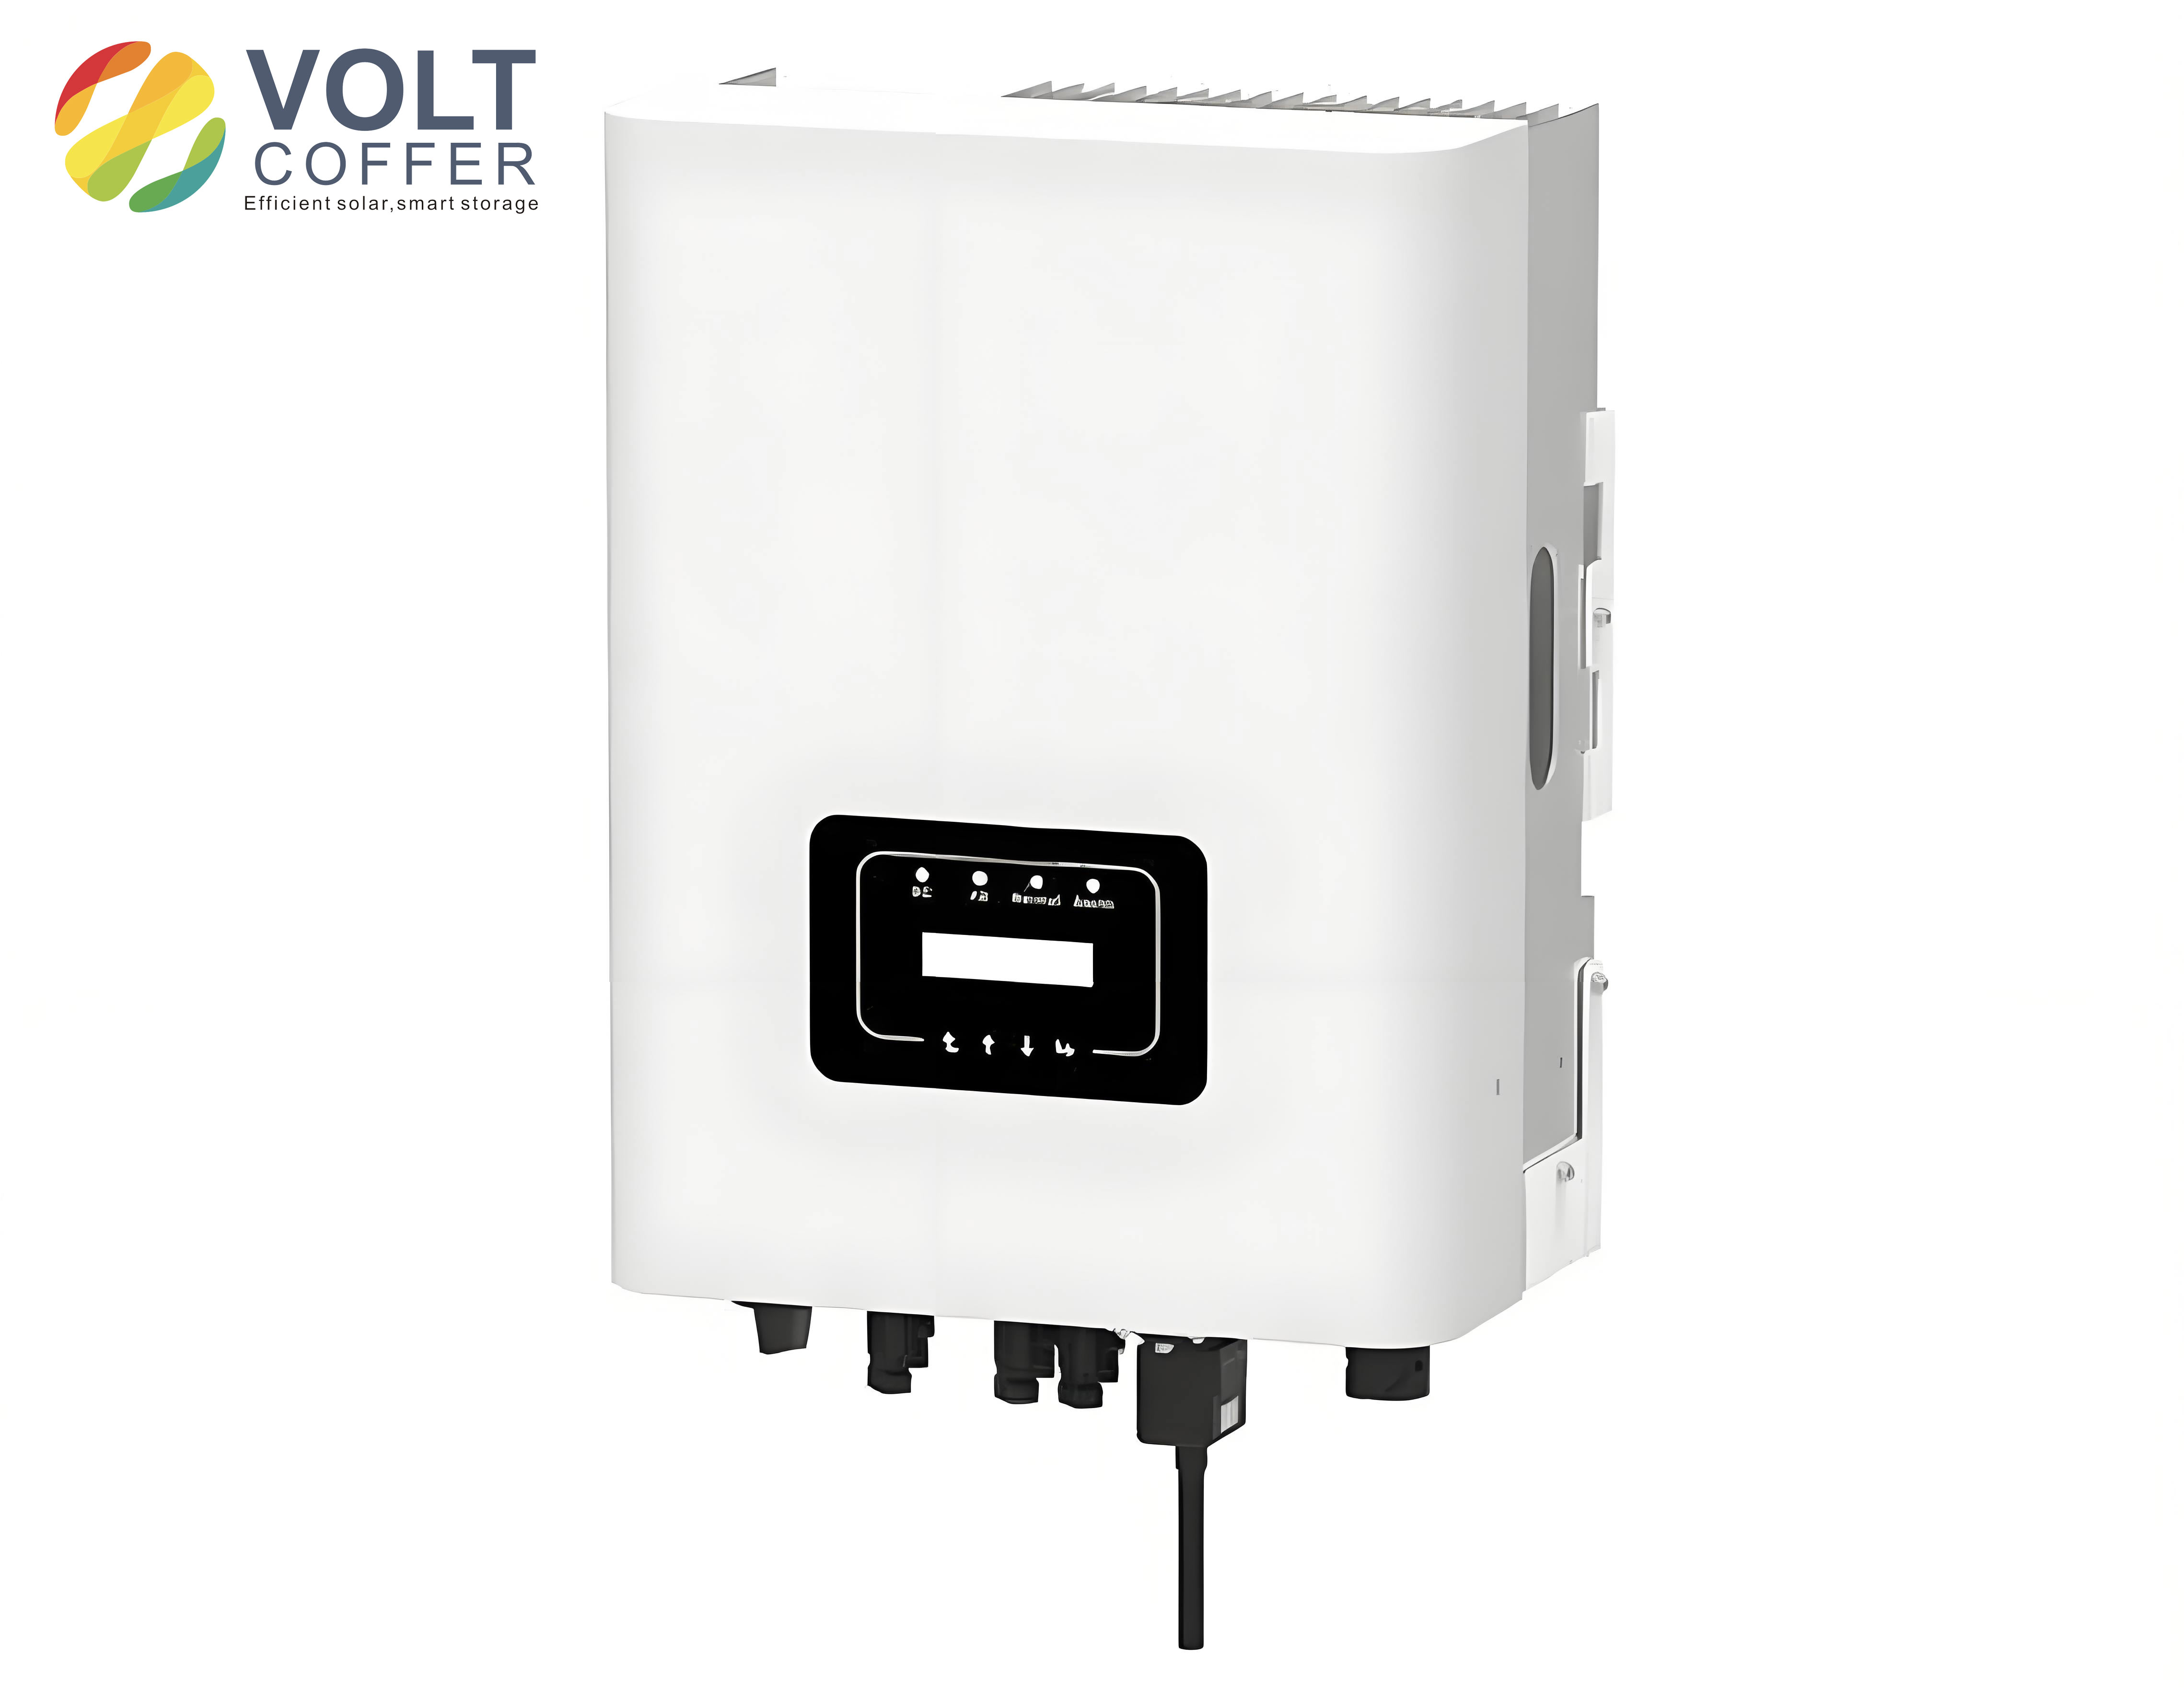
As global climate change intensifies and the supply of primary energy sources such as oil becomes increasingly strained, societies worldwide are actively promoting energy conservation and emission reduction. There is a strong advocacy for low-carbon and environmentally friendly practices, aiming to create a green and sustainable development model. Photovoltaic (PV) power generation, as a form of green renewable energy that effectively utilizes solar energy for clean electricity production, has received significant attention from national governments. While traditional solar inverters can convert solar power into renewable energy, their low conversion efficiency and simple operation typically restrict them to small-scale PV systems. In contrast, modern solar inverters integrate functionalities such as monitoring, diagnostics, and remote control, enabling real-time supervision and management of the entire PV system. The Maximum Power Point Tracking (MPPT) algorithm is the most core technology within a solar inverter. Its primary purpose is to ensure that the PV panels output their maximum possible power, thereby minimizing energy losses. In this study, I investigated the factors influencing the output capability of PV modules to explore the tracking capability of the inverter’s maximum power point. I then conducted an empirical analysis of the MPPT capability of a 10 kW string solar inverter from a specific manufacturer.
Introduction
With the launch and implementation of national action plans for the photovoltaic industry, the solar sector is experiencing rapid growth, integrating semiconductor technology with renewable energy to achieve the dual goals of peak carbon emissions by 2030 and carbon neutrality by 2060. The continuous technological advancement of solar inverter manufacturers has further improved the conversion efficiency and stability of PV modules, allowing for better grid integration. By 2022, global shipments of solar inverters reached 248.2 GW, representing an 18.0% increase year-over-year. The MPPT algorithm stands as one of the most critical metrics for evaluating the performance of a solar inverter. With innovations in MPPT algorithms, the hardware loop speed of solar inverters has increased, and processing speeds have accelerated. Consequently, the response time required from the PV simulator has also decreased. Similarly, the accuracy of the grid simulator on the AC output side of the inverter and its anti-islanding testing performance directly influence the final test results. This research is based on practical testing to examine the MPPT testing methods for string solar inverters, which are currently widely used.
Analysis of MPPT Testing Strategy for Solar Inverters
String solar inverters are highly regarded in both domestic and international markets due to their compact size, wide MPPT voltage range, and flexible module configuration options. Their efficiency is paramount, and the MPPT algorithm plays a central role. Once the MPPT algorithm in a solar inverter is not properly controlled, the output power can significantly decrease. The core mission of the Maximum Power Point Tracking in the inverter is to ensure the PV modules operate at their maximum power point. In this study, I used a PV array simulator to generate P-V data under different temperature and irradiance conditions to investigate their impact on the output performance of the PV modules.
The I-V curve test for PV modules aims to evaluate their performance and stability. By analyzing the I-V curve, one can determine the operating characteristics of a PV panel under various irradiance and temperature conditions, including key parameters like conversion efficiency and power output. This information is crucial for assessing PV module performance, exploring the precise control capability of the solar inverter, and diagnosing faults. This ensures maximum energy production and system reliability. In my experiments, I used a PV array simulator and consulted the specifications of a specific manufacturer’s solar inverter. I input the corresponding open-circuit voltage ($V_{oc}$), short-circuit current ($I_{sc}$), maximum input voltage ($V_{max}$), and maximum input current ($I_{max}$) into the simulator software. Besides these four parameters, the voltage-current relationship for other points on the curve was calculated using a theoretical formula. The I-V curve for the PV module from 0 V to $V_{oc}$ was then plotted. The formula used is as follows:
$$ V = \frac{V_{oc} \cdot \ln\left[2 – \left(\frac{I}{I_{sc}}\right)^n\right]}{\ln 2} – R_s \cdot (I – I_{sc}) \cdot \left(1 + \frac{R_s \cdot I_{sc}}{V_{oc}}\right) $$
In this formula, the typical value for the diode ideality factor $n$ is taken as 1024. I conducted simulation tests based on this formula to explore the characteristics of the PV module’s I-V curve.
To maximize the energy output of a photovoltaic system, it is known that the Maximum Power Point (MPP) of a PV module varies with changes in irradiance and temperature. The MPPT algorithm of the solar inverter monitors the voltage and current of the PV module in real-time to ensure it operates at the optimal MPP. Based on the theoretical results from my simulations, I used a PV array simulator in conjunction with a 10 kW string solar inverter from a specific manufacturer to obtain key parameters such as the static MPPT response time, MPPT efficiency, and the maximum power point under no-load conditions.
Study of MPPT Testing Methods for Solar Inverters
Influence of Irradiance and Temperature on MPPT
In my first test, I investigated the effect of irradiance on the MPPT by keeping the temperature constant at 25°C. Using the PV array simulator software and selecting a 10 kW solar inverter from a specific manufacturer as the test subject, I input different irradiance levels: 1000 W/m², 800 W/m², 600 W/m², and 400 W/m². Multiple sets of power-voltage data files were generated. By applying a curve-fitting technique, the resulting P-V curves for the PV module were obtained. The results are summarized in the table below:
| Irradiance (W/m²) | Temperature (°C) | Observed Trend of Maximum Power Point (MPP) | Observed Trend of MPPT Voltage |
|---|---|---|---|
| 1000 | 25 | Highest MPP (Reference) | Highest MPPT Voltage (Reference) |
| 800 | 25 | Decreases proportionally | Decreases slightly |
| 600 | 25 | Decreases proportionally | Decreases slightly further |
| 400 | 25 | Significant proportional decrease | Decreases noticeably |
Based on the data, as irradiance decreases, the maximum power point decreases significantly and proportionally, while the MPPT voltage also sees a slight reduction. Since the PV module outputs a DC signal, according to the electrical power formula $P = I \cdot U$, when irradiance falls, the power value decreases by a certain ratio, and consequently, the current also decreases by the same ratio.
In my second test, I investigated the effect of temperature on the MPPT by keeping the irradiance constant at 1000 W/m². Using the same PV array simulator and the 10 kW solar inverter, I input different temperature points: 25°C, 35°C, 45°C, and 55°C. Multiple power-voltage data files were generated, and the final P-V curves were obtained through fitting. The results are summarized in the table below:
| Temperature (°C) | Irradiance (W/m²) | Observed Trend of Maximum Power Point (MPP) | Observed Trend of MPPT Voltage |
|---|---|---|---|
| 25 | 1000 | Highest MPP (Reference) | Highest MPPT Voltage (Reference) |
| 35 | 1000 | Decreases non-linearly | Decreases non-linearly |
| 45 | 1000 | Decreases non-linearly further | Decreases non-linearly further |
| 55 | 1000 | Significant non-linear decrease | Significant non-linear decrease |
From this data, I concluded that when the temperature rises, the maximum power point decreases in a non-linear proportion, and the MPPT voltage also exhibits a non-linear decrease. This proves that irradiance and temperature are direct factors affecting the output power of PV modules, and their effects directly influence the MPPT performance. Therefore, in actual testing, the influence of these two parameters on the MPPT cannot be ignored. A decrease in irradiance reduces the output power of the PV module, and an increase in temperature also decreases the output power.
I-V Characteristic Relationship of PV Modules
The I-V characteristic curve is a key basis for evaluating the power generation performance of PV modules. Accurate voltage and current output can effectively improve power generation efficiency, achieving an optimal state. To study the current-voltage characteristics of a PV module, the parameters of irradiance and temperature should be kept constant. In this test, I set the irradiance constant at 1000 W/m² and the temperature constant at 25°C. Using the PV array simulator software and a 10 kW solar inverter from a specific manufacturer as the test subject, I input the parameters for the short-circuit point, open-circuit point, and maximum power point into the formula mentioned earlier. Using the software to fit the curve, the I-V curve of the PV module was obtained. The key parameters and their relationship are summarized in the table below:
| Parameter | Symbol | Value/State (Ideal Condition) |
|---|---|---|
| Short-Circuit Current | $I_{sc}$ | 23.3513 A (as measured) |
| Open-Circuit Voltage | $V_{oc}$ | 738.743 V (as measured) |
| Maximum Power Point (MPP) | $P_{max}$ | ~10004.09 W (as measured) |
| Voltage at MPP | $V_{mp}$ | ~530.046 V (as measured) |
| Current at MPP | $I_{mp}$ | ~18.8740 A (as measured) |
The I-V characteristic curve of the PV module in a normal state is smooth and consists of three main parts: a relatively horizontal section, an arc-shaped “knee” section, and a relatively vertical section. The simulated curve I generated was based on the ideal formula. If the curve appears abnormal during the actual testing of PV modules, possible reasons include: PV module contamination, shading from objects, module aging or damage, non-uniform temperature and irradiance, and a solar inverter malfunction or poor MPPT algorithm. After eliminating external factors, consideration should be given to optimizing the MPPT algorithm of the solar inverter itself.
Empirical Test Results
According to the EN50530 standard, beyond external environmental factors like irradiance and temperature, the materials and components of the PV panel also determine its photoelectric conversion efficiency. The metric used to evaluate the quality of a PV module’s characteristics is called the Fill Factor (FF). In this test, I set the FF of the PV panel to 0.8. The external conditions were set as constant: a temperature of 25°C, an irradiance of 1000 W/m², and parameters for the inverter’s open-circuit point, short-circuit point, and maximum power point were input. The specific test conditions are outlined in the table below:
| Parameter | Setting Value |
|---|---|
| Temperature | 25°C |
| Irradiance | 1000 W/m² |
| Fill Factor (FF) | 0.8 |
| Open-Circuit Voltage ($V_{oc}$) | 738.743 V |
| Short-Circuit Current ($I_{sc}$) | 23.3513 A |
| Voltage at Max Power ($V_{mp}$) | 530.046 V |
| Current at Max Power ($I_{mp}$) | 18.8740 A |
After setting these conditions, the PV array simulator generated a P-V curve and an I-V curve based on the input parameters. The purpose of this was to test the tracking capability of the string solar inverter for this specific MPPT efficiency point. The results of the MPPT tracking by the solar inverter are summarized in the table below:
| Measured Parameter | Value |
|---|---|
| Maximum Power Point (MPP) tracked by the inverter | 10004.99 W |
| Current output power of the inverter | 10000.23 W |
| MPPT Efficiency | 99.9614 % |
| Voltage at MPP ($V_{mp}$) tracked | 535.823 V |
| Current at MPP ($I_{mp}$) tracked | 18.6633 A |
Results indicate that the 10 kW solar inverter from the specific manufacturer successfully tracked a MPP value of 10004.99 W, with a current output power of 10000.23 W, yielding an MPPT efficiency of 99.9614%.
The test described above assessed the static MPPT efficiency of the solar inverter as defined in the standard. However, it does not directly visualize the timing relationship of the MPPT process. To observe this, an oscilloscope or the built-in oscilloscope function of some PV array simulators is necessary. This allows for the observation of the dynamic relationship of voltage, current, and power over time, from a starting point (e.g., 0) to the MPP. The key performance metrics from such a dynamic observation are listed in the table below:
| Dynamic Performance Metric | Description |
|---|---|
| MPPT Response Time | Time taken to stabilize at the new MPP after a change in external conditions. |
| Voltage Tracking Trend | How the module voltage changes during the transition to the new MPP. |
| Current Tracking Trend | How the module current changes during the transition. |
| Power Tracking Trend | How the output power stabilizes at the new MPP value. |
Through such a timing diagram, one can dynamically observe the tracking state of voltage, current, and power over time when the external environment changes.
Conclusion
In this study, I investigated the MPPT testing methods for string solar inverters. The main conclusions are as follows:
First, as the irradiance decreases, the maximum power point decreases proportionally, and the MPPT voltage also shows a certain degree of decrease. Conversely, when the temperature rises, the maximum power point decreases in a non-linear proportion, and the MPPT voltage also exhibits a non-linear decrease.
Second, the I-V characteristic curve of a PV module, under ideal conditions, should be a smooth curve composed of three parts: a relatively horizontal section, an arc-like knee section, and a relatively vertical section. If the PV module is subject to shading or dust, the curve can become distorted.
Third, through empirical testing, I successfully analyzed the MPPT capability of a specific manufacturer’s solar inverter, including its MPPT efficiency and the dynamic timing relationship of the MPPT process.