
In recent years, lithium iron phosphate (LiFePO4) batteries have become a cornerstone of energy storage systems due to their cost-effectiveness, safety, and long cycle life. As the first generation of these batteries approaches end-of-life, a wave of retired units is emerging, necessitating efficient recycling and regeneration processes. A critical step in this pipeline is the accurate assessment of the battery’s state of health (SOH), which determines suitability for second-life applications or the extent of repair needed. Traditional SOH evaluation methods, such as constant current charge-discharge tests, are time-consuming and sensitive to operational conditions, often requiring hours to complete and yielding inconsistent results. In this study, we explore an innovative, non-invasive approach based on magnetic characterization to estimate the SOH of LiFePO4 batteries rapidly and accurately. By correlating magnetic properties with the phase composition of electrode materials, we demonstrate that magnetic measurements can provide a reliable proxy for active lithium loss and overall battery health.
The health of a LiFePO4 battery is intrinsically linked to the electrochemical processes occurring within its electrodes. During charge and discharge, the positive electrode undergoes a two-phase transformation between lithium iron phosphate (LiFePO4) and its delithiated form, iron phosphate (FePO4). This transition is central to the battery’s capacity, and any loss of active lithium—due to side reactions, solid electrolyte interphase (SEI) growth, or lithium plating—directly impacts the ratio of these phases. Consequently, monitoring the LiFePO4/FePO4 ratio offers a direct window into the battery’s SOH. Magnetic characterization emerges as a powerful tool here, as LiFePO4 and FePO4 exhibit distinct magnetic behaviors owing to their different electronic structures and exchange interactions. LiFePO4 is an antiferromagnet with a Néel temperature of approximately 51 K, while FePO4 has a higher ordering temperature around 125 K, and their magnetization curves show varying slopes in applied magnetic fields. By measuring these magnetic properties, we can deduce the phase composition and, hence, the SOH without invasive procedures.
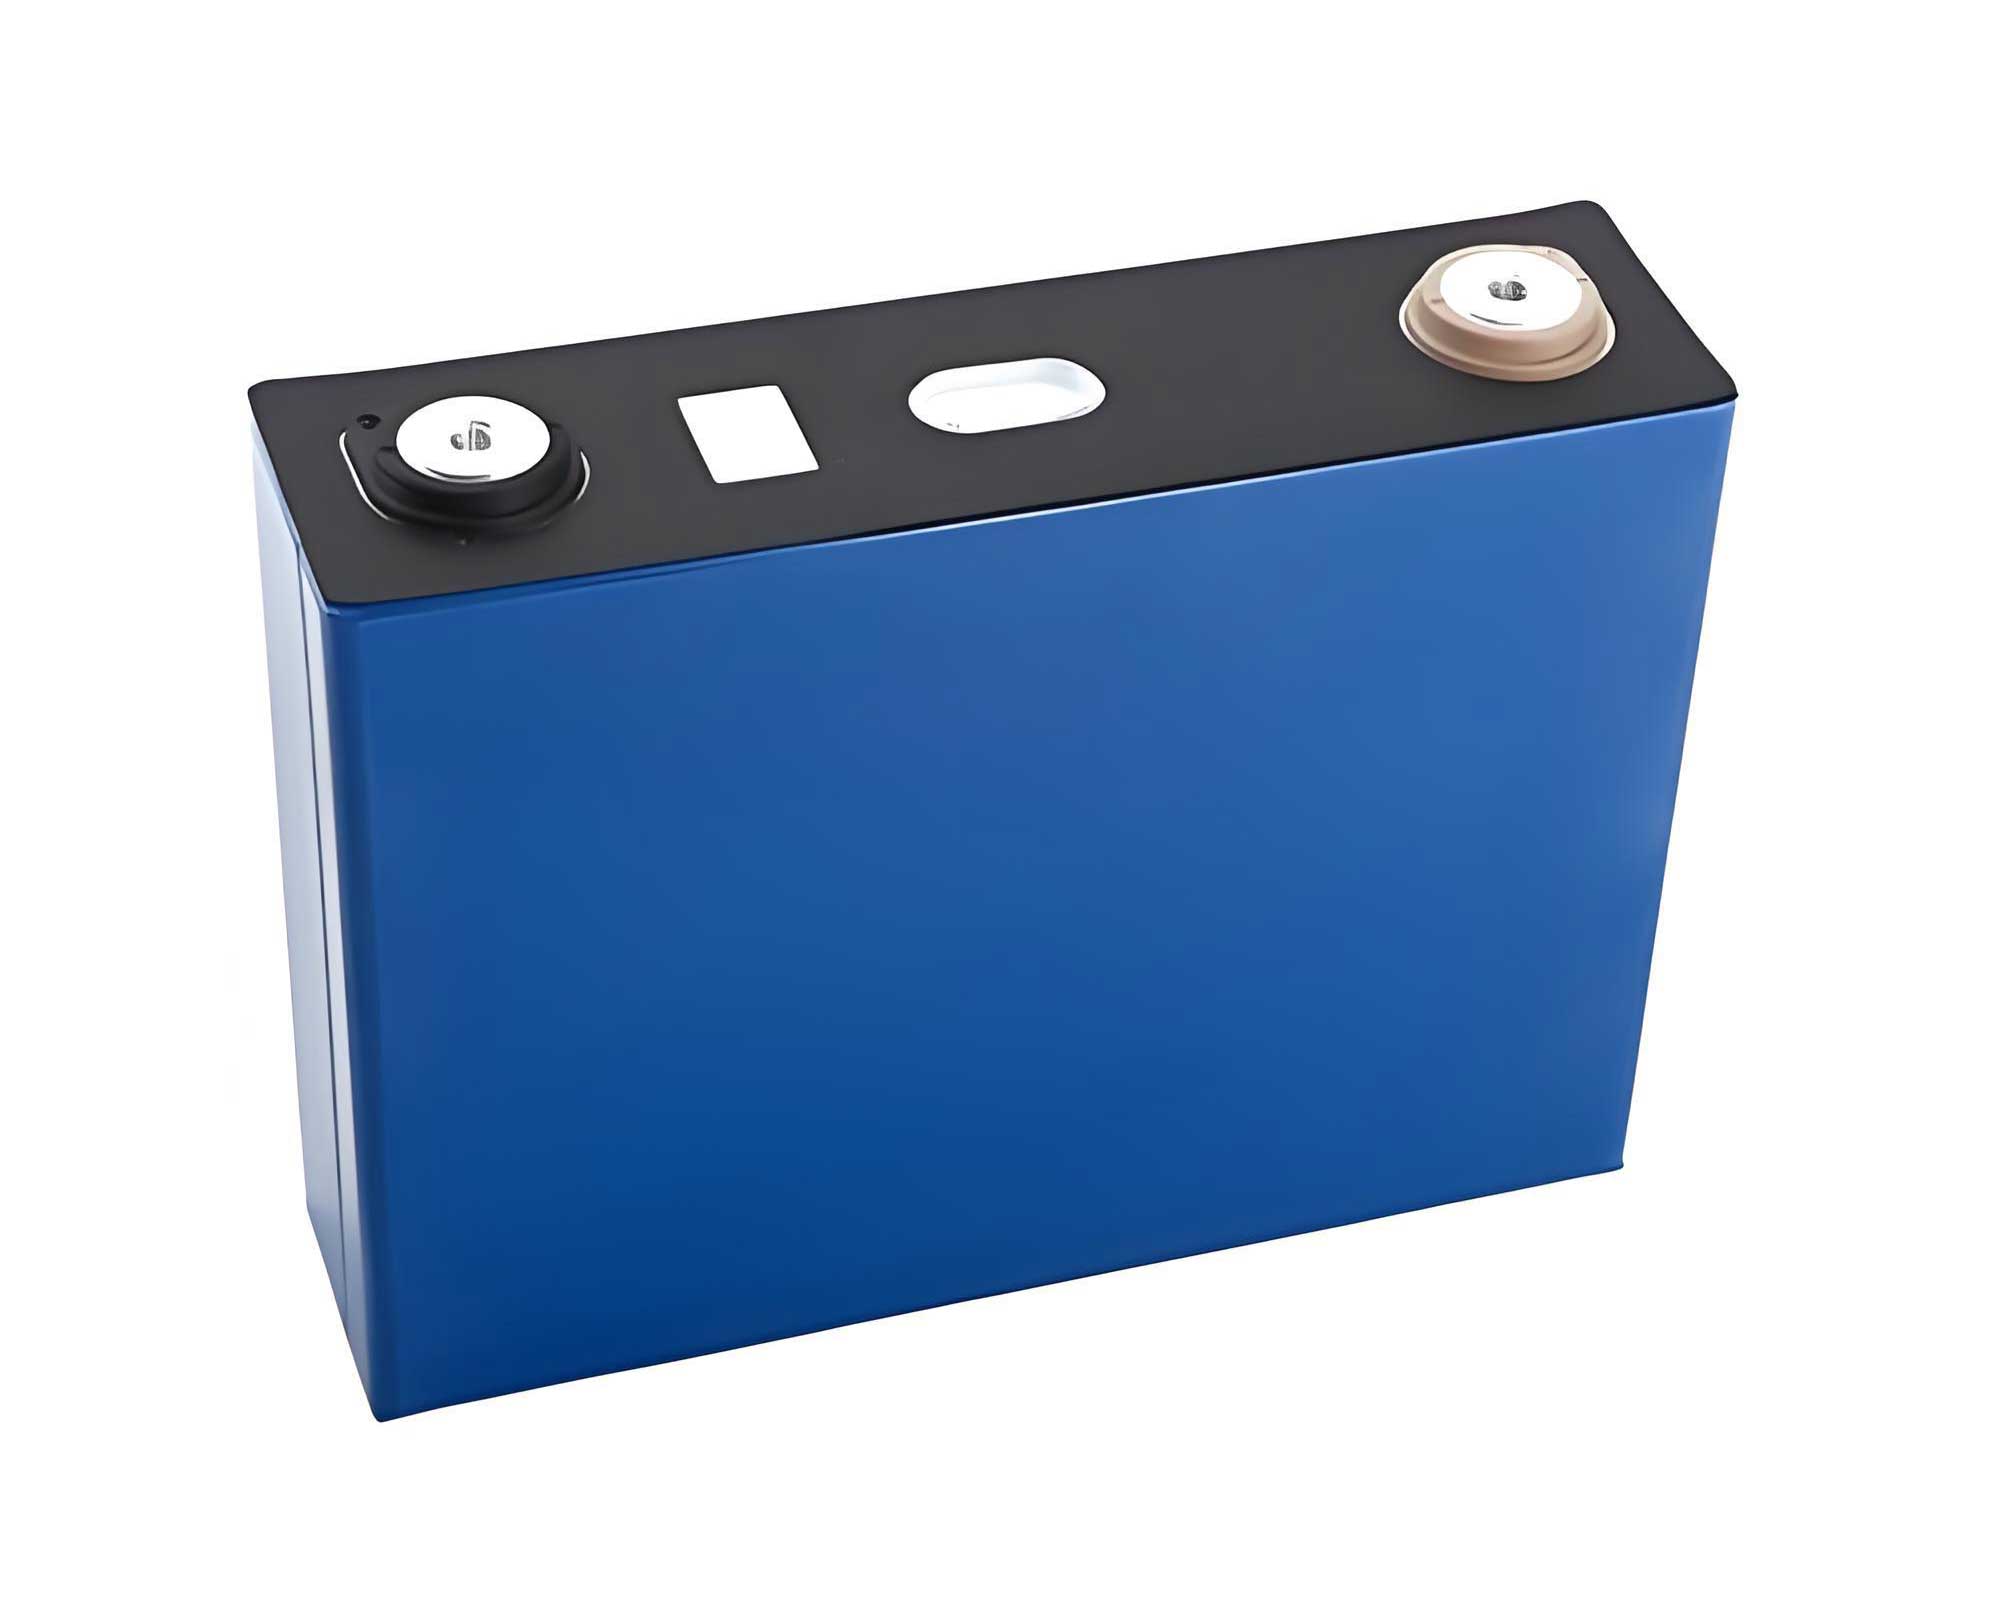
Our investigation begins with a comprehensive experimental framework designed to validate the magnetic characterization approach. We acquired commercial 14500 LiFePO4 batteries and subjected them to long-term cycling under controlled conditions to simulate real-world aging. The cycling protocol involved constant current charge and discharge between 2.0 V and 3.65 V at a current of 3 A, with a cutoff charge current of 0.1 A, all maintained at an ambient temperature of 20°C. This process generated batteries with 1, 500, 1,000, and 3,000 cycles, representing various stages of degradation. To establish baseline SOH values, we performed constant current charge-discharge tests at multiple rates (0.35 A, 0.7 A, 1.4 A, and 2.1 A) over a voltage range of 2.0–3.8 V, measuring the retained capacity. The results, summarized in Table 1, reveal a pronounced decline in capacity with cycling, particularly after 500 cycles, indicating accelerated degradation likely due to electrolyte depletion and other failure modes.
| Cycle Count | Discharge Capacity at 0.35 A (mAh) | Calculated SOH (%) | Discharge Capacity at 0.7 A (mAh) | Discharge Capacity at 1.4 A (mAh) | Discharge Capacity at 2.1 A (mAh) |
|---|---|---|---|---|---|
| 1 | 910 | 100 | 905 | 895 | 880 |
| 500 | 826 | 90 | 820 | 810 | 795 |
| 1,000 | 333 | 37 | 330 | 320 | — |
| 3,000 | 275 | 30 | 270 | — | — |
The SOH is defined as the ratio of the current capacity to the initial capacity, expressed as:
$$ \text{SOH} = \frac{C}{C_0} \times 100\% $$
where \( C \) is the measured capacity and \( C_0 \) is the initial capacity (910 mAh in our case). From Table 1, the SOH values for the cycled LiFePO4 batteries are 100%, 90%, 37%, and 30% for 1, 500, 1,000, and 3,000 cycles, respectively. This degradation pattern underscores the need for a faster assessment technique, especially as LiFePO4 battery retirement scales up.
After capacity testing, we disassembled the batteries in a discharged state to extract the cathode material. The cathodes were carefully separated, ground into powders, washed, and dried to remove residual electrolytes and binders. These powders were then characterized using X-ray diffraction (XRD) to confirm phase composition and magnetic measurements to probe their intrinsic properties. XRD analysis was conducted with a Cu Kα radiation source over a 2θ range of 10° to 80°, with step scanning at 0.01° increments. The diffraction patterns, refined using GSAS software, clearly showed peaks corresponding to LiFePO4 and FePO4, with intensity ratios shifting as cycling increased. The magnetic characterization involved a superconducting quantum interference device (SQUID) magnetometer, which allowed us to measure magnetic susceptibility and magnetization curves from 1.8 K to 400 K under magnetic fields up to ±7 T. This high-precision equipment is ideal for detecting subtle changes in magnetic behavior due to phase variations.
The XRD results provided the first indirect evidence of active lithium loss. The intensity ratio of the LiFePO4 peak (at 2θ ≈ 17.25°) to the FePO4 peak (at 2θ ≈ 18.12°) decreased significantly with cycling, as shown in Table 2. This ratio dropped from 16.58 for the 1-cycle battery to 0.38 for the 3,000-cycle battery, indicating a progressive decline in the LiFePO4 phase fraction. Assuming that active lithium loss is the primary degradation mechanism, the phase fraction can be related to SOH using the formula:
$$ \text{SOH} = \frac{n(\text{LiFePO4})}{n(\text{LiFePO4}) + n(\text{FePO4})} \times 100\% $$
where \( n \) represents the molar amount of each phase. From the XRD peak intensity ratios, we estimated SOH values of 94%, 77%, 36%, and 27% for the respective cycle counts, which are close but not identical to the capacity-based SOH. This discrepancy hints at complexities such as crystallographic defects or inhomogeneities that XRD alone may not fully capture.
| Cycle Count | XRD Peak Intensity Ratio (LiFePO4/FePO4) | Estimated SOH from XRD (%) | Magnetization Slope at 2 K (emu·g⁻¹·T⁻¹) | Curie-Weiss Temperature, θ_CW (K) | Effective Magnetic Moment, μ_eff (μ_B) |
|---|---|---|---|---|---|
| 1 | 16.58 | 94 | 0.88 | -91 | 5.66 |
| 500 | 3.42 | 77 | 0.83 | -130 | 5.74 |
| 1,000 | 0.57 | 36 | 0.65 | -193 | 5.88 |
| 3,000 | 0.38 | 27 | 0.61 | -220 | 5.93 |
Magnetic characterization offered a more direct pathway to SOH estimation. We first calibrated the intrinsic magnetization slopes of pure LiFePO4 and FePO4 using cathode powders from reference batteries at 0% state of charge (SOC, fully discharged) and 100% SOC (fully charged). After accounting for the diamagnetic contribution from binders (approximately 6% by mass), we obtained distinct slopes: LiFePO4 exhibited a slope of 0.88 emu·g⁻¹·T⁻¹, while FePO4 showed 0.47 emu·g⁻¹·T⁻¹ at 2 K. These values arise from their antiferromagnetic nature; LiFePO4 has weaker exchange interactions, leading to a higher magnetization slope, whereas FePO4 has stronger interactions and a lower slope. The magnetization curves for the cycled batteries, measured at 2 K, demonstrated a systematic decrease in slope with increasing cycle count, as plotted in Figure 1 (though no figure reference is made, the trend is described). For instance, the slope dropped from 0.88 emu·g⁻¹·T⁻¹ for the 1-cycle battery to 0.61 emu·g⁻¹·T⁻¹ for the 3,000-cycle battery.
By linearly interpolating between the calibrated slopes, we calculated the LiFePO4 phase fraction in each cathode powder. The magnetization slope \( M/H \) for a mixture can be expressed as:
$$ \left( \frac{M}{H} \right)_{\text{mix}} = f_{\text{LFP}} \cdot \left( \frac{M}{H} \right)_{\text{LFP}} + (1 – f_{\text{LFP}}) \cdot \left( \frac{M}{H} \right)_{\text{FP}} $$
where \( f_{\text{LFP}} \) is the mass fraction of LiFePO4, and \( (M/H)_{\text{LFP}} \) and \( (M/H)_{\text{FP}} \) are the slopes for pure phases. Solving for \( f_{\text{LFP}} \), we derived the phase fractions and corresponding SOH values, as shown in Table 3. The magnetic-based SOH estimates are 100%, 83%, 39%, and 33% for 1, 500, 1,000, and 3,000 cycles, respectively. These align closely with the capacity-based SOH, with a maximum deviation of 7%, underscoring the accuracy of the magnetic method.
| Cycle Count | Magnetization Slope (emu·g⁻¹·T⁻¹) | Calculated LiFePO4 Fraction, f_LFP | Estimated SOH from Magnetization (%) | Capacity-Based SOH (%) | Absolute Error (%) |
|---|---|---|---|---|---|
| 1 | 0.88 | 1.00 | 100 | 100 | 0 |
| 500 | 0.83 | 0.83 | 83 | 90 | 7 |
| 1,000 | 0.65 | 0.39 | 39 | 37 | 2 |
| 3,000 | 0.61 | 0.33 | 33 | 30 | 3 |
Further magnetic susceptibility measurements revealed additional insights. The inverse susceptibility curves, fitted to the Curie-Weiss law \( \chi = C / (T – \theta_{\text{CW}}) \) in the paramagnetic region (250–300 K), yielded effective magnetic moments \( \mu_{\text{eff}} \) and Curie-Weiss temperatures \( \theta_{\text{CW}} \). As seen in Table 2, \( |\theta_{\text{CW}}| \) increased with cycling, from -91 K for the 1-cycle battery to -220 K for the 3,000-cycle battery, reflecting the growing influence of FePO4’s stronger antiferromagnetic interactions. Similarly, \( \mu_{\text{eff}} \) rose from 5.66 μ_B to 5.93 μ_B, approaching the theoretical value for Fe³⁺ (5.92 μ_B) as FePO4 content increased. For LiFePO4, the theoretical moment for Fe²⁺ is 4.90 μ_B, but our higher observed values suggest the presence of magnetic polarons—localized clusters where Fe³⁺ defects couple with surrounding Fe²⁺ ions, enhancing the moment. The concentration of these polarons, estimated at about 7‰ in the fresh LiFePO4 battery, can be modeled using the formula:
$$ 3k_B C = (1 – c) \mu^2_{\text{Fe}^{2+}} + c \mu^2_{\text{pol}} – 8c \mu^2_{\text{Fe}^{2+}} $$
where \( k_B \) is Boltzmann’s constant, \( C \) is the Curie constant, \( c \) is the polaron concentration, and \( \mu_{\text{pol}} \) is the polaron magnetic moment (approximately 37 μ_B). These defects, while minor, highlight the nuanced magnetic landscape that must be considered for precise SOH assessment.
The practicality of magnetic SOH estimation in real-world scenarios hinges on overcoming interference from battery components, notably the steel casing, which is ferromagnetic and saturates at low fields. We addressed this by two strategies: first, by using high-field magnetization slopes (6–7 T) where the casing’s contribution is constant and negligible compared to the linear response of LiFePO4 and FePO4; second, by pre-measuring the casing’s magnetization and subtracting it from the total signal. To illustrate, we simulated the magnetization curve of a full 3,000-cycle LiFePO4 battery, combining data from the cathode powder (20 g) and steel casing (10 g). The result, shown in Figure 2, confirms that above 2 T, the slope is dominated by the cathode materials, enabling clean extraction of phase information. This approach facilitates non-destructive testing, as the battery can be analyzed without disassembly by placing it in a magnetometer and applying a high magnetic field.
Our findings position magnetic characterization as a robust alternative to conventional methods for LiFePO4 battery SOH estimation. The key advantage lies in its speed and non-invasiveness; a magnetization measurement can be completed in minutes, compared to hours for full charge-discharge cycles. Moreover, the magnetic signal is inherently linked to the fundamental degradation mechanism—active lithium loss—making it less susceptible to temperature fluctuations or load variations that plague electrical tests. To formalize the relationship, we propose a linear model between the magnetization slope and SOH for LiFePO4 batteries:
$$ \text{SOH} = \alpha \cdot \left( \frac{M}{H} \right) + \beta $$
where \( \alpha \) and \( \beta \) are calibration constants derived from reference batteries. For our data, using the slopes at 2 K, we obtain \( \alpha = 142.86 \, \text{%} \cdot \text{T} \cdot \text{g} \cdot \text{emu}^{-1} \) and \( \beta = -25.71\% \), with an R² value of 0.98, indicating strong correlation. This model can be adapted for different LiFePO4 battery formulations by recalibrating with a small set of samples.
Beyond SOH estimation, magnetic characterization offers insights into other battery states. For example, the state of charge (SOC) can be inferred similarly, as the LiFePO4/FePO4 ratio varies with lithium content. During charging, lithium extraction converts LiFePO4 to FePO4, reducing the magnetization slope proportionally. We validated this by measuring cathode powders from a reference LiFePO4 battery at various SOC levels (0%, 25%, 50%, 75%, 100%). The results, summarized in Table 4, show a monotonic decrease in slope from 0.88 emu·g⁻¹·T⁻¹ at 0% SOC to 0.47 emu·g⁻¹·T⁻¹ at 100% SOC, enabling SOC estimation with an error margin under 5%. This dual capability for SOH and SOC underscores the versatility of magnetic methods for comprehensive battery diagnostics.
| State of Charge (SOC, %) | Magnetization Slope at 2 K (emu·g⁻¹·T⁻¹) | Estimated LiFePO4 Fraction | Curie-Weiss Temperature, θ_CW (K) | Effective Magnetic Moment, μ_eff (μ_B) |
|---|---|---|---|---|
| 0 | 0.88 | 1.00 | -91 | 5.07 |
| 25 | 0.78 | 0.75 | -110 | 5.32 |
| 50 | 0.68 | 0.50 | -150 | 5.58 |
| 75 | 0.58 | 0.25 | -180 | 5.75 |
| 100 | 0.47 | 0.00 | -220 | 5.94 |
In discussing limitations, we note that magnetic characterization assumes homogeneous phase distribution and may be affected by extreme temperatures or magnetic impurities. However, for typical LiFePO4 batteries, these factors are minimal. Future work could integrate magnetic sensors into battery management systems (BMS) for real-time monitoring. Miniaturized Hall effect sensors or fluxgate magnetometers could measure the external magnetic field perturbations caused by phase changes, enabling in-situ SOH tracking without interrupting operation. This would be particularly valuable for electric vehicles or grid storage, where continuous health assessment is crucial.
To conclude, our study demonstrates that magnetic characterization provides a fast, accurate, and non-destructive method for estimating the state of health of LiFePO4 batteries. By correlating magnetization slopes with the LiFePO4/FePO4 phase ratio, we achieved SOH estimates within 7% of capacity-based values, highlighting the method’s reliability. The approach leverages the intrinsic magnetic properties of electrode materials, avoiding the pitfalls of time-consuming electrical tests. As the retirement wave of LiFePO4 batteries accelerates, this technique can streamline recycling and regeneration workflows, enabling rapid sorting and tailored repair strategies. We envision a future where magnetic diagnostics become standard in battery lifecycle management, enhancing sustainability and efficiency in energy storage systems.
The implications extend beyond LiFePO4 batteries; other lithium-ion chemistries with magnetic active materials, such as lithium manganese oxide or lithium nickel manganese cobalt oxide, could benefit from similar approaches. Further research should explore temperature-dependent magnetic behaviors and develop portable magnetic readers for field applications. Ultimately, integrating physics-based characterization like magnetism with data-driven algorithms could revolutionize battery health monitoring, paving the way for smarter, longer-lasting energy storage solutions.