

1. Introduction
1.1 The Significance of Lithium-Iron Battery in Energy Storage
In the pursuit of carbon peaking and carbon neutrality goals, the development of renewable energy sources such as wind and solar power has become a global trend. However, the intermittent and fluctuating nature of these energy sources necessitates the deployment of energy storage systems to ensure the stable and reliable operation of the power grid. Lithium-ion battery, with their high energy density, long cycle life, and relatively low self-discharge rate, have emerged as a leading energy storage technology. Among them, lithium-iron phosphate (LiFePO₄) battery, in particular, have gained significant attention due to their enhanced safety characteristics compared to other lithium-ion chemistries. The LiFePO₄ battery market has witnessed remarkable growth in recent years, with a substantial increase in installed capacity. In 2023, the installed capacity of lithium-ion battery reached 43 GW, representing a growth of over 150% compared to 2022 and accounting for more than 97% of the new energy storage installations. This rapid expansion underscores the crucial role of LiFePO₄ battery in the energy transition.
1.2 Thermal Runaway Hazards in LiFePO₄ Battery
Despite their numerous advantages, LiFePO₄ battery are not without risks. Under certain abuse conditions, such as overheating, overcharging, or mechanical damage, these battery can undergo thermal runaway. Thermal runaway is a catastrophic event characterized by a self-sustaining and uncontrollable increase in temperature within the battery. This process triggers a series of exothermic reactions that release large amounts of heat, combustible gases, and smoke. The internal pressure within the battery rises rapidly, leading to the deformation and rupture of the battery casing. The ejected electrolyte can vaporize and mix with the surrounding air, forming a potentially explosive mixture. The combustible gases, including hydrogen (H₂), carbon monoxide (CO), and volatile organic compounds (VOCs), can ignite spontaneously or upon exposure to an ignition source, resulting in fires and explosions. The consequences of such incidents can be devastating, not only causing damage to the energy storage system itself but also posing a significant threat to the safety of personnel and the surrounding environment.
1.3 The Role of Sensors in Thermal Runaway Monitoring
To mitigate the risks associated with thermal runaway in LiFePO₄ battery, the use of sensors for real-time monitoring has become a crucial preventive measure. Sensors can detect the early signs of thermal runaway by monitoring key parameters such as gas concentrations, smoke density, temperature, and pressure. By providing timely warnings, these sensors enable proactive measures to be taken to prevent the escalation of the event and minimize potential damage. The selection of appropriate sensors and the development of effective detection strategies are essential for ensuring the safety and reliability of lithium-iron battery energy storage systems. This article focuses on evaluating the effectiveness of different types of sensors in detecting thermal runaway in LiFePO₄ battery and proposes optimized detection strategies based on experimental results.
2. Experimental Setup
2.1 Sensor Design and Specifications
In this study, five types of multi-in-one composite sensors were designed and fabricated, each incorporating sensors based on different detection principles. The sensors were designed to measure a range of parameters including the volume fractions of H₂, CO, CO₂, and VOCs, the mass fraction of smoke, as well as the temperature and pressure within the battery compartment. The detailed specifications of the sensors are presented in the following table:
| Sensor | Detection Principle | Measurement Range | Sensitivity | Accuracy | Lifespan |
|---|---|---|---|---|---|
| H₂ Sensor (Electrochemical) | Electrochemical reaction | 0 – 2000 ppm | 0.01 – 0.005 A/10 ppm | ≤ ±3% FS | 2 years |
| H₂ Sensor (Semiconductor) | Change in semiconductor resistance | 0 – 2000 ppm | Resistance ratio > 5 (in air vs. 10 ppm H₂) | ≤ ±5% | 10 years |
| H₂ Sensor (Catalytic Combustion) | Combustion heat release | 0 – 2000 ppm | 0.4 – 0.2 nA/10 ppm | ≤ ±5% | 10 years |
| VOC Sensor (Solid Polymer Electrochemical) | Electrochemical catalytic reaction | 0 – 1000 ppm | 35 ± 15 nA/10 ppm | ≤ ±3% FS | 3 years |
| VOC Sensor (Photoionization) | Photoionization of gas molecules | 0 – 10000 ppm | > 0.1 mV/10 ppm | ≤ ±2% | 2 years |
| CO Sensor (Electrochemical) | Electrochemical reaction | 0 – 1000 ppm | 45 ± 15 nA/10 ppm | ≤ ±3% FS | 2 years |
| CO₂ Sensor (Infrared Optical) | Absorption of infrared light | 0 – 5000 ppm | 0.32 ± 0.04 mV/10 ppm | ≤ ±5% | 3 years |
| Temperature Sensor (Thermocouple) | Seebeck effect | -125°C – 125°C | 11 ± 0.3 mV/°C | ≤ ±3% | 15 years |
| Smoke Sensor (Semiconductor) | Change in semiconductor resistance | 0 – 10000 mg/m³ | Resistance ratio > 5 (in air vs. 20 ppm CH₄) | ≤ ±5% | 10 years |
| Pressure Sensor (Piezoresistive) | Change in resistance with pressure | 0 – 110 kPa | 0.0345 ± 0.0021 A/Pa | ≤ ±5% | 10 years |
2.2 Experimental Apparatus and Battery Specifications
The experiments were conducted in a 40-foot real-scale energy storage battery fire simulation chamber. The chamber was designed to replicate the actual operating conditions of an energy storage system, with features such as sealed doors to ensure the integrity of the test environment. The LiFePO₄ battery used in the experiments were 280 Ah storage battery with dimensions of 204.6 mm × 173.7 mm × 71.7 mm and a rated voltage of 3.2 V. Before the experiments, the battery were fully charged using a constant current-constant voltage charging method. The charging process involved charging the battery at a constant current of 1 C (280 A) until the voltage reached 3.65 V, followed by a constant voltage charge at 3.65 V until the current dropped below 14 A, ensuring a state of charge (SOC) of 100%.
2.3 Experimental Procedure
The experimental setup involved the installation of five sets of composite sensors at different locations within the battery compartment. The sensors were evenly spaced at intervals of 2.4 m to monitor the thermal runaway parameters at various positions. Two typical thermal runaway locations were selected for the experiments, namely the edge and the middle of the storage compartment. To induce thermal runaway, a heating plate with a power of 950 W was attached to the battery surface using high-temperature tape. The temperature of the battery surface was continuously monitored using thermocouples, and the sampling interval was set at 1 s. The composite sensors recorded the thermal runaway parameters at a sampling frequency of 1 Hz, while a Sony camera was used to capture the entire thermal runaway process at a frame rate of 25 frames per second. The experiment was considered to have reached thermal runaway when the temperature of the battery surface exceeded 150°C or the temperature rise rate exceeded 1°C/s. In some experiments, an electronic igniter with an ignition energy of 20 J and a frequency of 5 Hz was used to simulate the effect of ignition on the thermal runaway process.
3. Experimental Results and Analysis
3.1 Thermal Runaway Parameter Evolution under Heating
3.1.1 Parameter Changes in Different Stages
The thermal runaway process of the LiFePO₄ battery can be divided into three distinct stages based on the changes in key parameters. In the initial stage (Stage I), the heating of the battery leads to a gradual increase in temperature. At around 320 s, the internal solid electrolyte interface (SEI) layer begins to decompose, resulting in the release of CO₂ gas. As the SEI layer decomposition progresses, the reaction between the negative electrode and the electrolyte intensifies, leading to an increase in internal pressure. The first signs of VOCs were detected at approximately 750 s, with the concentration gradually rising.
In Stage II, which begins when the internal pressure exceeds the safety threshold (around 1089 s), the safety valve opens, releasing a large amount of combustible gas and electrolyte vapor. This event is accompanied by a sudden drop in temperature due to the heat carried away by the ejected substances. The catalytic combustion H₂ sensor and the photoionization VOC sensor exhibited the earliest response to the gas release, detecting H₂ and VOCs, respectively. Visible smoke was observed to spread within the compartment, with a portion rising to the top and the other settling at the bottom.
Stage III is characterized by a rapid increase in temperature and the concentrations of various gases and smoke. The battery diaphragm melts, releasing a significant amount of Joule heat, which further accelerates the thermal runaway reaction. The concentrations of H₂, smoke, VOCs, and CO all rise sharply, while the CO₂ concentration shows a relatively delayed increase. The visible smoke fills the entire compartment, obstructing the view of the camera.
3.1.2 Comparison of Sensor Response Times
The response times of different sensors play a crucial role in the early detection of thermal runaway. The results indicate that the photoionization VOC sensor detected VOCs approximately 600 s earlier than the electrochemical VOC sensor. Among the H₂ sensors, the catalytic combustion sensor detected H₂ about 100 s earlier than the electrochemical and semiconductor sensors. Overall, the VOC sensor was the first to detect the signs of thermal runaway, even before the battery reached the critical thermal runaway stage. This early detection can provide valuable time for implementing preventive measures.
3.2 Comparison of Thermal Runaway Parameters with and without Ignition
3.2.1 Impact of Ignition on Gas Concentrations
Experiments were conducted to compare the thermal runaway parameters with and without ignition. The results show that ignition has a significant impact on the concentrations of various gases. In the case of ignition, the concentrations of CO, smoke, and CO₂ increased substantially compared to the non-ignition scenario. The peak concentration of CO in the ignition experiment was more than 1000 ppm, while in the non-ignition experiment, it was 684 ppm. The concentration of smoke also increased significantly, reaching a mass fraction of over 10000 mg/m³ in the ignition case compared to 4801 mg/m³ without ignition. In contrast, the concentrations of H₂ and VOCs decreased to varying degrees upon ignition. This is attributed to the combustion of the electrolyte and other substances, which reduces the amount of unburned gases available for detection.
3.2.2 Temperature Changes and Their Implications
The temperature evolution also differed significantly between the two scenarios. In the non-ignition experiment, the temperature change rate was relatively slow, with a maximum rate of 0.10°C/min. However, in the ignition experiment, the temperature increased rapidly, with a rate of 0.78°C/min, which is nearly eight times higher than that in the non-ignition case. This indicates that ignition can accelerate the thermal runaway process and lead to a more severe temperature rise, posing a greater threat to the safety of the energy storage system.
3.3 Propagation Rates of Thermal Runaway Parameters
3.3.1 Propagation Mechanisms and Calculation Methods
The propagation of thermal runaway parameters within the battery compartment is influenced by factors such as gas diffusion and convection. In this study, the propagation rates were calculated based on the time difference between the detection of the parameters at different sensor locations. The Fick’s law of diffusion was used to analyze the diffusion process of the gases. Assuming that the thermal runaway parameters are independent and diffuse only in the air, the diffusion flux equation can be expressed as:
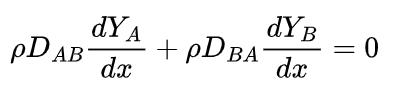
where ρ is the density of the mixture, DAB and DBA are the diffusion coefficients, YA and YB are the mass fractions of the components, and x is the radial distance. The diffusion coefficient DBA is proportional to θ0^3/2P0^-1, where θ0 is the ambient temperature and P0 is the ambient pressure.
3.3.2 Comparison of Propagation Rates under Different Conditions
The results show that the propagation rates of thermal runaway parameters vary depending on the location of the thermal runaway and the presence of ignition. In general, the propagation rates of the parameters were higher in the edge heating case compared to the middle heating case. This is attributed to the fact that the sidewalls of the compartment can enhance the buoyancy-driven flow, increasing the speed at which the gases and smoke spread. In the ignition case, the propagation rates of all parameters increased significantly compared to the non-ignition case. For example, the propagation rate of CO₂ increased from 35.71 mm/s in the non-ignition case to 194.80 mm/s in the ignition case, while the rate of VOCs increased from 27.21 mm/s to 132.76 mm/s. The increased propagation rates in the ignition case are due to the combined effects of thermal expansion and the enhanced buoyancy caused by the combustion process.
4. Discussion
4.1 Sensor Selection for Thermal Runaway Monitoring
The choice of sensors is crucial for the effective monitoring of thermal runaway in LiFePO₄ battery. Based on the experimental results, the catalytic combustion H₂ sensor and the photoionization VOC sensor demonstrated the fastest response times, making them ideal for the early detection of thermal runaway. Their high sensitivity and rapid response can provide early warnings, allowing for timely intervention to prevent the escalation of the event. The electrochemical H₂ sensor and the electrochemical VOC sensor also showed good performance in detecting the gases during the thermal runaway process, although their response times were relatively slower compared to the aforementioned sensors. The CO₂ sensor, while effective in detecting the gas, had a longer response time and may not be as suitable for the early detection of thermal runaway. However, its longer lifespan can be an advantage in certain applications.
4.2 The Significance of VOC Detection and Its Relationship with Battery Materials
The early detection of VOCs was found to be closely related to the release of electrolyte vapor and the decomposition of battery materials. The battery’s blue film and other components can release VOCs when heated, even before the battery reaches the critical thermal runaway stage. This finding suggests that further research could focus on developing materials that can release characteristic gases in response to temperature changes, enabling even earlier detection of thermal runaway. By enhancing the sensitivity of VOC detection and understanding the relationship between VOC release and battery degradation, it may be possible to develop more effective thermal runaway warning systems.
4.3 The Role of Temperature and Pressure Sensors in Different Scenarios
The temperature and pressure sensors installed in the battery compartment exhibited different behaviors depending on the presence of ignition. In the non-ignition case, the temperature and pressure changes at the top of the compartment were minimal, indicating that these sensors may not be effective for early thermal runaway detection in this location. However, in the ignition case, the temperature sensor can effectively monitor the rapid increase in temperature, providing a reliable indicator of the occurrence of a fire. The pressure sensor can be used to detect the pressure changes caused by the large amount of gas released during thermal runaway, which can help in assessing the severity of the event and the potential for gas leakage.
4.4 Determination of Detector Spacing Based on Propagation Rates
The propagation rates of thermal runaway parameters were used to calculate the appropriate detector spacing within the battery compartment. Based on the analysis, the recommended spacing between detectors at the edge of the compartment is between 0.639 m and 1.278 m, while in the middle of the compartment, the spacing should be between 0.924 m and 1.846 m. These spacings are designed to ensure that the detectors can effectively monitor the spread of thermal runaway and provide timely warnings. By optimizing the detector layout, the risk of undetected thermal runaway can be minimized, enhancing the safety of the energy storage system.
5. Conclusion
5.1 Summary of Key Findings
In this study, the thermal runaway characteristics of LiFePO₄ battery were investigated through a series of experiments using a real-scale energy storage compartment and multiple types of sensors. The key findings are as follows:
- The catalytic combustion H₂ sensor and the photoionization VOC sensor exhibited the fastest response times, making them suitable for early thermal runaway detection.
- VOCs were detected approximately 600 s before the onset of thermal runaway, mainly due to the early release of electrolyte vapor and the decomposition of battery materials.
- Ignition had a significant impact on the thermal runaway process, increasing the concentrations of CO, smoke, and CO₂, while decreasing the concentrations of H₂ and VOCs. The temperature also increased rapidly upon ignition.
- The propagation rates of thermal runaway parameters were higher in the edge heating case and significantly increased in the ignition case. The appropriate detector spacings were determined based on these propagation rates.
5.2 Implications for the Safety of Lithium-Iron Battery Energy Storage Systems
The results of this study have important implications for the safety management of lithium-iron battery energy storage systems. By selecting the appropriate sensors and implementing effective detection strategies, the risk of thermal runaway can be effectively mitigated. Early detection of thermal runaway allows for timely measures to be taken, such as activating cooling systems, isolating faulty battery or initiating fire suppression mechanisms. The optimized detector spacing ensures that the entire battery compartment is effectively monitored, reducing the likelihood of undetected thermal runaway events.