
The rapid advancement in photovoltaic technology has positioned perovskite solar cells as a promising candidate for next-generation solar energy solutions due to their exceptional photoelectric conversion efficiency and unique material properties. However, the widespread deployment of perovskite photovoltaic modules is hindered by stability issues, which lead to performance degradation and reduced lifespan. To address these challenges, this paper proposes a comprehensive power prediction scheme leveraging Internet of Things (IoT) technology. By integrating real-time monitoring and data analytics, the system aims to enhance the operational efficiency of photovoltaic systems, minimize energy losses, and facilitate proactive maintenance. The integration of IoT enables continuous data collection from various sensors, providing a robust foundation for accurate power forecasting and anomaly detection in perovskite solar cell arrays.
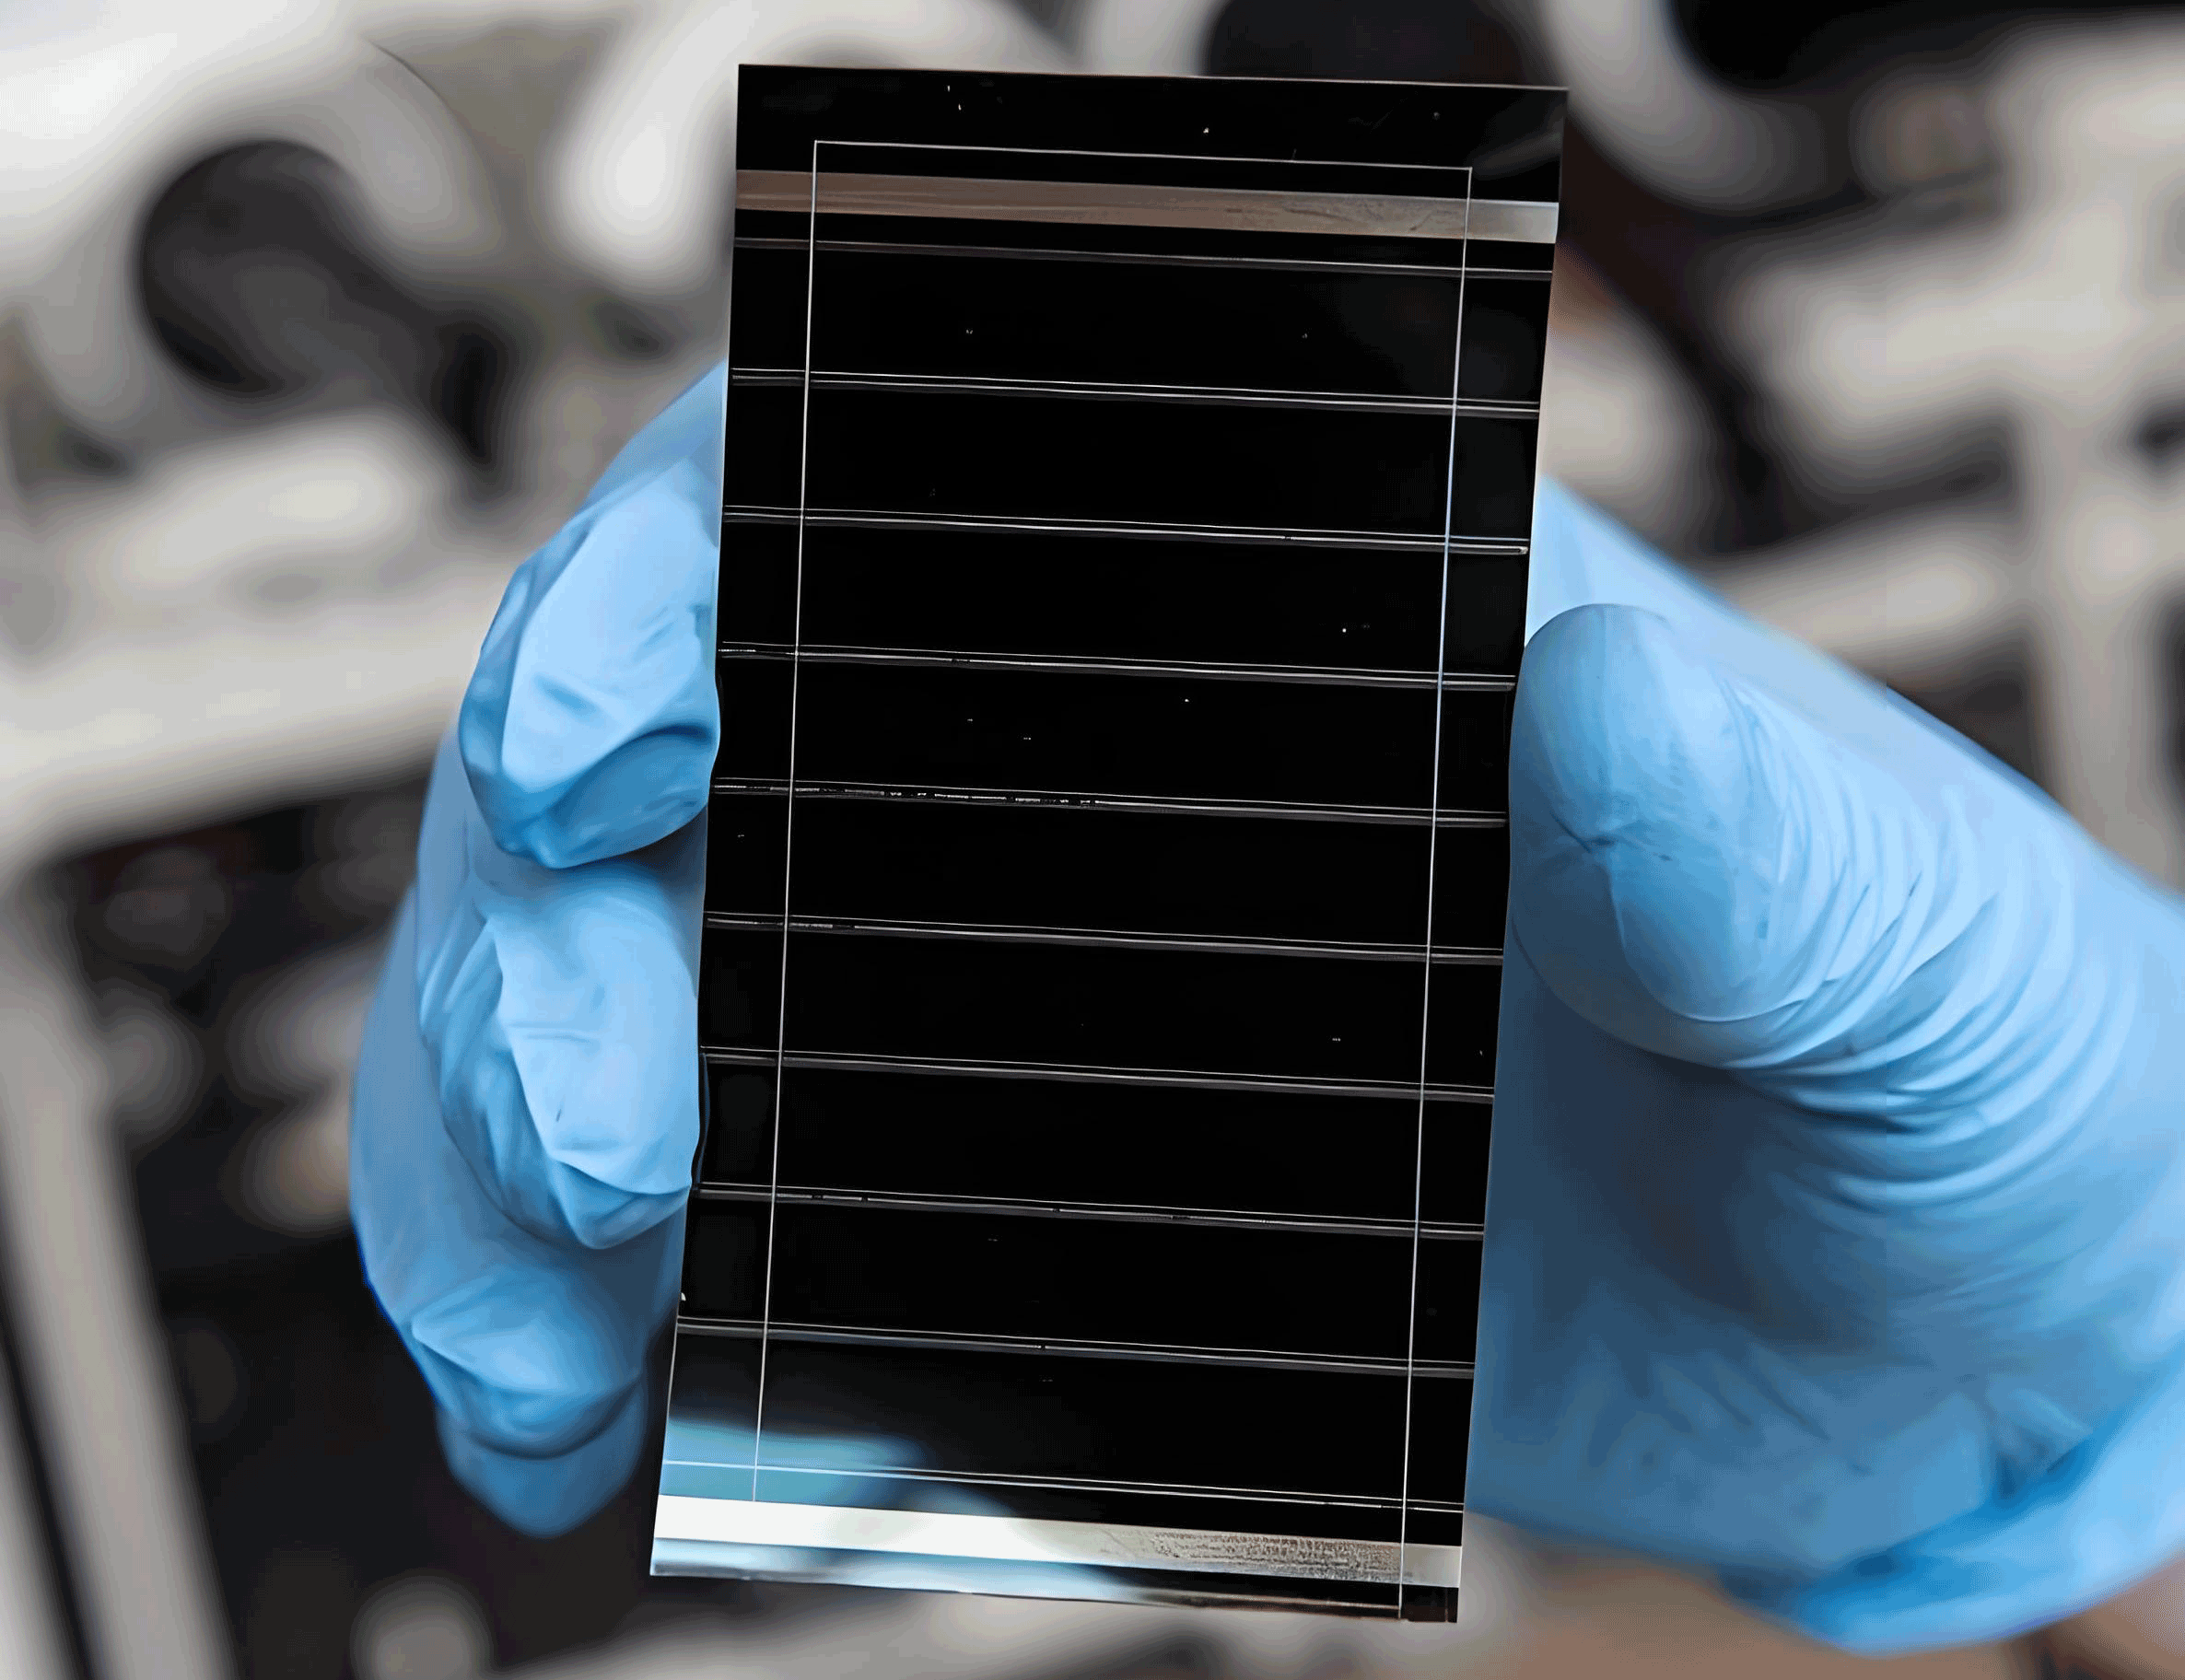
In this study, we first analyze the critical factors influencing photovoltaic power generation, including solar irradiance, temperature, humidity, and wind speed. These parameters are essential for understanding the behavior of perovskite solar cells under varying environmental conditions. Subsequently, we design an IoT-based framework comprising data transmission and remote monitoring modules to collect and process real-time data. To handle anomalies in the collected data, we employ a K-nearest neighbors reconstruction algorithm, which ensures data integrity and improves prediction accuracy. Finally, we construct a hybrid deep reinforcement learning model that combines wavelet packet decomposition with long short-term memory (LSTM) and gated recurrent unit (GRU) networks for precise power forecasting. Experimental results demonstrate the superiority of the proposed model over existing approaches, highlighting its potential for practical applications in smart energy systems.
Factors Influencing Photovoltaic Power Generation
The performance of perovskite solar cells is significantly affected by several environmental and operational factors. Understanding these influences is crucial for developing accurate prediction models. Below, we discuss the primary factors in detail, supported by mathematical formulations and empirical data.
Solar Irradiance
Solar irradiance is a dominant factor in photovoltaic power generation, as it directly determines the amount of solar energy captured by perovskite solar cells. The effective output power of a photovoltaic device can be expressed using the following formula:
$$P = \eta \cdot S \cdot R_a \cdot f(T_0)$$
where \(P\) represents the effective output power, \(\eta\) denotes the energy conversion efficiency of the perovskite solar cell, \(S\) is the surface area parameter of the photovoltaic array, \(R_a\) is the irradiance on the unit photovoltaic panel, and \(f(T_0)\) is a temperature-dependent correction function. To mitigate the impact of data periodicity on prediction outcomes, data samples are standardized using min-max normalization:
$$b(t) = \frac{a(t) – \min\{a(t)\}}{\max\{a(t)\} – \min\{a(t)\}}$$
Here, \(b(t)\) is the normalized data value bounded between 0 and 1, \(a(t)\) is the original data sample, and \(\min\{a(t)\}\) and \(\max\{a(t)\}\) are the minimum and maximum values in the dataset, respectively. Additionally, the direct solar irradiance \(R_H\) and diffuse irradiance \(R_\theta\) are calculated as follows:
$$R_H = R_{DH} \cdot \cos(\theta)$$
$$R_\theta = R_{dH} + R_{D\theta} \cdot \sin(\theta) + R_{R\theta}$$
In these equations, \(R_{DH}\) is the horizontal irradiance, \(R_{dH}\) is the horizontal diffuse irradiance, \(R_{D\theta}\) is the total irradiance on an inclined surface, \(R_{R\theta}\) is the reflected irradiance on the surface, and \(\theta\) is the solar incidence angle. These calculations are vital for assessing the actual energy input to perovskite solar cells.
Temperature
Temperature exerts a nonlinear influence on the power output of perovskite solar cells. Unlike solar irradiance, the relationship between temperature and power generation is not monotonic. Initially, as temperature rises, the power output increases due to enhanced carrier mobility. However, beyond a certain threshold, excessive heat causes localized heating in the perovskite solar cell, leading to increased losses and efficiency degradation. The temperature effect can be modeled using a polynomial function:
$$P_{\text{temp}} = P_0 \cdot \left(1 – \beta \cdot (T – T_{\text{ref}})\right)$$
where \(P_{\text{temp}}\) is the temperature-adjusted power, \(P_0\) is the power at reference temperature \(T_{\text{ref}}\), and \(\beta\) is the temperature coefficient specific to perovskite solar cells. Empirical studies indicate that for every 1°C increase beyond the optimal range, the efficiency of perovskite solar cells decreases by approximately 0.1-0.3%.
Humidity
Relative humidity affects the thermal management and light transmission properties of perovskite solar cells. High humidity levels can lead to moisture ingress into the cell structure, causing delamination and reduced heat dissipation. This results in lower power output and accelerated performance衰减. The impact of humidity on power generation is quantified using the following empirical relation:
$$P_{\text{hum}} = P_{\text{base}} \cdot \exp(-\gamma \cdot H)$$
Here, \(P_{\text{hum}}\) is the humidity-adjusted power, \(P_{\text{base}}\) is the baseline power, \(H\) is the relative humidity percentage, and \(\gamma\) is a humidity coefficient derived from experimental data on perovskite solar cells.
Wind Speed
Wind speed indirectly influences power generation by affecting the cooling and cleaning of photovoltaic modules. While not directly correlated with power output, wind helps remove dust and pollutants from the surface of perovskite solar cells, thereby improving light absorption. The cooling effect of wind can be incorporated into the temperature model as a corrective factor:
$$T_{\text{eff}} = T_{\text{amb}} – \kappa \cdot v$$
where \(T_{\text{eff}}\) is the effective temperature, \(T_{\text{amb}}\) is the ambient temperature, \(v\) is the wind speed, and \(\kappa\) is a wind cooling coefficient. This adjustment enhances the accuracy of power prediction models for perovskite solar cells.
| Factor | Symbol | Impact on Power | Mathematical Relation |
|---|---|---|---|
| Solar Irradiance | \(R_a\) | Directly proportional | \(P \propto R_a\) |
| Temperature | \(T\) | Nonlinear (increases then decreases) | \(P_{\text{temp}} = P_0 \cdot (1 – \beta \cdot (T – T_{\text{ref}}))\) |
| Humidity | \(H\) | Inversely proportional | \(P_{\text{hum}} = P_{\text{base}} \cdot \exp(-\gamma \cdot H)\) |
| Wind Speed | \(v\) | Indirect (cooling and cleaning) | \(T_{\text{eff}} = T_{\text{amb}} – \kappa \cdot v\) |
IoT-Based Framework for Perovskite Solar Cell Monitoring
The proposed IoT framework for perovskite solar cells consists of two main modules: the data transmission module and the remote monitoring and analytics module. These components work in tandem to enable real-time data acquisition, processing, and visualization.
Data Transmission Module Design
Given the complex operational states of perovskite solar cells, a multisensor approach is adopted to monitor key parameters such as irradiance, temperature, humidity, voltage, current, and power output. Sensors are deployed across the photovoltaic array and connected to a cloud server via serial interfaces or wireless protocols. The data transmission leverages 4G networks to ensure reliable and high-speed communication. The overall data flow can be represented by the following equation, which aggregates sensor readings:
$$D_{\text{total}} = \sum_{i=1}^{n} \left( \alpha_i \cdot S_i \right)$$
where \(D_{\text{total}}\) is the aggregated data stream, \(S_i\) is the reading from the \(i\)-th sensor, \(\alpha_i\) is a weighting factor based on sensor reliability, and \(n\) is the total number of sensors. This setup facilitates seamless data transfer to the cloud for further analysis.
Remote Monitoring and Analytics Module Design
The remote monitoring module comprises a server side and a client side. The server side includes IoT data acquisition devices, a cloud server, and a visualization interface. Users can access real-time data and control the system through a web-based dashboard. An alert mechanism is implemented to notify operators when the actual power output of a perovskite solar cell falls below a predefined threshold. The analytics component employs machine learning algorithms to identify patterns and predict future performance. The key metrics monitored include:
- Instantaneous power output
- Cumulative energy generation
- Efficiency trends of perovskite solar cells
- Environmental parameter correlations
This module enhances the operational reliability of perovskite solar cells by enabling proactive interventions.
Anomaly Data Processing Using K-Nearest Neighbors Reconstruction
To ensure data quality, we apply the K-nearest neighbors (KNN) reconstruction algorithm for handling missing or abnormal data points in the photovoltaic power dataset. This method leverages historical data to impute values based on proximity, thereby maintaining the integrity of the dataset for perovskite solar cell analysis. The algorithm involves the following steps:
- Calculate Euclidean Distance: The distance between training samples and the target sample is computed using:
$$Dis(x,y) = \sqrt{\sum_{j=1}^{n} (x_j – y_j)^2}$$
where \(n\) is the number of features, \(x_j\) represents the feature values of the abnormal data, and \(y_j\) denotes the feature values of other data samples. - Data Partitioning: The dataset is split into training and anomaly sets. Features are ranked based on distance, and the K closest samples are selected.
- Weight Assignment: Weights are assigned to the selected samples inversely proportional to their distance. The weight \(w_i\) for the \(i\)-th neighbor is given by:
$$w_i = \frac{1}{Dis(x_i, y)}$$ - Data Reconstruction: The imputed value for the abnormal data point is calculated as the weighted average of the K neighbors:
$$\hat{x} = \frac{\sum_{i=1}^{K} w_i \cdot x_i}{\sum_{i=1}^{K} w_i}$$
This approach effectively replaces outliers and gaps, resulting in a cleaned dataset for subsequent modeling of perovskite solar cell performance.
Hybrid Deep Reinforcement Learning Model for Power Prediction
The power prediction model for perovskite solar cells integrates wavelet packet decomposition (WPD) with deep learning techniques to capture temporal patterns and environmental dependencies. The model architecture is outlined below.
Wavelet Packet Decomposition
Raw photovoltaic power data is decomposed into multiple subsequences using WPD, which provides a multi-resolution analysis. This decomposition enhances the model’s ability to capture both high-frequency and low-frequency components inherent in perovskite solar cell data. The decomposition process can be represented as:
$$X(t) = \sum_{k} D_k(t)$$
where \(X(t)\) is the original power signal, and \(D_k(t)\) are the decomposed subsequences.
LSTM and GRU Modeling
Each subsequence from the WPD is fed into an LSTM network, which utilizes previous power values and current meteorological data (e.g., solar irradiance, temperature, humidity, wind speed) to forecast future power output. The LSTM equations are as follows:
$$i_t = \sigma(W_i \cdot [h_{t-1}, x_t] + b_i)$$
$$f_t = \sigma(W_f \cdot [h_{t-1}, x_t] + b_f)$$
$$o_t = \sigma(W_o \cdot [h_{t-1}, x_t] + b_o)$$
$$\tilde{C}_t = \tanh(W_C \cdot [h_{t-1}, x_t] + b_C)$$
$$C_t = f_t \cdot C_{t-1} + i_t \cdot \tilde{C}_t$$
$$h_t = o_t \cdot \tanh(C_t)$$
Here, \(i_t\), \(f_t\), and \(o_t\) are the input, forget, and output gates, respectively; \(C_t\) is the cell state; \(h_t\) is the hidden state; \(x_t\) is the input vector; and \(W\) and \(b\) are learnable parameters.
For efficiency, a GRU variant is also employed, which combines the forget and input gates into an update gate \(z_t\):
$$z_t = \sigma(W_z \cdot [h_{t-1}, x_t] + b_z)$$
$$r_t = \sigma(W_r \cdot [h_{t-1}, x_t] + b_r)$$
$$\tilde{h}_t = \tanh(W \cdot [r_t \cdot h_{t-1}, x_t] + b)$$
$$h_t = (1 – z_t) \cdot h_{t-1} + z_t \cdot \tilde{h}_t$$
The GRU model reduces computational complexity while maintaining long-term dependencies, making it suitable for real-time applications involving perovskite solar cells.
Model Integration and Training
The final prediction is obtained by aggregating the outputs from all subsequences. The hybrid model, denoted as Q-L-WPD-L-G-R, combines Q-learning for reinforcement-based optimization with WPD, LSTM, and GRU networks. The loss function minimized during training is the mean squared error (MSE):
$$\text{MSE} = \frac{1}{N} \sum_{t=1}^{N} (y_t – \hat{y}_t)^2$$
where \(y_t\) is the actual power output of the perovskite solar cell, and \(\hat{y}_t\) is the predicted value.
Experimental Analysis and Results
To evaluate the performance of the proposed Q-L-WPD-L-G-R model, comparative experiments were conducted against baseline models, including GRU, WPD-GRU, and Q-L-L-G-R (without wavelet packet decomposition). The models were tested under different weather conditions—sunny, cloudy, and rainy—using datasets collected from perovskite solar cell arrays. The evaluation metrics included mean absolute error (MAE), root mean square error (RMSE), and mean absolute percentage error (MAPE).
| Weather Condition | Prediction Model | MAE (kW) | RMSE (kW) | MAPE (%) |
|---|---|---|---|---|
| Sunny | GRU | 0.239 | 0.248 | 3.276 |
| WPD-GRU | 0.090 | 0.089 | 2.216 | |
| Q-L-L-G-R | 0.062 | 0.066 | 1.936 | |
| Q-L-WPD-L-G-R | 0.044 | 0.058 | 1.594 | |
| Cloudy | GRU | 0.433 | 0.597 | 8.697 |
| WPD-GRU | 0.356 | 0.469 | 8.514 | |
| Q-L-L-G-R | 0.349 | 0.461 | 7.845 | |
| Q-L-WPD-L-G-R | 0.224 | 0.343 | 3.569 | |
| Rainy | GRU | 0.456 | 0.621 | 8.745 |
| WPD-GRU | 0.426 | 0.516 | 8.261 | |
| Q-L-L-G-R | 0.395 | 0.496 | 7.840 | |
| Q-L-WPD-L-G-R | 0.372 | 0.476 | 7.624 |
The results indicate that the Q-L-WPD-L-G-R model consistently outperforms other models across all weather scenarios. For instance, under sunny conditions, the proposed model reduces MAE, RMSE, and MAPE by 29.1%, 12.1%, and 36.4%, respectively, compared to the Q-L-L-G-R model. This demonstrates the efficacy of integrating wavelet packet decomposition and deep reinforcement learning for forecasting the power output of perovskite solar cells.
Conclusion
This paper presents an IoT-based power prediction system tailored for perovskite solar cells, incorporating real-time monitoring, anomaly detection, and a hybrid deep learning model. The framework addresses key challenges such as data variability and environmental influences, enabling accurate and reliable power forecasts. Experimental validations confirm that the Q-L-WPD-L-G-R model achieves superior performance under diverse weather conditions, underscoring its practical utility in enhancing the efficiency and stability of perovskite solar cell deployments. Future work will focus on optimizing the model for larger-scale applications and integrating additional sensors for comprehensive perovskite solar cell health monitoring.