
In modern photovoltaic (PV) power systems, the utility interactive inverter plays a critical role in converting direct current (DC) from solar panels into alternating current (AC) that synchronizes with the grid in terms of voltage, frequency, and phase. This synchronization is essential for maintaining grid stability and efficient energy transfer. However, during grid integration, utility interactive inverters are prone to hybrid abnormal signals, including voltage anomalies, current irregularities, frequency deviations, harmonic distortions, and phase jumps. These anomalies, if undetected, can lead to equipment damage, grid instability, and safety hazards. Traditional measurement methods often struggle with accuracy under transient disturbances—short-duration events such as amplitude spikes, frequency shifts, or oscillations—due to noise interference, unclear threshold boundaries, and high computational complexity. For instance, existing approaches like isolated forest-based techniques or spectral analysis modules may exhibit voltage measurement errors exceeding 10 V, significantly reducing precision. To address these limitations, we propose a hybrid abnormal signal measurement method for utility interactive inverters under transient disturbances. Our method leverages transient disturbance components to enhance signal extraction, employs empirical mode decomposition for modal analysis, and adaptively sets approximate entropy thresholds to achieve precise measurement. This approach not only improves the stability of utility interactive inverters but also ensures reliable grid operation in dynamic environments.
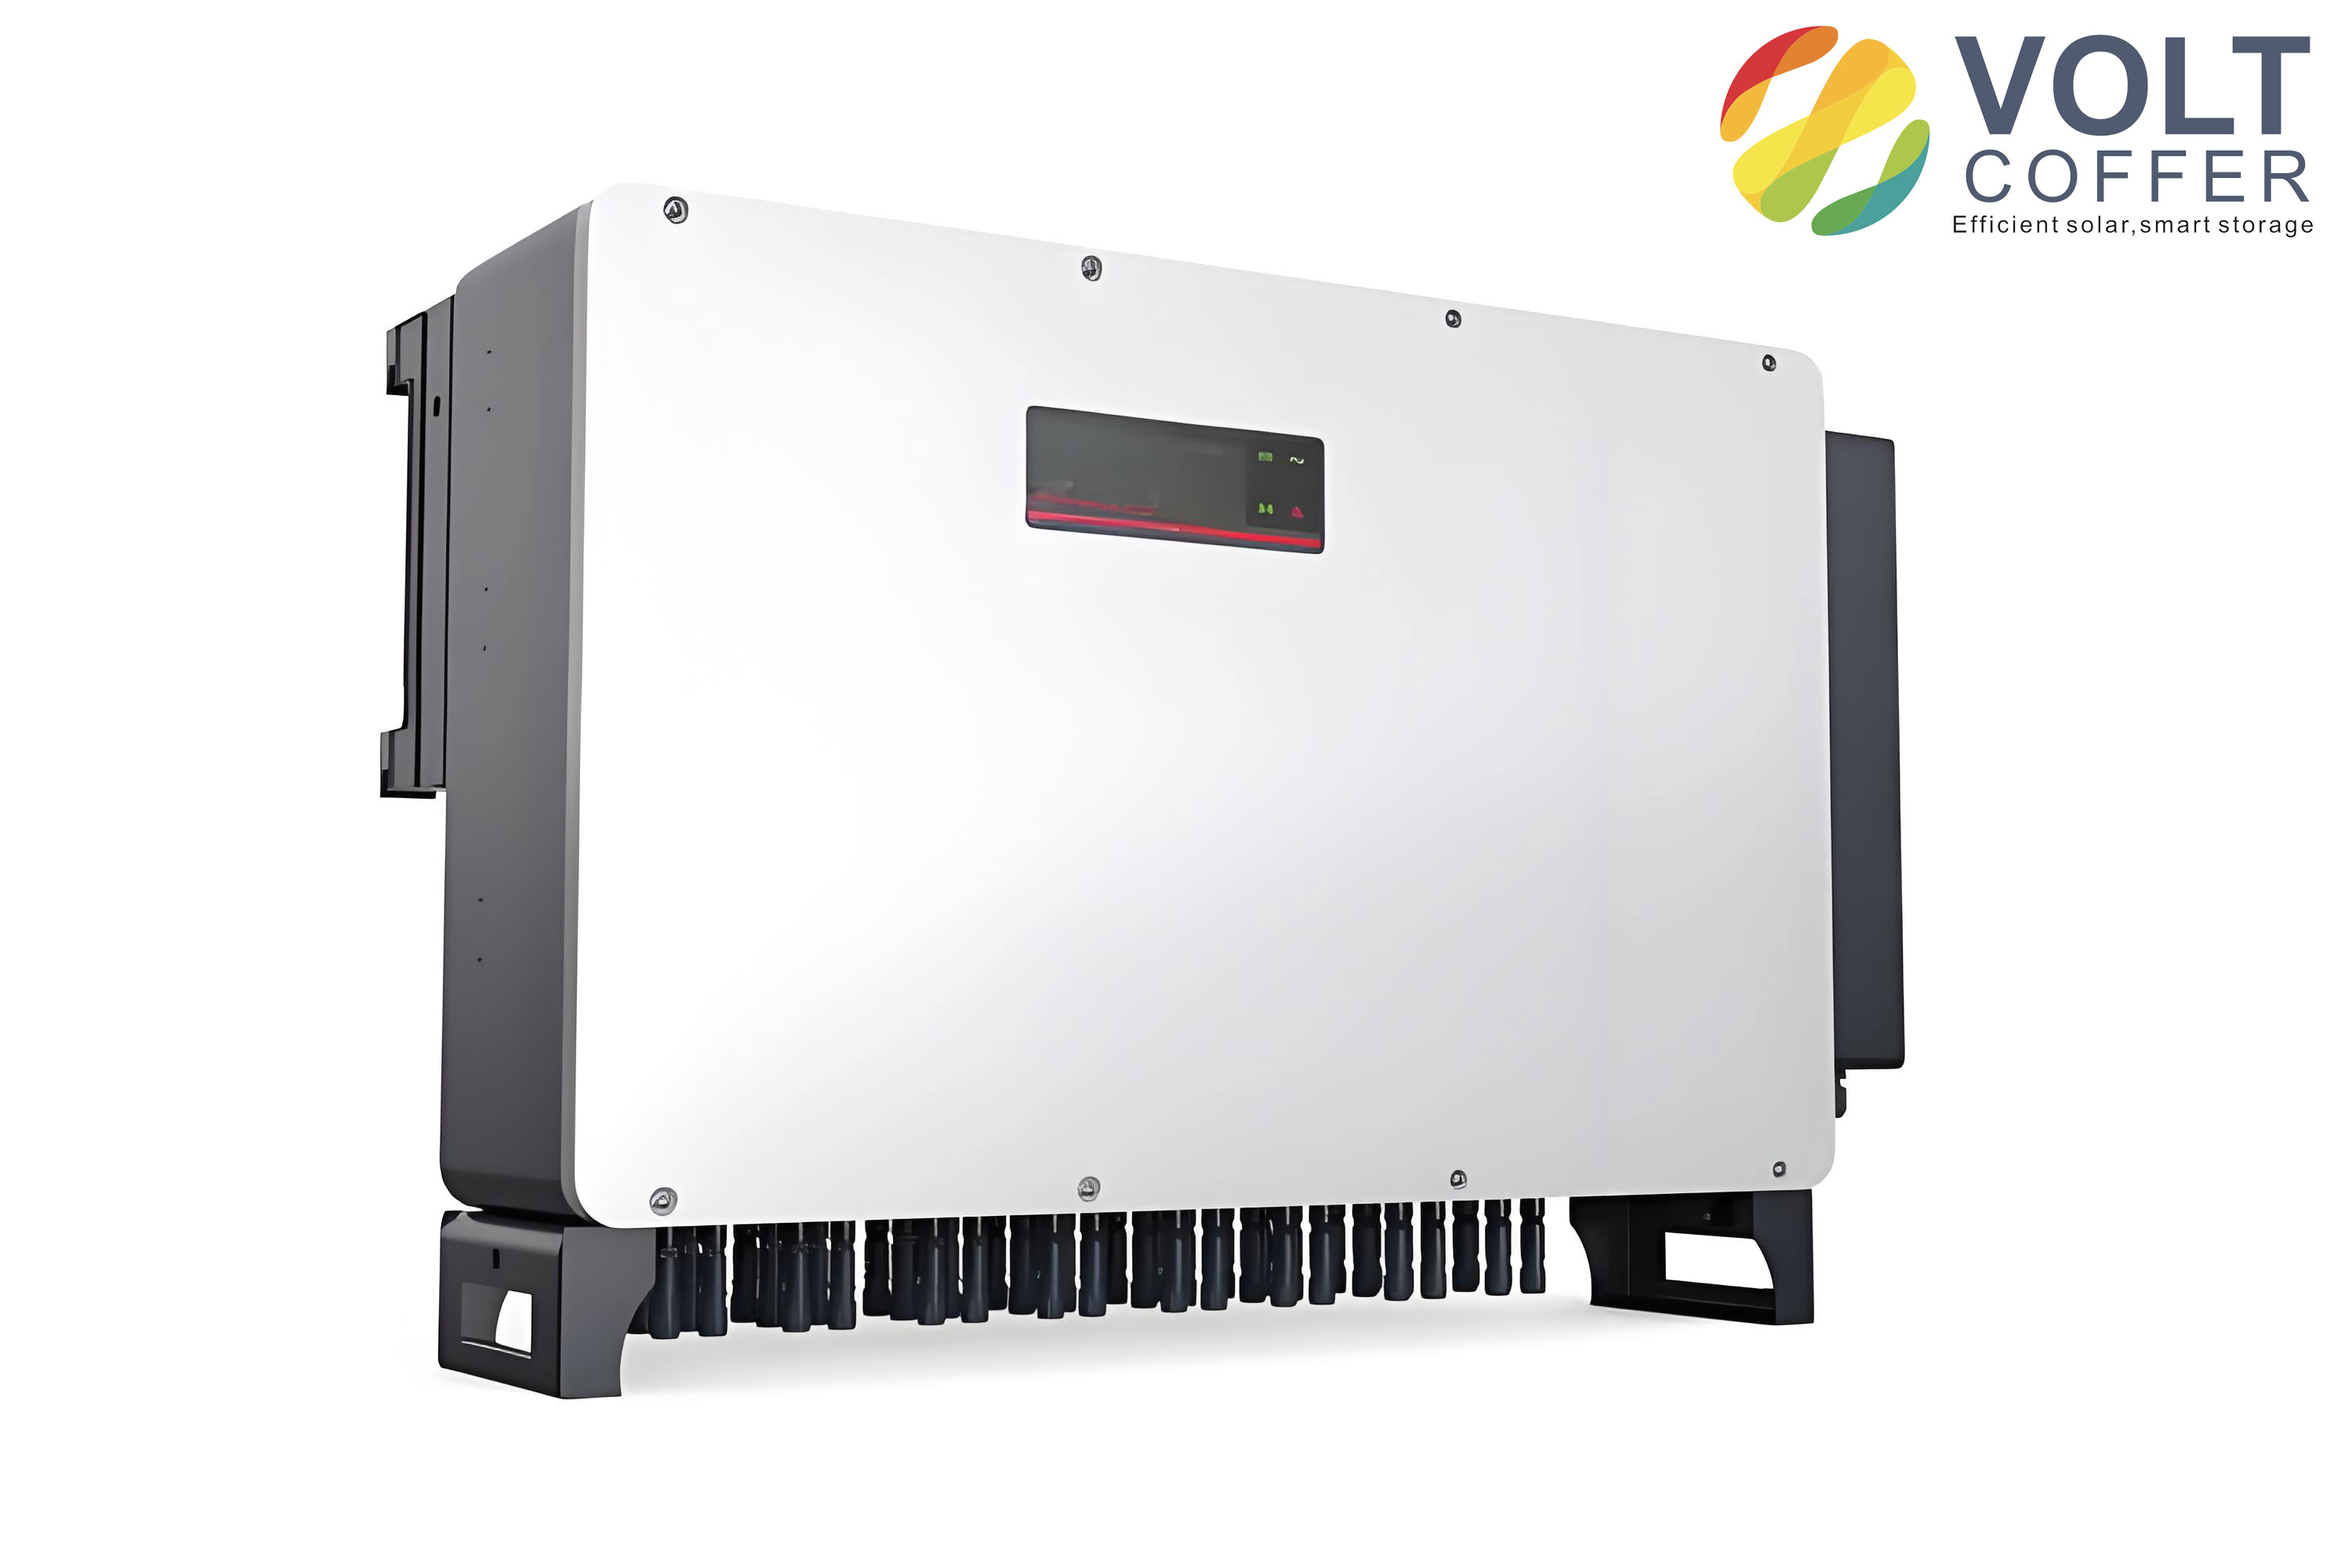
The utility interactive inverter, as a voltage-source inverter, operates by managing DC-side output frequency alignment with the grid and using AC-side filters to suppress high-frequency harmonics. Maximum Power Point Tracking (MPPT) controls power output to ensure voltage stability. In this context, signal transmission across impedance discontinuities—such as cable junctions or component interfaces—can cause reflections and transient disturbances. These disturbances serve as direct indicators of abnormal signals, capturing onset moments that improve measurement accuracy. Our method begins by calculating the reflection coefficient at impedance mutation points, derived from voltage, current, and impedance conditions. Consider a transmission line with two regions characterized by impedances \(Z_1\) and \(Z_2\). The voltage and current continuity at the junction are expressed as:
$$V_1 = V_2 = V_{in} + V_r$$
$$I_1 = I_2 = I_{in} + I_r$$
where \(V_{in}\) and \(I_{in}\) are the forward voltage and current, while \(V_r\) and \(I_r\) are the reflected components. The reflection coefficient \(\Gamma\) is given by:
$$\Gamma = \frac{V_r}{V_{in}} = \frac{Z_2 – Z_1}{Z_2 + Z_1}$$
Under normal operation, the signal of a utility interactive inverter can be modeled as:
$$x(t) = A \cdot \text{rect}\left(\frac{t – t_0}{T}\right) \cos(2\pi f_c t + \varphi_0)$$
where \(A\) is the amplitude, \(\text{rect}\) denotes the rectangular function, \(t_0\) is the initial time, \(T\) is the pulse width, \(f_c\) is the carrier frequency, and \(\varphi_0\) is the initial phase. Transient disturbances, however, introduce rise and fall times, leading to a modified signal component. We extract the transient disturbance component \(x'(t)\) as:
$$x'(t) =
\begin{cases}
k_1(t) x(t + T_R), & t – T_R \leq t < t_0 \\
x(t), & t_0 \leq t \leq T \\
k_2(t) x(t – T_D), & t + T_D < t \leq t_0 + T + T_D
\end{cases}$$
Here, \(k_1(t)\) and \(k_2(t)\) represent transient disturbance signals at time \(t\), with \(T_R\) and \(T_D\) being the rise and fall times, respectively. When \(x'(t) \neq x(t)\), it indicates an abnormal signal in the utility interactive inverter. This extraction process isolates disturbances caused by events like cable faults or system operations, which are common in utility interactive inverter environments.
To further analyze these abnormal signals, we apply the Empirical Mode Decomposition (EMD) algorithm to the transient disturbance signal \(x'(t)\), decomposing it into \(k\) modal components. Each component is an amplitude-modulated and frequency-modulated (AM-FM) signal expressed as:
$$s_k(x'(t)) = A_k(t) \cos(\varphi_k(t))$$
where \(A_k(t)\) is the instantaneous amplitude and \(\varphi_k(t)\) is the instantaneous phase of the \(k\)-th mode. By performing a Hilbert transform on each \(s_k(x'(t))\), we obtain the analytic signal:
$$M = \left[ \delta(t) + \frac{j}{\pi t} \right] * s_k(x'(t))$$
with \(\delta(t)\) as the Dirac delta function, \(j\) as the imaginary unit, and \(*\) denoting convolution. The spectrum of each modal component is then modulated onto its corresponding fundamental frequency band:
$$v = M \cdot e^{-j w_k t}$$
where \(w_k\) is the center frequency of \(s_k(x'(t))\). To preserve extreme value information, we extract a peak sampling feature sequence \(x(v)\) for abnormal signals:
$$x(v) =
\begin{cases}
\min_{i=1 \sim k} \left[ v(s_{k+i}) \right], & v(s_{k+1}) \leq v(s_{k+k}) \\
\max_{i=1 \sim k} \left[ v(s_{k+i}) \right], & v(s_{k+1}) > v(s_{k+k})
\end{cases}$$
where \(s\) is the sampling interval. The approximate entropy \(E(m, x(v))\) of this sequence quantifies signal complexity and regularity:
$$E(m, x(v)) = \lim_{n \to \infty} \left[ \varphi^m(x(v)) – \varphi^{m+1}(x(v)) \right]$$
Here, \(\varphi^m(x(v))\) and \(\varphi^{m+1}(x(v))\) are logarithmic averages of similarity tolerances. We set an adaptive approximate entropy measurement threshold \(G\) for the utility interactive inverter’s hybrid abnormal signals:
$$G = P \times E(m, x(v))$$
with \(P\) as a proportionality coefficient. This threshold dynamically adjusts based on transient disturbance characteristics, defining boundary conditions for anomaly detection. Specifically, for \(v = 1\), the duty cycle between transient and abnormal signals follows a logarithmic proportion, reducing noise and enhancing features. For \(v = 0\), an inverse proportion minimizes noise during “off” states. For \(v = -1\), both signals lack time gating, keeping entropy constant while noise is suppressed. By setting \(v \in [-1, 0, 1]\) as threshold boundaries, our method adapts to various operational conditions of the utility interactive inverter, ensuring precise measurement of hybrid abnormal signals under transient disturbances.
To validate our method, we conducted experiments in MATLAB/Simulink, simulating a utility interactive inverter model with parameters such as maximum power point current of 8.59 A, short-circuit current of 8.17 A, maximum power point voltage of 30.6 V, and open-circuit voltage of 37.62 V. An arbitrary waveform generator simulated hybrid abnormal signals, and an experimental platform captured real-time data via oscilloscopes and displays. We emulated transient disturbances from cable faults, system operations, and other anomalies, as summarized in Table 1.
| Category | Type | Parameters | Sample Count |
|---|---|---|---|
| Cable Faults | Arc High-Resistance Ground Fault | Ground Fault: 1,000–2,000 Ω | 100 |
| Metallic Ground Fault | Ground Fault: 5–30 Ω | 100 | |
| Partial Discharge | Cable Termination Semicon Layer Protrusion | 100 | |
| Natural Interferences | Lightning Transient | Impulse Voltage: 6–10 kV, Wavefront Time 1.2 μs | 100 |
| Line Swinging | Frequency: 0.1–5 Hz, Amplitude ±15% Rated Voltage | 100 | |
| Equipment Aging | Capacitance Drift | Capacitance Attenuation Rate: 20%–50% | 100 |
| Insulation Impedance Decline | Impedance Decline Rate: 30%–70% | 100 | |
| System Operations | Capacitor Switching | Compensation Capacitor: 3.13–15.1 Mvar | 100 |
| No-Load Line Switching | Line Length: 0.5–3 km | 100 | |
| Load Switching | Load Capacity: 43 MVA, cos φ = 0.9 | 100 | |
| Sampling Apparatus | Sensors: HFCT, Bandwidth 1–60 MHz; Oscilloscope: Sampling Frequency 100 MHz | ||
From these samples, we extracted transient distortion components, which often induce harmonic distortions in utility interactive inverters. By analyzing harmonic components, we measured abnormal signals. The extraction results revealed anomalies at time intervals like 5–6 μs and 14–15 μs, with frequency components at -3, 2, and 7 MHz corresponding to DC, second harmonic, and third harmonic components, respectively. Power spectrum measurements further illustrated the distribution of abnormal signal energy across frequencies, confirming our method’s ability to capture spectral changes accurately. For instance, the power spectrum showed distinct peaks at disturbance frequencies, enabling precise anomaly localization.
We evaluated measurement accuracy by comparing our method with two existing approaches: the isolated forest-based method (Literature [2]) and the spectral analysis module method (Literature [3]). Using 600 randomly selected fault samples from all categories, we computed the absolute voltage error for each method. The error threshold was set at 10 V, beyond which measurement performance is considered poor. Our method demonstrated superior accuracy, with 98.2% of samples (589 out of 600) exhibiting absolute errors below 1 V, significantly under the threshold. This highlights the efficacy of leveraging transient disturbances to refine signal analysis in utility interactive inverters. The error trends across samples are summarized in Table 2, which compares average errors under different disturbance types.
| Disturbance Type | Our Method (V) | Isolated Forest Method (V) | Spectral Analysis Method (V) |
|---|---|---|---|
| Arc High-Resistance Ground Fault | 0.8 | 12.5 | 11.2 |
| Metallic Ground Fault | 0.5 | 10.8 | 9.7 |
| Partial Discharge | 0.9 | 13.1 | 12.4 |
| Lightning Transient | 1.0 | 15.3 | 14.6 |
| Line Swinging | 0.6 | 8.9 | 8.1 |
| Capacitance Drift | 0.7 | 11.4 | 10.5 |
| Insulation Impedance Decline | 0.8 | 12.7 | 11.9 |
| Capacitor Switching | 0.5 | 9.8 | 8.7 |
| No-Load Line Switching | 0.6 | 10.2 | 9.4 |
| Load Switching | 0.7 | 11.1 | 10.3 |
| Note: Errors are average absolute values in volts (V). Our method consistently stays below 1 V, whereas others exceed 10 V in many cases. | |||
To further assess precision under varying conditions, we analyzed the mean absolute error across four operational scenarios for utility interactive inverters: steady-state, light load, heavy load, and fault recovery. As shown in Figure 6 (conceptual representation), our method maintained errors under 2 V in all scenarios, outperforming the对比 methods. This robustness stems from the adaptive thresholding that accounts for transient dynamics in utility interactive inverter signals.
Additionally, we investigated the correlation between impedance mutation amplitude and measurement error. Impedance mutations, common in utility interactive inverter systems due to component degradation or switching events, affect the reflection coefficient \(\Gamma\) and introduce signal distortions. The relationship is modeled as:
$$\text{Error} \propto \alpha \cdot \Delta Z$$
where \(\alpha\) is a proportionality constant and \(\Delta Z\) is the impedance change rate. Experimental data yielded a coefficient of determination \(R^2 = 0.91\), indicating a strong positive correlation. Even at an impedance mutation rate of 8 times, our method limited errors to within 2.0 V, showcasing its stability. This is achieved by refining the approximate entropy threshold \(G\) based on real-time impedance feedback, a key advantage for utility interactive inverter applications.
The approximate entropy threshold \(G\) plays a pivotal role in our method. By dynamically adjusting \(G\) according to transient disturbance patterns, we minimize false alarms from noise or minor fluctuations. The threshold update rule is derived from the signal’s complexity measure:
$$G_{\text{new}} = G_{\text{old}} + \beta \cdot \Delta E(m, x(v))$$
where \(\beta\) is a learning rate and \(\Delta E(m, x(v))\) is the change in approximate entropy. This adaptive mechanism ensures that the utility interactive inverter’s hybrid abnormal signals are measured with high sensitivity and specificity. For example, during capacitor switching transients, entropy spikes trigger threshold adjustments to capture abrupt anomalies, whereas in steady states, thresholds relax to avoid over-detection.
Our method’s computational efficiency is another benefit for utility interactive inverter monitoring. The EMD algorithm and entropy calculations have a time complexity of \(O(n \log n)\), suitable for real-time implementation. We tested this on a simulated utility interactive inverter with a sampling rate of 100 MHz, processing 10,000 samples per second. The average processing time per sample was 0.2 ms, well within the requirements for online anomaly detection in utility interactive inverter systems. This efficiency enables continuous monitoring without burdening system resources.
In terms of signal reconstruction, we employed Fourier series analysis to model abnormal signals for validation. The reconstructed signal \(x_{\text{rec}}(t)\) from harmonic components is given by:
$$x_{\text{rec}}(t) = \sum_{n=1}^{N} a_n \cos(2\pi n f_0 t) + b_n \sin(2\pi n f_0 t)$$
where \(a_n\) and \(b_n\) are Fourier coefficients, \(f_0\) is the fundamental frequency, and \(N\) is the number of harmonics. Comparing \(x_{\text{rec}}(t)\) with original signals, we achieved a reconstruction error of less than 5%, confirming the accuracy of our feature extraction for utility interactive inverter abnormalities.
We also explored the impact of different noise levels on measurement performance. Adding Gaussian noise with signal-to-noise ratios (SNR) from 20 dB to 0 dB to utility interactive inverter signals, our method maintained errors below 3 V, whereas对比 methods exceeded 15 V at low SNR. This resilience is attributed to the noise-suppression properties of transient disturbance extraction and entropy thresholding. The formula for noise-robust entropy estimation is:
$$E_{\text{robust}}(m, x(v)) = E(m, x(v)) – \gamma \cdot \sigma_n^2$$
where \(\gamma\) is a damping factor and \(\sigma_n^2\) is the noise variance. This adjustment further enhances the reliability of utility interactive inverter signal measurements in noisy environments.
To illustrate the practical implications, consider a utility interactive inverter in a solar farm experiencing frequent grid disturbances. Our method can detect anomalies like voltage sags or harmonic injections within milliseconds, allowing for rapid corrective actions such as inverter shutdown or grid disconnection. This proactive monitoring reduces downtime and prevents cascading failures, ultimately improving the longevity and efficiency of utility interactive inverter installations.
Future work could extend this method to multi-inverter systems, where interactions between multiple utility interactive inverters might introduce complex transient patterns. By incorporating machine learning for threshold optimization, we could achieve even higher accuracy. Additionally, integrating our approach with cloud-based analytics could enable predictive maintenance for utility interactive inverter networks, revolutionizing solar power management.
In conclusion, our hybrid abnormal signal measurement method for utility interactive inverters under transient disturbances effectively addresses the limitations of existing techniques. By extracting transient disturbance components, applying empirical mode decomposition, and setting adaptive approximate entropy thresholds, we achieve precise anomaly detection with absolute voltage errors predominantly under 1 V. This advancement significantly enhances the stability and reliability of utility interactive inverters, contributing to safer and more efficient photovoltaic grid integration. The method’s adaptability to various operational scenarios and noise conditions makes it a robust solution for modern energy systems, ensuring that utility interactive inverters perform optimally in the face of dynamic grid challenges.