
1. Introduction
Solar energy has become a pivotal component in the global transition toward clean and sustainable power systems. As one of the most rapidly expanding renewable energy technologies, photovoltaic (PV) systems are deployed extensively across deserts, grasslands, and other open areas to harness sunlight and convert it into electricity. However, the operational environment of these solar panel arrays introduces significant challenges, particularly the accumulation of foreign objects on the panel surfaces. Dust particles, bird droppings, leaves, and other debris can partially or fully cover the PV modules, leading to reduced light absorption, scattering, and reflection. This directly translates into lower photoelectric conversion efficiency. Research has shown that power loss due to surface contamination can reach 25% to 30% in severe cases. Moreover, prolonged deposition of such contaminants can trigger localized heating, known as the “hot spot effect,” which may cause permanent damage to the solar cells, accelerate module degradation, and even create fire hazards.
Efficient and reliable inspection of PV panel surface foreign objects is thus essential for maintaining the stability and profitability of solar power plants. Traditional inspection methods, such as manual visual inspection, thermal imaging, and photoelectric detection, suffer from various drawbacks. Manual inspection is labor-intensive, time-consuming, and subjective. Thermal imaging is sensitive to environmental conditions and often fails to detect small contaminants. Photoelectric methods require uniform illumination and stable equipment, making them unreliable in outdoor settings. With the advancement of computer vision and deep learning, vision-based detection approaches have demonstrated great potential. They can automatically identify and localize foreign objects with high accuracy and speed, enabling intelligent maintenance strategies.
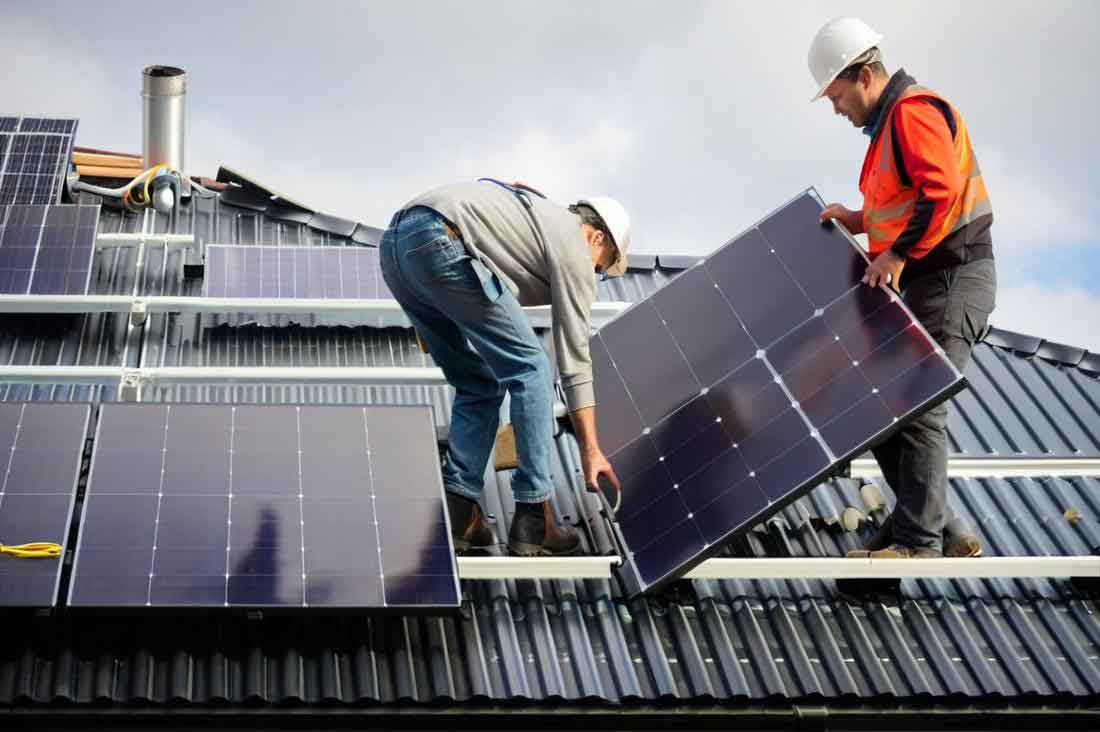
In this work, I focus on the research and application of a visual perception based system for foreign object detection on solar panels. Specifically, I address two critical challenges: (1) the low detection accuracy for small objects under multifocal imaging conditions, and (2) the lack of intelligent and efficient inspection approaches in large-scale PV plants. To tackle these issues, I propose a multi-scale feature extraction and fusion (MsFEF) method that integrates Transformer-based global feature modeling with convolutional feature fusion networks. Furthermore, I develop an intelligent inspection robot system that deploys this detection algorithm on an edge computing device, enabling autonomous detection, localization, and cleaning of foreign objects on solar panel surfaces. The proposed system has been validated through extensive experiments and real-world testing, demonstrating high precision, low misdetection rate, and practical applicability.
The main contributions of this research are summarized as follows:
1. I constructed a comprehensive dataset of PV panel surface foreign objects under multifocal imaging conditions, including various contaminants such as bird droppings and dust. The dataset contains 6,830 images with 10,602 manually annotated instances. I performed data diversification operations and analyzed the dataset characteristics to guide the design of the detection algorithm.
2. I proposed the MsFEF method, which employs the Swin Transformer as the backbone to capture multi-scale feature representations with global dependencies. A bidirectional feature pyramid network (BiFPN) is introduced to fuse multi-scale features from different layers, effectively integrating global context and local details. To improve small object detection, I also incorporated Mosaic data augmentation, Soft-NMS, and a CIoU-based loss function. Experiments show that MsFEF achieves a mean average precision (mAP) of 93.8%, outperforming other state-of-the-art methods by at least 4.9% in mAP and 15.0% in small object detection precision (mAP_S).
3. I designed and implemented a photovoltaic panel surface foreign object inspection robot system and a cloud-based software platform. The robot integrates image acquisition, edge computing, autonomous navigation, obstacle avoidance, and automatic cleaning modules. The system was tested with 200 foreign object instances, achieving an average accuracy of 98.70%, a false detection rate of 0.70%, and a missed detection rate of 0.60%.
2. Related Work
2.1 Object Detection
Object detection aims to identify and locate objects of interest in images. Traditional approaches relied on hand-crafted features such as Haar, SIFT, HOG, and DPM. However, these methods have limited generalization and robustness. Deep learning-based detectors have become dominant and are generally categorized into two-stage and one-stage approaches. Two-stage detectors, including R-CNN, Fast R-CNN, Faster R-CNN, and their variants, first generate region proposals and then classify and refine them. These methods typically achieve high accuracy but at the cost of speed. One-stage detectors, such as SSD, YOLO series, and RetinaNet, directly predict object categories and bounding boxes from feature maps, offering faster inference speed. Recent advances incorporate Transformer architectures, such as DETR and Deformable DETR, which use self-attention mechanisms to model global relationships and simplify the detection pipeline. In my method, I leverage the Swin Transformer backbone to extract hierarchical features with long-range dependencies, combined with a CNN-based feature fusion network to retain local detail information.
2.2 Small Object Detection
Small object detection is particularly challenging due to limited pixel information and the presence of background clutter. Common strategies include data augmentation, attention mechanisms, and multi-scale feature fusion. Mosaic data augmentation, introduced in YOLOv4, creates synthetic training samples by stitching four images together, which effectively increases the number of small objects in the training set. Attention mechanisms, such as SE blocks and CBAM, help the model focus on informative channels and spatial regions. Multi-scale feature fusion methods like FPN, PANet, NAS-FPN, and BiFPN integrate features from different levels to enhance the representation of small objects. In this work, I combine all three strategies to achieve robust small object detection on solar panel surfaces.
2.3 PV Panel Foreign Object Inspection
Current inspection methods include manual inspection, ground-based optical monitoring, and unmanned aerial vehicle (UAV) inspection. Manual inspection is inefficient and subjective. Ground-based optical monitoring provides continuous coverage but suffers from limited viewpoint and environmental interference. UAV inspection offers broad coverage but requires skilled operators and is restricted by weather and flight regulations. Moreover, these methods often require separate manual cleaning steps after detection. To address these limitations, I develop a ground-based intelligent inspection robot that integrates detection and cleaning, providing a continuous, automated solution for solar panel maintenance.
3. Construction of PV Panel Foreign Object Dataset
3.1 Data Collection and Annotation
To support the research, I first established a dataset specifically for foreign objects on solar panel surfaces under multifocal imaging. The data was collected from a real PV power station in Gansu province, as well as from simulated laboratory environments. The collection equipment included a GoPro action camera, a Canon EOS RP camera, and a smartphone camera. These devices were placed at different distances from the PV panels (1 to 5 meters) and operated at various focal lengths to capture images with different object scales. Videos were also recorded, and key frames were extracted every 15 frames to reduce redundancy. After initial filtering, I obtained 4,648 images. Since the actual power station had relatively few dust contamination cases, I simulated dust accumulation in the laboratory to supplement the dataset. The final dataset consists of 6,830 images, of which 4,385 contain bird droppings and 2,445 contain dust.
All images were labeled using the DarkLabel annotation tool. The annotation categories are “bird poop” and “dust,” and each bounding box is recorded in VOC XML format. I then converted the annotation files to COCO JSON format for compatibility with the detection framework. A thorough visual verification was performed to ensure label quality and consistency.
3.2 Data Diversification
To enhance the diversity and complexity of the dataset, I applied several image processing techniques. The images were randomly divided into five groups, and each group underwent one of the following operations: random rotation (90°, 180°, or 270°), random cropping, translation, brightness adjustment, and Gaussian blur. These operations simulate variations in viewing angle, position, illumination, and image sharpness that often occur in real inspection scenarios. The augmented dataset helps the model learn robust features and improves generalization under different environmental conditions.
3.3 Dataset Split and Analysis
The dataset is split into training, validation, and test sets. The training-validation set comprises 90% of the total data, and the test set comprises the remaining 10%. Within the training-validation set, the training set accounts for 80% and the validation set for 20%. Thus, there are 4,918 training images, 1,229 validation images, and 683 test images. Figure 1 (if included) illustrates the split.
I performed a statistical analysis of the dataset. The distribution of instances across categories showed an imbalance: bird poop instances were roughly twice as numerous as dust instances. This motivated the use of Mosaic data augmentation and Focal Loss to handle class imbalance. The size analysis revealed that a large majority of bounding boxes are small (less than 32×32 pixels), confirming the necessity of emphasizing small object detection. The relative positions of foreign objects are distributed fairly uniformly across the images. These insights directly informed the design of the MsFEF method.
4. Proposed MsFEF Method
4.1 Overview
The proposed multi-scale feature extraction and fusion (MsFEF) method is a one-stage object detector designed for PV panel surface foreign object detection. The overall architecture is illustrated in the following diagram (not shown here). The pipeline consists of four main parts: (1) Mosaic data augmentation for training sample enhancement, (2) a Swin Transformer backbone for multi-scale feature extraction, (3) a BiFPN neck for bidirectional weighted feature fusion, and (4) a detection head with two branches for classification and bounding box regression. Additionally, Soft-NMS is used during post-processing to remove redundant detections, and a custom loss function is designed to improve small object localization.
4.2 Mosaic Data Augmentation
Mosaic augmentation combines four training images into one composite image by randomly cropping and stitching them together. This operation is performed for every batch element, effectively multiplying the number of training samples and increasing the probability of containing small objects. The process can be described as follows: first, a batch of images is loaded. Then, for each output image, four images are randomly selected. A canvas of size \(2w \times 2h\) is created, where \(w\) and \(h\) are the original image dimensions. A random center point \((c_x, c_y)\) is chosen, and the four images are placed at the upper-left, upper-right, lower-left, and lower-right quadrants of the canvas. Each image is cropped and transformed to fit the corresponding region. The label mappings are adjusted accordingly. This augmentation strategy not only balances the dataset but also improves the robustness of the model to various object scales and backgrounds.
4.3 Swin Transformer Feature Extraction
The backbone of MsFEF is the Swin Transformer, which builds hierarchical feature maps using shifted windows. The input image is first divided into non-overlapping patches of size \(4 \times 4\), resulting in a sequence of tokens. A linear embedding layer projects each patch token to a desired dimension \(C\). The model then applies a series of stages, each consisting of patch merging layers and Swin Transformer blocks. The patch merging layers reduce the spatial resolution while increasing the channel dimension, producing feature maps at multiple scales. For an input of size \(512 \times 512 \times 3\), the feature maps output by the stages have sizes \(64 \times 64 \times 192\), \(32 \times 32 \times 384\), and \(16 \times 16 \times 768\).
The shifted window attention mechanism enables cross-window information exchange while maintaining linear computational complexity with respect to image size. Given a window size \(M\), the computational complexity of the window-based multi-head self-attention (W-MSA) and the shifted window-based multi-head self-attention (SW-MSA) are as follows:
\[
\Omega(\text{W-MSA}) = 4hwC^2 + 2M^2hwC
\]
\[
\Omega(\text{SW-MSA}) = 4hwC^2 + 2M^2hwC
\]
Both have the same complexity, which is lower than the full self-attention’s \(4hwC^2 + 2(hw)^2C\). The consecutive Swin Transformer blocks are defined as:
\[
\hat{z}^l = \text{W-MSA}(\text{LN}(z^{l-1})) + z^{l-1}
\]
\[
z^l = \text{MLP}(\text{LN}(\hat{z}^l)) + \hat{z}^l
\]
\[
\hat{z}^{l+1} = \text{SW-MSA}(\text{LN}(z^l)) + z^l
\]
\[
z^{l+1} = \text{MLP}(\text{LN}(\hat{z}^{l+1})) + \hat{z}^{l+1}
\]
This hierarchical extraction permits the model to learn global context through self-attention while preserving fine-grained local details via the shifted window partitions.
4.4 Bidirectional Weighted Feature Fusion
The extracted multi-scale features are fed into a BiFPN, which performs efficient bidirectional cross-scale feature fusion. Unlike conventional FPN, BiFPN adds a bottom-up path after the top-down path and introduces learnable weights for each input feature. For a particular layer \(P_6\), the intermediate feature \(P_6^{td}\) and the output feature \(P_6^{out}\) are computed as:
\[
P_6^{td} = \text{Conv}(\frac{w_1 \cdot P_6^{in} + w_2 \cdot \text{Resize}(P_7^{in})}{w_1 + w_2 + \epsilon})
\]
\[
P_6^{out} = \text{Conv}(\frac{w_1′ \cdot P_6^{in} + w_2′ \cdot P_6^{td} + w_3′ \cdot \text{Resize}(P_5^{out})}{w_1′ + w_2′ + w_3′ + \epsilon})
\]
Here, \(\text{Resize}\) denotes upsampling or downsampling to match resolutions, and \(\text{Conv}\) denotes a convolution operation. The weights \(w_i\) are learned during training, allowing the network to dynamically balance the importance of different input features. This mechanism significantly improves the representation of small objects by fusing high-resolution (shallow) features containing spatial details with low-resolution (deep) features carrying semantic information.
4.5 Soft-NMS and Loss Function
During inference, a standard NMS can suppress true positive detections when objects overlap. To avoid this, I apply Soft-NMS, which decays the confidence scores of highly overlapping bounding boxes rather than discarding them entirely. The Gaussian penalty function is used:
\[
S_i = S_i \cdot e^{-\frac{\text{IoU}(M, b_i)^2}{\sigma}}, \quad \forall b_i \notin \text{suppressed}
\]
The loss function in MsFEF consists of a classification loss and a regression loss. The classification branch uses the Focal Loss to handle class imbalance:
\[
\text{Focal}(p_t) = -\alpha_t (1 – p_t)^\gamma \log(p_t)
\]
where \(\alpha_t\) and \(\gamma\) are hyperparameters (set to 0.25 and 2.0, respectively). The regression branch uses CIoU loss, which considers the overlap area, center point distance, and aspect ratio consistency between the predicted and ground-truth bounding boxes. The CIoU loss is defined as:
\[
L_{\text{CIoU}} = 1 – \text{IoU} + \frac{\rho^2(\mathbf{b}, \mathbf{b}^{gt})}{c^2} + \alpha v
\]
where
\[
\alpha = \frac{v}{(1 – \text{IoU}) + v}, \quad v = \frac{4}{\pi^2}(\arctan\frac{w^{gt}}{h^{gt}} – \arctan\frac{w}{h})^2
\]
The total loss is the weighted sum of classification and regression losses:
\[
L_{\text{total}} = \lambda_1 L_{\text{cls}} + \lambda_2 L_{\text{bbox}}
\]
In my experiments, both \(\lambda_1\) and \(\lambda_2\) are set to 1.
5. Experiments and Results
5.1 Implementation Details
The proposed method is implemented using PyTorch and trained on the constructed dataset. Table 1 lists the key parameter settings.
| Parameter | Value |
|---|---|
| Input image size | 512 × 512 × 3 |
| Epochs | 200 |
| Window size (Swin) | 7 |
| Embedding dimension | 96 |
| BiFPN input channels | 192, 384, 768 |
| Batch size | 8 |
| Learning rate | 0.0001 (with decay) |
The training process showed stable convergence after around 20 epochs, with gradual improvements thereafter. The learning rate was reduced at epoch 150 to further refine the model.
5.2 Evaluation Metrics
I used the standard COCO metrics: mAP at IoU 0.5 (mAP@0.5), and mAP for small (mAP_S), medium (mAP_M), and large (mAP_L) objects. The small objects are those with an area less than 32×32 pixels, medium objects between 32×32 and 96×96 pixels, and large objects greater than 96×96 pixels. For these size-specific metrics, mAP is averaged over IoU thresholds from 0.5 to 0.95 with a step of 0.05.
5.3 Comparison with State-of-the-Art Methods
I compared MsFEF with several existing detectors, including SSD, RetinaNet, FCOS, YOLOX, and Deformable DETR. All methods were trained under the same conditions. The results are presented in Table 2.
| Method | mAP (%) | mAP_S (%) | mAP_M (%) | mAP_L (%) |
|---|---|---|---|---|
| SSD | 76.9 | 11.8 | 63.2 | 77.4 |
| RetinaNet | 79.3 | 17.1 | 63.5 | 83.6 |
| FCOS | 79.0 | 17.6 | 74.9 | 87.1 |
| YOLOX | 85.3 | 26.4 | 65.7 | 73.3 |
| Deformable DETR | 88.9 | 28.5 | 65.2 | 80.3 |
| MsFEF | 93.8 | 43.3 | 75.3 | 86.1 |
The results show that MsFEF achieves the highest mAP, mAP_S, and mAP_M. Specifically, it improves mAP by at least 4.9% over Deformable DETR, and mAP_S by at least 15.0%. The large object mAP is slightly lower than FCOS, which may be due to the model’s focus on small object features, but the overall performance is superior.
5.4 Ablation Study
To evaluate the contribution of each component, I conducted an ablation study. The baseline uses a ResNet-style backbone with FPN and conventional NMS. The results are shown in Table 3.
| Swin Transformer | BiFPN | Soft-NMS | CIoU | mAP (%) | mAP_S (%) | mAP_M (%) | mAP_L (%) |
|---|---|---|---|---|---|---|---|
| – | – | – | – | 75.2 | 11.7 | 52.6 | 68.8 |
| √ | – | – | – | 85.2 | 26.0 | 68.6 | 84.1 |
| √ | √ | – | – | 88.3 | 30.1 | 68.7 | 81.0 |
| √ | √ | √ | – | 91.0 | 35.3 | 69.2 | 86.1 |
| √ | √ | √ | √ | 93.8 | 43.3 | 75.3 | 86.1 |
Each module contributes positively to the overall performance. Swin Transformer brings a 10% improvement in mAP, Boosting small object detection by 14.3%. BiFPN further improves mAP by 3.1%, and Soft-NMS by 2.7%. The CIoU loss significantly enhances small object localization, improving mAP_S by 8.2% while maintaining large object accuracy.
5.5 Qualitative Results
I visualized the detection results on test images. The model accurately detects thick dust, thin dust, streak-like bird droppings, scattered bird droppings, and block-like bird droppings. These qualitative results confirm the robustness of MsFEF in real-world scenarios.
6. Intelligent Inspection Robot System and Platform
6.1 System Architecture
To bring the detection method into practical application, I designed and developed an intelligent inspection robot for solar panel surface foreign object detection and cleaning. The system consists of hardware components and a software platform. The hardware includes five functional modules: image acquisition, foreign object detection and cleaning, motion control, localization and obstacle avoidance, and communication.
Figure (placeholder) shows the overall hardware architecture. The robot is equipped with a high-definition varifocal camera (Sony FCB-EV7520) mounted on a pan-tilt unit. The camera supports 32x optical zoom, allowing multifocal imaging. The robot also carries a laser rangefinder for distance measurement, a cleaning nozzle for foreign object removal, and a telescopic bracket to adjust the height. A foldable solar panel on top provides supplementary power. The main computation is performed by an NVIDIA Jetson Orin NX edge computing device, which runs the MsFEF model. For navigation, the robot uses a 16-line LiDAR (RS-LiDAR-16), a depth camera (Intel RealSense D435i), and ultrasonic radar sensors. The robot base is a tracked chassis (Komodo-03) with two DC brushless motors, providing stable movement on uneven terrain.
6.2 Image Acquisition Module
The Sony FCB-EV7520 camera is connected to the edge device via a 5G router using Gigabit Ethernet. Control commands (e.g., zoom, focus) are sent through RS485. The camera parameters are summarized in Table 4.
| Parameter | Value |
|---|---|
| Sensor | 1/2.8″ Exmor CMOS |
| Max resolution | 1920 × 1080 |
| Focal length | 4.3 – 129.0 mm |
| Optical zoom | 32× |
| F number | F1.6 – F4.7 |
| Shutter speed | 1/1 – 1/10000 s (22 steps) |
| Focus | Auto / Manual / Interval |
| Output | RJ45 Ethernet |
| Communication | RS485 |
6.3 Foreign Object Detection and Cleaning Module
This module is the core of the system. The workflow is as follows:
1. The robot moves along a predefined route and captures PV panel images with the camera.
2. The edge device runs the MsFEF model to detect foreign objects. If an object is found, the camera adjusts its focal length so that the object occupies a suitable portion of the frame.
3. The model outputs the bounding box coordinates \((x, y, w, h)\). The center of the bounding box is calculated as \((x + \frac{w}{2}, y + \frac{h}{2})\).
4. The laser rangefinder emits a beam toward the center point to measure the distance.
5. The cleaning nozzle is activated with appropriate pressure and duration based on the measured distance. The system monitors the cleaning status. If the object is successfully removed, the robot continues its patrol. Otherwise, it records the position of the PV panel and uploads the information and image for later manual intervention.
The edge device used is the NVIDIA Jetson Orin NX. Table 5 lists its key specifications.
| Parameter | Value |
|---|---|
| AI performance | 70 TOPS |
| GPU | 1024-core NVIDIA Ampere |
| CPU | 6-core Arm Cortex-A78AE |
| Memory | 8 GB LPDDR5 |
| Storage | External NVMe |
| Power | 10–20 W |
The MsFEF model was deployed on this device after verifying compatibility of CUDA, cuDNN, and PyTorch versions. The model size is about 42.55M parameters and the computational cost is 59.53 GFLOPs for a 512×512 input, which is well within the capabilities of the Jetson Orin NX.
6.4 Motion Control and Navigation
The robot adopts a tracked chassis driven by two DC brushless motors. The edge device communicates with the chassis via RS232. The chassis has a rated load of 125 kg and a speed range of 0–6.5 km/h, suitable for outdoor PV plants. For navigation, the LiDAR performs SLAM to build a map of the environment and localize the robot. The depth camera and ultrasonic radar provide close-range obstacle detection, ensuring safe operation. The sensor fusion enables the robot to avoid both static and dynamic obstacles.
6.5 Communication Module
A 5G wireless router connects all devices in a local network. The edge device communicates with the cloud server through this router. Image data is transmitted using HTTP, video streams use RTSP, and other data is sent via TCP/IP. The cloud server stores the data in a MySQL database and serves the visualization platform.
6.6 Software Platform
The software platform follows a layered architecture: presentation layer, business layer, data layer, persistence layer, and runtime environment. The front-end uses HTML, CSS, Vue, and LayUI, while the back-end is built on Spring Boot 2.0 with MyBatis for object-relational mapping. The platform provides functionalities such as real-time monitoring of the inspection process, viewing detection results, managing alert information, and visualizing statistics. A sample dashboard shows the number of detected foreign objects, cleaned objects, pending manual cleaning objects, and the clean status of each PV panel area.
6.7 System Testing and Performance
Before the full system test, I verified the image acquisition module by sending control commands to the pan-tilt and camera. The camera successfully adjusted its orientation and focal length, confirming reliable communication.
For the overall system test, I prepared 200 foreign object instances (100 bird droppings and 100 dust) across 10 experiments. The system captured images, executed the detection algorithm, and recorded correct detections, false detections, and missed detections. The results are shown in Table 6.
| Experiment | Correct (count) | False (count) | Miss (count) | Accuracy (%) | False rate (%) | Miss rate (%) |
|---|---|---|---|---|---|---|
| 1 | 197 | 1 | 2 | 98.5 | 0.5 | 1.0 |
| 2 | 199 | 0 | 1 | 99.5 | 0.0 | 0.5 |
| 3 | 196 | 1 | 3 | 98.0 | 0.5 | 1.5 |
| 4 | 198 | 0 | 2 | 99.0 | 0.0 | 1.0 |
| 5 | 196 | 3 | 1 | 98.0 | 1.5 | 0.5 |
| 6 | 199 | 1 | 0 | 99.5 | 0.5 | 0.0 |
| 7 | 197 | 2 | 1 | 98.5 | 1.0 | 0.5 |
| 8 | 195 | 3 | 2 | 97.5 | 1.5 | 1.0 |
| 9 | 198 | 2 | 0 | 99.0 | 1.0 | 0.0 |
| 10 | 199 | 1 | 0 | 99.5 | 0.5 | 0.0 |
| Average | 197.4 | 1.4 | 1.2 | 98.70 | 0.70 | 0.60 |
The average accuracy of 98.70%, false detection rate of 0.70%, and missed detection rate of 0.60% demonstrate that the developed system effectively meets the requirements for high-precision and high-efficiency inspection of solar panel surface foreign objects.
7. Conclusion and Future Work
In this work, I presented a comprehensive study on visual perception based foreign object detection on solar panels. The main contributions include: (1) a new multifocal imaging dataset for PV panel surface foreign objects, (2) the MsFEF detection method that achieves state-of-the-art performance, especially for small objects, and (3) an intelligent robot system and software platform that integrate the detection algorithm for autonomous inspection and cleaning. Experimental validation on the dataset showed that MsFEF outperforms previous methods by a significant margin. The deployed robot system achieved an average detection accuracy of 98.70% in practical tests, confirming its practical applicability in real PV power plants.
In the future, I plan to explore model compression and lightweighting to further reduce the computational cost, enabling deployment on even more resource-constrained edge devices. Additionally, I intend to investigate accelerated inference techniques, such as TensorRT and quantization, to enhance real-time performance while maintaining high detection accuracy. Another promising direction is the extension of the current method to other types of surface defects, such as cracks and hot spots, using multimodal data fusion, including thermal images and electrical measurements. Finally, I aim to improve the cleaning mechanism by integrating adaptive pressure control and feedback from the detection module, potentially allowing for more energy-efficient and thorough cleaning operations.