
In the context of large-scale photovoltaic deployment, distributed PV systems have gained widespread adoption due to their flexible installation and local energy consumption advantages. The grid-tied inverter, as the core hub of energy conversion, is exposed to harsh outdoor environments—high temperature, grid fluctuations, and component aging—making it prone to faults. These faults not only cause a sharp drop in generation efficiency but may also jeopardize grid safety. Traditional diagnostic methods suffer from slow response and low accuracy, failing to meet the reliability demands of modern systems. In my research, I focus on fault characteristics and fast diagnostic techniques for grid-tied inverters, which are one of the most critical types of solar inverters. By analyzing fault types, constructing identification models, and optimizing diagnostic algorithms, I aim to achieve precise and rapid fault localization, providing technical support for PV system operation and maintenance. This work holds significant engineering value.
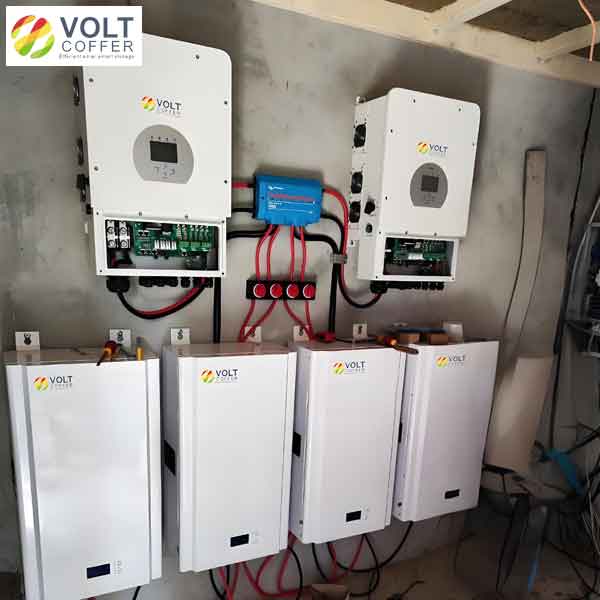
1. Working Principle and Core Components of Distributed PV Grid-Tied Inverters
The distributed PV grid-tied inverter serves as the critical interface between the PV array and the utility grid. Its primary function is to convert low-voltage DC power generated by solar panels into three-phase AC power compliant with national grid standards through a DC/AC conversion stage. A closed-loop control system continuously monitors key signals such as input/output current, voltage, and power factor, regulating the switching frequency of IGBTs in the power module to achieve high-quality output, ensuring that the grid-connected current maintains the same frequency and phase as the grid voltage, thereby preventing harmonic pollution.
Core components are organized around power conversion and control functions:
- Power control board: integrating MCU and DSP chips, responsible for real-time regulation of output power, voltage, and grid connection status.
- Current sensors: based on Hall effect, monitoring current fluctuations and providing feedback signals.
- Power module: the core element for power conversion.
- Thermal management system: comprising cooling fans, heat sinks, and temperature control switches.
These components communicate via CAN bus or Ethernet, forming the stable operation foundation of the inverter. Among the various types of solar inverters, the grid-tied inverter is the most widely deployed in distributed systems, and its reliability directly affects overall system performance.
2. Typical Fault Types of Distributed PV Grid-Tied Inverters
During long-term outdoor operation, inverters are susceptible to high temperature, humidity, grid disturbances, and component aging, leading to several typical faults. These faults are critical for all types of solar inverters, but particularly for grid-tied units due to their direct connection to the grid.
| Fault Type | Symptoms | Root Causes |
|---|---|---|
| IGBT module fault | Power drop, high-frequency noise, overheating, shutdown | Open circuit, short circuit, parameter drift |
| Control unit fault | Frequent shutdown, large output voltage fluctuation | Capacitor bulging, copper wire oxidation, sensor signal distortion, unstable switching power supply |
| Overheating & cooling system fault | IGBT junction temperature rise, efficiency drop | Fan bearing wear, heat sink dust accumulation, temperature sensor accuracy degradation |
3. Fault Feature Extraction and Quantitative Characterization
Fault feature extraction relies on electrical signals and state parameters during inverter operation. I use a high-speed data acquisition card to synchronously capture three-phase output currents, voltages, IGBT temperature, and fan speed. After preprocessing to eliminate grid harmonics and electromagnetic interference, I analyze deviations between actual current/voltage waveforms and ideal sinusoids.
Quantitative characterization is achieved through a fault feature coefficient model. The diagnostic coefficient \(F_{\text{diag}}\) is defined as:
$$
F_{\text{diag}} = \sum_{i=1}^{n} W_i \cdot \theta_i \cdot \frac{\int_{t_0}^{t_0+T} \left( I_{\text{out}}(t) – I_{\text{ideal}}(t) \right)^2 dt}{\int_{t_0}^{t_0+T} I_{\text{ideal}}^2(t) dt}
$$
where \(W_i\) is the weighting coefficient for different fault types, and \(\theta_i\) is the influence factor. When \(F_{\text{diag}}\) exceeds a preset threshold (e.g., 0.15), a severe fault is indicated.
For IGBT faults, I use a power output decay model:
$$
P_{\text{fault}} = \eta_{\text{IGBT}} \cdot V_{\text{in}} \cdot I_{\text{out}} \cdot e^{-\lambda t}
$$
where \(\eta_{\text{IGBT}}\) is the fault coefficient and \(\lambda\) is the decay rate. For control unit faults, the feedback error model is:
$$
E_{\text{cnl}} = \left| V_{\text{out}}(t) – K \cdot V_{\text{in}}(t) \right| \cdot \gamma \cdot \delta_{\text{feedback}}
$$
where \(K\) is the ideal voltage ratio, \(\gamma\) is the influence factor, and \(\delta_{\text{feedback}}\) is the feedback stability coefficient.
| Parameter | Description | Normal Range | Fault Threshold |
|---|---|---|---|
| \(F_{\text{diag}}\) | Fault diagnostic coefficient | ≤0.08 | ≥0.15 |
| \(\lambda\) (IGBT decay) | Power decay rate | ≤0.001/h | ≥0.005/h |
| \(E_{\text{cnl}}\) | Control feedback error | ≤0.05 | ≥0.12 |
4. Fault Feature Identification Techniques for Grid-Tied Inverters
4.1 Signal Analysis Based Identification
The signal analysis method focuses on electrical signals such as current and voltage. Using Fourier transform and wavelet analysis, I monitor waveform distortion, harmonic content, and abrupt changes. A FPGA-based real-time acquisition system samples three-phase currents and voltages at a fixed rate. I use LabVIEW to build an ideal waveform database and compare actual waveforms with the ideal. This method captures early subtle changes, such as gradual increase in total harmonic distortion (THD). I also employ infrared thermography to monitor IGBT surface temperature, cross-validating with electrical signals to identify power module faults.
4.2 Data-Driven Identification Model
Data-driven models use historical operation data and typical fault cases as training sets. Machine learning and deep learning algorithms quantify nonlinear relationships between fault features and equipment status. The previously described models—\(F_{\text{diag}}\), \(P_{\text{fault}}\), and \(E_{\text{cnl}}\)—fall into this category. The construction process includes data preprocessing (cleaning, Z-score normalization), feature engineering (selecting key features via correlation analysis), model training (using random forest classifier to determine weights and coefficients), and validation. For instance, as IGBT module aging progresses, \(F_{\text{diag}}\) gradually increases from normal (~0.02) to fault state (~0.18), consistent with current waveform error trends. Tests on multiple fault cases show identification accuracy above 95% with controlled false alarm rates.
4.3 Multi-Dimensional Feature Fusion Strategy
To overcome the limitations of single-feature identification in terms of comprehensiveness and anti-interference, I develop a multi-dimensional fusion strategy. It systematically integrates three core feature categories: electrical signals (current, voltage), temperature (IGBT module surface temperature and its rate of change), and equipment operational status (cooling system state, feedback stability). The fusion architecture operates at both feature level and decision level.
I use Dempster-Shafer (D-S) evidence theory to perform weighted fusion of these multi-dimensional features. This theory effectively handles uncertainties between features, converting various monitoring data into a unified fault confidence indicator. For example, in diagnosing a control unit fault, I first compute the voltage deviation using the feedback error model, then combine this with power supply voltage stability and control circuit continuity checks, and finally correlate with output power fluctuations and shutdown frequency. When the feedback error exceeds the threshold accompanied by increased voltage ripple and frequent power swings, a control unit fault can be precisely pinpointed—often traced to capacitor bulging or sensor distortion.
5. Fast Diagnostic Technology for Grid-Tied Inverters
5.1 Fast Diagnostic Model Construction
The fast diagnostic model is built upon the internal relationship between fault features and equipment status. Based on the fault feature coefficient model, IGBT power decay model, and control feedback error model, I establish a three-stage diagnostic framework: “feature extraction → status assessment → fault localization”.
Through multiple fault simulation experiments under different operating conditions, I define characteristic parameter ranges for typical faults (IGBT faults, control faults, cooling faults). Statistical analysis determines thresholds: for example, the normal threshold of \(F_{\text{diag}}\) is ≤0.08, warning range is 0.08–0.15, and fault is ≥0.15. For IGBT power decay, \(\lambda\) normal is ≤0.001/h, and severe aging is flagged when λ ≥0.005/h. I also build a mapping database linking fault types to characteristic parameters for rapid matching.
For a 1500V high-voltage inverter using an Infineon F3L400R10W3S7_B11 module, I optimize key parameters (proportional coefficient \(K\), fault influence factor \(\gamma\)) through simulation to ensure model-device compatibility.
5.2 Diagnostic Algorithm Optimization and Implementation
Algorithm optimization focuses on improving identification speed and accuracy by simplifying computation, optimizing parameter iteration, and improving data processing. I adopt an “edge computing + cloud collaboration” architecture: edge units handle real-time data acquisition and preliminary analysis to reduce latency, while the cloud platform performs model training and parameter updates.
For integral operations in the fault feature coefficient model, I replace the traditional Simpson integration with the trapezoidal rule, improving computational efficiency. I use gradient descent with adaptive learning rate to optimize parameter iteration, reducing the number of iterations for faster convergence. The algorithm trigger mechanism uses two-level diagnostic thresholds:
- Level 1 (fast diagnosis): activated when current THD exceeds 3% or \(F_{\text{diag}}\) > 0.06.
- Level 2 (deep diagnosis): activated when THD exceeds 5% or \(F_{\text{diag}}\) > 0.12, automatically invoking dedicated identification models for the corresponding fault type.
5.3 Fault Localization and Diagnostic Effectiveness Validation
Fault localization follows a three-level progressive procedure: “signal analysis → model calculation → physical inspection”. First, the diagnostic algorithm analyzes real-time electrical signals and state parameters to determine the approximate fault type and output probability distribution. Then, precise physical inspections are performed: infrared thermography scans the IGBT module to locate overheating regions; an oscilloscope checks gate drive signal integrity; current sensor faults are tested by injecting a standard current and comparing output linearity; control board faults are verified by reading MCU operation logs and measuring key node voltages with a multimeter.
Diagnostic effectiveness is validated by comparing performance data before and after repair, along with long-term operation monitoring. In a case study of a 150kW PV system, before repair the output current fluctuated between 28.5A and 35.2A, THD was 13.2%, the fault diagnostic coefficient was 0.180, and system efficiency was only 92.3%. After replacing the faulty IGBT module and repairing the control circuit, the output current stabilized at 33.1A ± 0.2A, THD dropped below 0.5%, \(F_{\text{diag}}\) decreased to 0.022, and system efficiency recovered to 99.5%. The detailed results for different fault types are summarized in Table 3.
| Fault Type | Pre-Repair \(F_{\text{diag}}\) | Pre-Repair THD | Pre-Repair Current Range (A) | Pre-Repair Efficiency | Response Time (ms) | Post-Repair \(F_{\text{diag}}\) | Post-Repair THD | Post-Repair Current Range (A) | Post-Repair Efficiency |
|---|---|---|---|---|---|---|---|---|---|
| IGBT open circuit | 0.180 | 13.2% | 28.5–35.2 | 92.3% | 65 | 0.022 | 0.4% | 33.0–33.3 | 99.6% |
| IGBT parameter drift | 0.105 | 5.8% | 31.2–34.1 | 95.7% | 58 | 0.031 | 0.6% | 32.9–33.2 | 99.4% |
| Control unit capacitor bulging | 0.123 | 8.5% | 29.8–35.7 | 94.1% | 72 | 0.028 | 0.5% | 33.0–33.3 | 99.5% |
| Cooling fan fault | 0.098 | 4.2% | 32.1–33.9 | 96.5% | 61 | 0.035 | 0.7% | 32.9–33.2 | 99.3% |
| Current sensor signal distortion | 0.112 | 7.3% | 30.5–34.8 | 95.2% | 68 | 0.025 | 0.4% | 33.0–33.3 | 99.7% |
| Control board power instability | 0.135 | 9.6% | 29.2–36.1 | 93.8% | 75 | 0.027 | 0.6% | 32.8–33.3 | 99.5% |
Across 20 fault cases, the localization accuracy reached 96%, and the diagnostic response time was consistently ≤80ms. After repair, all systems operated stably for over three months. Continuous data collection further optimizes the model parameters, enhancing diagnostic versatility and reliability for various types of solar inverters.
6. Conclusion
I have systematically studied fault characteristics and fast diagnostic technology for distributed PV grid-tied inverters. By clarifying the failure mechanisms of core components, I established a multi-dimensional fault feature extraction and quantitative system. Combining signal analysis and data-driven methods, I constructed a diagnostic model with optimized algorithms that effectively improves fault identification accuracy and speed. Practical validation shows that this technology can precisely locate fault types, significantly reduce diagnosis time, and boost operation and maintenance efficiency. Although some limitations remain—such as model adaptability under extreme conditions—future work could integrate IoT technology to expand data sources and further enhance model generalization, providing more comprehensive support for the reliable operation of all types of solar inverters.