
Solar energy has emerged as one of the most promising renewable energy sources due to its cleanliness, abundance, and sustainability. In modern photovoltaic (PV) power generation systems, the solar inverter plays a central role in converting the direct current (DC) produced by PV panels into high-quality alternating current (AC) for grid integration or local loads. However, the solar inverter operates under variable environmental conditions and complex electrical stresses, making it one of the most failure-prone components in the entire PV system. In particular, the insulated gate bipolar transistor (IGBT) power switches inside the solar inverter are vulnerable to open-circuit faults, which can lead to waveform distortion, reduced power quality, and even cascading failures if not detected and handled promptly.
In this thesis, I focus on developing intelligent fault diagnosis methods for open-circuit faults of IGBTs in a two-level solar inverter. I first construct a comprehensive simulation model of a PV generation system using MATLAB/Simulink. Then I collect DC-side current signals under various fault conditions. Based on the collected data, I propose two deep learning based diagnosis frameworks: the first one combines data preprocessing (DP) with convolutional neural networks (CNN) and long short-term memory (LSTM) networks, while the second one further integrates an attention mechanism and Bayesian optimization to enhance robustness and accuracy. Extensive experiments demonstrate that the proposed methods achieve superior diagnostic performance under both noise-free and noisy conditions.
1. Introduction and Background
The global installation capacity of photovoltaic systems has been growing rapidly. According to recent statistics, the total installed solar capacity in China has exceeded 390 GW, with annual new additions surpassing 87 GW in 2022. Such rapid expansion brings increasing demand for reliable operation and maintenance of solar inverter systems. The solar inverter must handle fluctuating irradiance and temperature, grid disturbances, and load variations, which impose severe thermal and electrical stresses on power semiconductor devices. Among all components in a PV system, the power switching devices, especially IGBTs, have the highest failure rate. Therefore, accurate and timely fault diagnosis of IGBTs is critical to ensure the safety and efficiency of solar power plants.
Fault diagnosis techniques for solar inverters can be broadly categorized into three classes: signal processing based methods, model based methods, and data driven methods. Signal processing methods rely on analyzing current, voltage, or power signals in the time-frequency domain through tools such as wavelet transform and empirical mode decomposition. Model based methods require a mathematical model of the system and use observers or filters to generate residuals. However, these methods often demand expert knowledge and are difficult to scale to complex systems. With the rapid progress of artificial intelligence, data driven methods based on deep learning have become increasingly popular because they can automatically learn high-level features from raw data without explicit physical models.
In this work, I adopt a data driven approach. I use the DC-side current of the solar inverter as the diagnostic signal because it contains rich fault signature information and can be acquired with fewer sensors compared to three-phase AC signals. By applying empirical mode decomposition (EMD) and principal component analysis (PCA) as preprocessing steps, I effectively extract meaningful components and reduce dimensionality. Then I design a combined CNN-LSTM network to capture both local spatial features and temporal dependencies. To further improve the robustness against noise and environmental variation, I modify the network architecture by incorporating a Squeeze-and-Excitation (SE) attention mechanism, which enables the model to focus on informative channels and ignore irrelevant information. In addition, I employ Bayesian optimization to automatically determine the optimal hyperparameters, avoiding tedious manual tuning.
2. Photovoltaic System Modeling and Data Acquisition
2.1 System Configuration
The main circuit topology of the solar inverter is a two-level three-phase voltage source inverter with six IGBT switches. The PV array supplies DC power to the inverter through a boost converter. An MPPT (Maximum Power Point Tracking) algorithm adjusts the operating point to extract maximum power from the PV panels. The inverter converts the DC voltage into three-phase AC voltage and current, which are then connected to the grid or local loads through an LCL or LC filter. The electrical parameters of the system include a DC bus voltage of about 700 V, a grid frequency of 50 Hz, a filter resistance of 0.1 Ω, and a filter inductance of 2 mH.
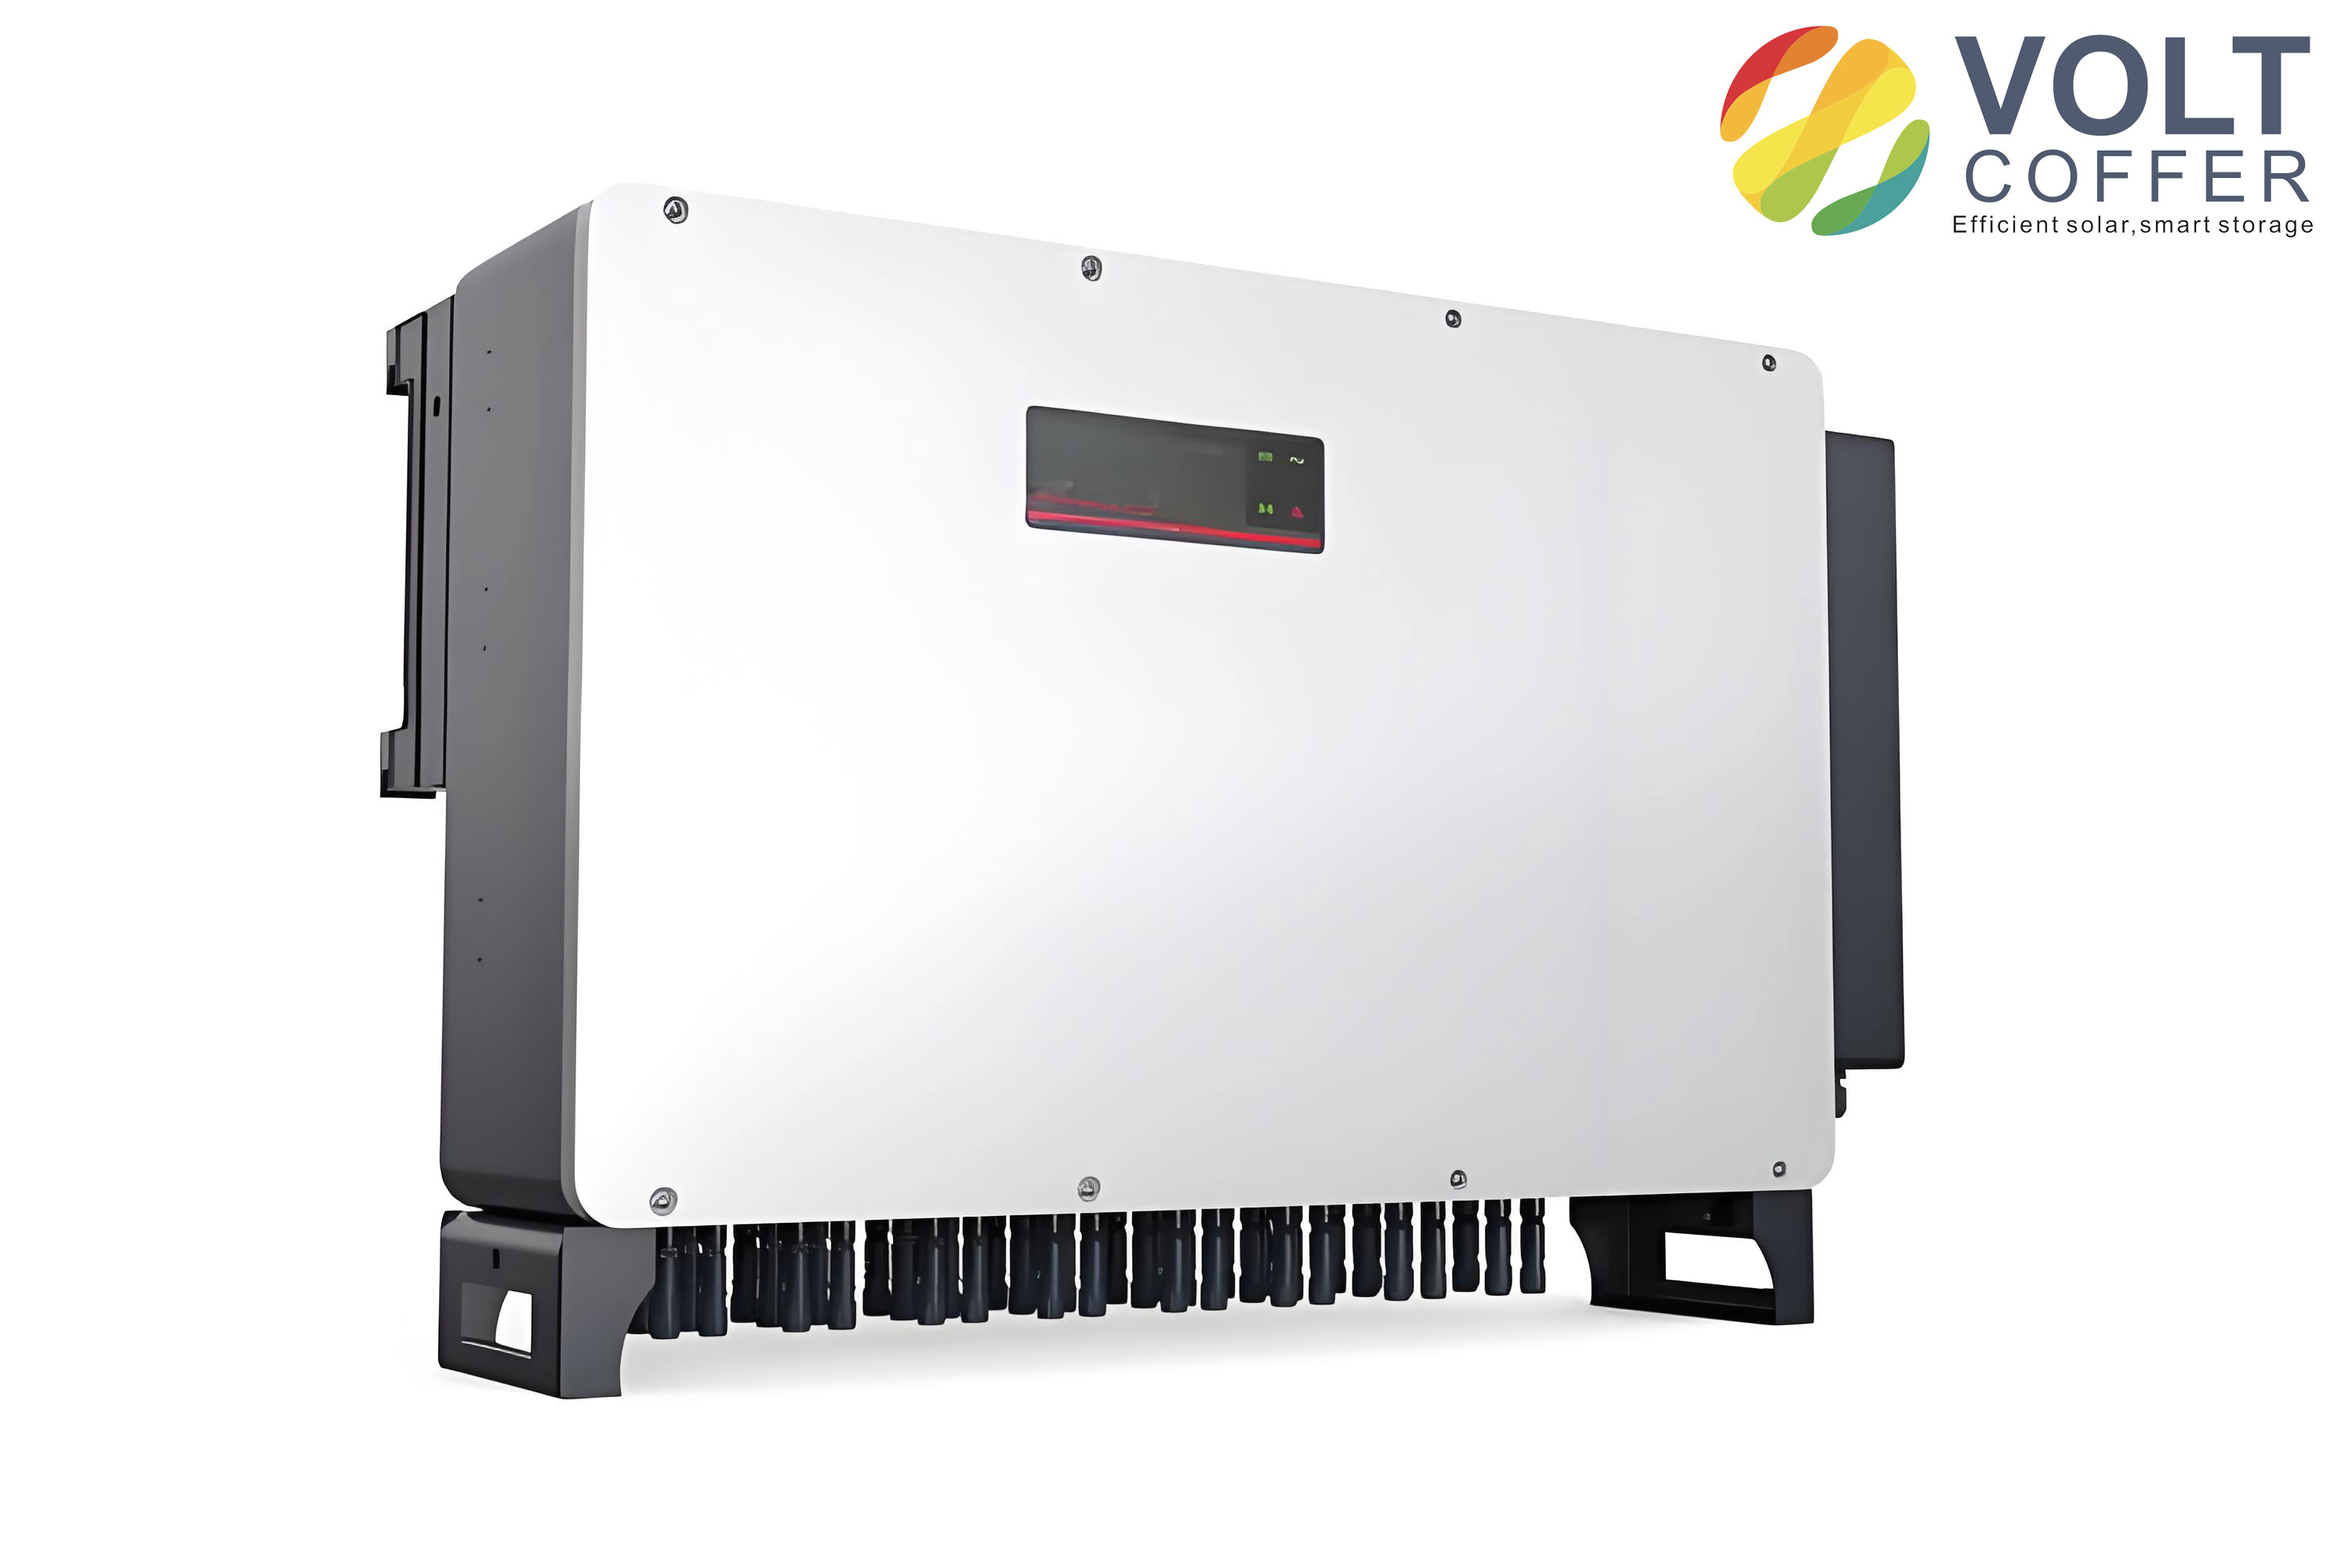
To simulate realistic operating conditions, I vary the irradiance from 700 W/m² to 1000 W/m² and the temperature from 25 °C to 30 °C at t = 0.2 s. The closed-loop control system is designed to maintain stable voltage and current output despite these disturbances. The following figure illustrates a typical solar inverter used in PV systems.
2.2 MPPT and Closed-Loop Control
The MPPT module dynamically adjusts the duty cycle of the boost converter to track the maximum power point (MPP) of the PV array. In my simulation, I use the Perturb and Observe (P&O) algorithm, which perturbs the operating voltage and observes the change in output power. If the power increases, the perturbation direction is maintained; otherwise, it is reversed. The MPPT block continuously updates the reference voltage to keep the system operating at the MPP.
In addition to MPPT, a double closed-loop control strategy is implemented to regulate the DC bus voltage and the AC output current. The outer voltage loop compares the measured DC bus voltage \(V_{dc}\) with the reference value \(V_{dc}^*\). The error is processed by a PI controller to generate the reference d-axis current \(i_d^*\). The inner current loop regulates the d-q axis currents using PI controllers to generate the modulation signals for the SPWM generator. The control equations are given by:
$$ V_{dc}^* – V_{dc} \xrightarrow{PI} i_d^* $$
$$ i_d^* – i_d \xrightarrow{PI} v_d, \quad i_q^* – i_q \xrightarrow{PI} v_q $$
where \(v_d\) and \(v_q\) are the voltage commands in the synchronous reference frame. This double-loop control ensures fast dynamic response and good steady-state performance.
2.3 Feasibility Verification
To verify the correctness of the constructed PV system model, I observe the DC bus voltage and the three-phase AC output waveforms. The DC bus voltage remains stable around 700 V except for a short transient at t = 0.2 s due to the sudden change in irradiance and temperature. The three-phase AC voltages and currents exhibit sinusoidal waveforms with constant amplitude and frequency. I also evaluate the total harmonic distortion (THD) of the output voltage using the FFT analysis tool in Simulink. The THD is calculated as:
$$ THD = \frac{\sqrt{\sum_{n=2}^{H} G_n^2}}{G_1} \times 100\% $$
where \(G_n\) is the RMS value of the \(n\)-th harmonic component and \(G_1\) is the RMS value of the fundamental component. The measured THD is 0.90% for the output voltage, which is well below the standard limit of 5%. This confirms that the simulation model satisfies the power quality requirements and can be used as a reliable platform for fault simulation.
2.4 IGBT Open-Circuit Fault Classification
IGBT faults in the solar inverter can be classified into short-circuit faults and open-circuit faults. Short-circuit faults typically cause overcurrent and are often handled by hardware protection circuits such as fuses. Open-circuit faults, on the other hand, do not immediately cause system shutdown. Instead, they lead to distorted output waveforms, increased current stress on other components, and reduced power quality. If not detected in time, open-circuit faults may result in secondary failures. Therefore, this thesis focuses on open-circuit faults of IGBTs.
For a two-level three-phase inverter, there are six IGBT switches \(T_1, T_2, T_3, T_4, T_5, T_6\). Open-circuit faults can be classified into single-switch faults and double-switch faults. Single-switch faults include any one of the six IGBTs being open-circuited. Double-switch faults can be further categorized into three types: single-phase faults (faults in the same phase leg), same-side faults (both switches on the same side of different phases), and opposite-side faults (switches on different sides of different phases). Including the normal condition, there are 22 possible operating states in total. The detailed classification is shown in the following table.
| Fault location | Fault type | Faulty switches |
|---|---|---|
| Single switch | Single-switch fault | T1, T2, T3, T4, T5, or T6 |
| Double switches | Same-side fault | T1-T3, T1-T5, T3-T5, T2-T4, T2-T6, T4-T6 |
| Single-phase fault | T1-T2, T3-T4, T5-T6 | |
| Opposite-side fault | T1-T4, T1-T6, T3-T6, T2-T3, T2-T5, T4-T5 |
2.5 Data Acquisition
To simulate IGBT open-circuit faults, I control the gate signals of the six IGBTs in the simulation model. By setting the gate signal to zero, the corresponding switch is turned off permanently, which mimics an open-circuit fault. I set the sampling frequency to 10 kHz and record the DC-side current over a time window from 0.25 s to 0.45 s, yielding 2000 data points per sample. For each of the 22 operating conditions (one normal and 21 faulty), I collect multiple samples to form a dataset. In total, the dataset contains 44,000 data samples, with each sample having a length of 2000. The data are saved in Excel format for further processing.
The DC-side current waveforms under different fault conditions show distinct patterns. Under normal operation, the DC-side current is almost constant with small ripples. When an open-circuit fault occurs, the current waveform becomes distorted, and the shape of the distortion depends on the fault type. For example, a single-switch fault in the upper or lower arm produces an asymmetric positive or negative half-cycle distortion. Double-switch faults produce more complex patterns, but still contain unique signatures that can be learned by the neural network.
3. Fault Diagnosis Based on DP-CNN-LSTM
3.1 Data Preprocessing: EMD and PCA
The raw DC-side current signal is a non-stationary time series that contains noise and complex transient components. Directly feeding such raw data into a classifier may lead to poor performance because the relevant fault features are buried in irrelevant fluctuations. Therefore, I first apply empirical mode decomposition (EMD) to decompose the signal into a finite number of intrinsic mode functions (IMFs) and a residual term. EMD is a fully data-adaptive method that does not require a predetermined basis function. The decomposition process can be summarized as follows:
1. Identify all local maxima and minima of the original signal \(x(t)\).
2. Construct the upper envelope \(e_{up}(t)\) and lower envelope \(e_{low}(t)\) using cubic spline interpolation.
3. Compute the mean envelope \(m(t) = (e_{up}(t) + e_{low}(t))/2\).
4. Subtract the mean from the original signal to obtain \(h(t) = x(t) – m(t)\).
5. Check whether \(h(t)\) satisfies the two conditions of an IMF: (a) the number of extrema and zero crossings differ by at most one, and (b) the mean of the upper and lower envelopes is zero at every point.
6. If \(h(t)\) is an IMF, designate it as \(IMF_1\). Then replace \(x(t)\) with the residual \(r(t) = x(t) – IMF_1\) and repeat the process to obtain \(IMF_2, IMF_3, \ldots\). The decomposition stops when the residual becomes a monotonic function.
After EMD, the original signal can be expressed as:
$$ x(t) = \sum_{i=1}^{k} IMF_i(t) + r(t) $$
where \(k\) is the number of IMFs and \(r(t)\) is the residual. In my experiments, different fault samples may produce different numbers of IMFs. To maintain a consistent input dimension, I select the first 10 IMFs from each sample and combine them with the original signal. Figure 3 in the thesis shows the EMD results for four representative fault types. It can be observed that the high-frequency IMFs contain the most significant fault information.
After EMD, the dimensionality of the data increases because each sample now contains 11 components (10 IMFs plus the residual). To reduce the feature dimension and eliminate redundant information, I apply principal component analysis (PCA). PCA projects the data onto a lower-dimensional subspace while retaining the majority of the variance. The steps are as follows:
1. Standardize the data matrix \(X\) to have zero mean and unit variance.
2. Compute the covariance matrix \(S = \frac{1}{n-1} X^T X\).
3. Calculate the eigenvalues \(\lambda_1 \ge \lambda_2 \ge \cdots \ge \lambda_p\) and the corresponding eigenvectors.
4. Choose the first \(r\) principal components such that the cumulative variance contribution ratio exceeds 90%:
$$ \frac{\sum_{i=1}^{r} \lambda_i}{\sum_{i=1}^{p} \lambda_i} \ge 0.9 $$
In this study, the cumulative contribution ratio of 90% corresponds to \(r = 8\) principal components. Thus, each data sample is ultimately represented by 8-dimensional feature vectors, which are used as the input to the neural network.
3.2 Neural Network Components: CNN and LSTM
Convolutional neural networks (CNNs) are designed to extract local spatial patterns from data. A CNN layer consists of a set of learnable filters that slide over the input, computing dot products to produce feature maps. The convolution operation can be expressed as:
$$ y(i,j) = \sum_{m,n} x(i+m, j+n) \cdot w(m,n) + b $$
where \(x\) is the input, \(w\) is the filter weight, \(b\) is the bias, and \(y\) is the output feature map. Following the convolution, a nonlinear activation function such as ReLU is applied to introduce nonlinearity. Pooling layers reduce the spatial dimensions and preserve important features. In my model, I use max pooling to retain the most prominent activations.
Long short-term memory (LSTM) networks are a special type of recurrent neural network designed to handle long-term dependencies. LSTM introduces a cell state \(C_t\) and three gates: forget gate \(f_t\), input gate \(i_t\), and output gate \(o_t\). The LSTM update equations are as follows:
$$ f_t = \sigma(W_f [h_{t-1}, x_t] + b_f) $$
$$ i_t = \sigma(W_i [h_{t-1}, x_t] + b_i) $$
$$ \tilde{C}_t = \tanh(W_C [h_{t-1}, x_t] + b_C) $$
$$ C_t = f_t \cdot C_{t-1} + i_t \cdot \tilde{C}_t $$
$$ o_t = \sigma(W_o [h_{t-1}, x_t] + b_o) $$
$$ h_t = o_t \cdot \tanh(C_t) $$
where \(\sigma\) denotes the sigmoid function, \(W\) and \(b\) are weight matrices and bias vectors, and \(x_t\) is the input at time step \(t\). LSTM is particularly suitable for fault diagnosis because the DC-side current signal is a time series in which the sequential context matters. By combining CNN and LSTM, the model can first capture local patterns through convolutional filters and then model the temporal dependencies of the extracted features using LSTM layers.
3.3 Proposed Model Architecture
The architecture of the proposed DP-CNN-LSTM fault diagnosis model is illustrated in the thesis. The input is a preprocessed data sample of size \(8 \times 1\). The model consists of three convolutional blocks, a flattening layer, an LSTM layer, and a fully connected classifier. The detailed layer configurations are listed in the table below.
| Layer | Type | Output size |
|---|---|---|
| Conv_1 | Convolution (7×1, 64 filters) | 7×1×64 |
| MaxPool | Max pooling (2×1, stride 2) | 7×1×64 |
| Conv_2 | Convolution (4×1, 64 filters) | 4×1×64 |
| BatchNorm | Batch normalization | 4×1×64 |
| ReLU_1 | Activation (ReLU) | 4×1×64 |
| Conv_3 | Convolution (1×1, 64 filters) | 1×1×64 |
| ReLU_2 | Activation (ReLU) | 1×1×64 |
| Flatten | Flatten to vector | 64 |
| LSTM | LSTM with 6 hidden units | 6 |
| ReLU_3 | Activation (ReLU) | 6 |
| FC | Fully connected (22 outputs) | 22 |
| Softmax | Softmax classifier | 22 |
| Output | Classification output | 22 |
The model is trained using the adaptive moment estimation (Adam) optimizer with gradient descent. The batch size is set to 2048, the maximum number of epochs is 400, the initial learning rate is 0.01 with a dropout factor of 0.5 every 700 iterations. During training, the dataset is shuffled to improve generalization. The loss function is the categorical cross-entropy, defined as:
$$ \mathcal{L} = -\frac{1}{N} \sum_{i=1}^{N} \sum_{j=1}^{C} y_{i,j} \log \hat{y}_{i,j} $$
where \(N\) is the number of samples, \(C\) is the number of classes, \(y_{i,j}\) is the ground-truth label (one-hot encoded), and \(\hat{y}_{i,j}\) is the predicted probability.
3.4 Experimental Results and Comparisons
I evaluate the proposed DP-CNN-LSTM model on the collected dataset. The dataset is split into training and testing sets with a ratio of 9:1. Thus, the training set contains approximately 39,600 samples, and the test set contains about 4,400 samples. The evaluation metrics include the test set accuracy (\(Acc_v\)) and the training loss (\(Loss_t\)). The accuracy is computed as:
$$ Acc_v = \frac{TP + TN}{TP + TN + FP + FN} $$
where TP, TN, FP, and FN are the numbers of true positives, true negatives, false positives, and false negatives, respectively.
After 400 epochs of training, the proposed model achieves a test accuracy of 95.2% and a training loss of 0.271%. The accuracy and loss curves show stable convergence. To further analyze the classification performance, I construct the confusion matrix for the test set. The results indicate that 6 fault types are classified with 100% accuracy, and 14 fault types have an error rate below 5%. This demonstrates the effectiveness of the proposed method for solar inverter IGBT fault diagnosis.
To validate the superiority of the DP-CNN-LSTM model, I compare it with several other diagnostic models, including a standard CNN, an EMD-CNN model, an improved CNN model (Are-CNN), and a deep residual network (DRN). All models are trained and tested under the same experimental conditions. The comparison results are presented in the table below.
| Model | Accuracy (%) | Loss (%) |
|---|---|---|
| CNN | 88.7 | 0.342 |
| EMD-CNN | 91.3 | 0.315 |
| Are-CNN | 92.8 | 0.298 |
| DRN | 93.6 | 0.289 |
| DP-CNN-LSTM (proposed) | 95.2 | 0.271 |
It is clear that the DP-CNN-LSTM model achieves the highest accuracy and the lowest loss among all compared methods. The improvement is attributed to the combination of EMD and PCA preprocessing, which enhances the quality of the input features, and the hybrid CNN-LSTM architecture, which effectively captures both local and temporal characteristics of the DC-side current signal.
3.5 Robustness under Noise
In practical solar inverter applications, the measured current signal is often contaminated by electromagnetic interference and sensor noise. To evaluate the robustness of the proposed model, I artificially add Gaussian white noise to the test data with different signal-to-noise ratios (SNR). The SNR is defined as:
$$ SNR = 10 \log_{10} \left( \frac{P_s}{P_n} \right) $$
where \(P_s\) is the signal power and \(P_n\) is the noise power. I test the model under SNR values of 5 dB, 3 dB, 1 dB, and 0 dB. The corresponding accuracy and loss results are summarized below.
| SNR (dB) | Accuracy (%) | Loss (%) |
|---|---|---|
| 5 | 95.0 | 0.278 |
| 3 | 94.6 | 0.281 |
| 1 | 93.2 | 0.296 |
| 0 | 92.4 | 0.307 |
The accuracy remains above 92% even at SNR = 0 dB, and the loss stays below 0.31%. These results demonstrate that the DP-CNN-LSTM model is robust to noise and can maintain reliable diagnostic performance in real-world environments.
4. Improved Fault Diagnosis with Attention Mechanism and Bayesian Optimization
4.1 Attention Mechanisms
Although the DP-CNN-LSTM model achieves good performance, its accuracy degrades when the noise level is high. This is because the model treats all input features equally, while some features are more relevant than others. To address this issue, I introduce an attention mechanism that enables the network to focus on the most informative parts of the input sequence. Among various attention mechanisms, I select the Squeeze-and-Excitation (SE) attention module because of its simplicity, computational efficiency, and effectiveness for time-series data.
The SE module recalibrates channel-wise feature responses by explicitly modeling the interdependencies between channels. It consists of two operations: squeeze and excitation. The squeeze operation performs global average pooling to generate a channel descriptor. For a feature map \(U \in \mathbb{R}^{H \times W \times C}\), the \(c\)-th channel descriptor is computed as:
$$ z_c = \frac{1}{H \times W} \sum_{i=1}^{H} \sum_{j=1}^{W} u_c(i,j) $$
The excitation operation uses two fully connected layers to capture channel-wise dependencies and generate attention weights. The first fully connected layer reduces the dimension, the ReLU activation is applied, and the second fully connected layer restores the original dimension. Then a sigmoid activation generates the attention weights:
$$ s = \sigma( W_2 \delta(W_1 z) ) $$
where \(W_1\) and \(W_2\) are the weights of the two fully connected layers, \(\delta\) is the ReLU function, and \(\sigma\) is the sigmoid function. Finally, the attention weights are multiplied with the original feature map to obtain the calibrated output:
$$ \tilde{U} = s \otimes U $$
The SE module can be easily integrated into the convolutional layers, allowing the network to emphasize useful channels and suppress less relevant ones.
4.2 Bayesian Optimization
The performance of the CNN-LSTM model is highly sensitive to hyperparameters such as the number of LSTM hidden units, the regularization coefficient, and the initial learning rate. Manually tuning these hyperparameters is time-consuming and often leads to suboptimal solutions. To automate this process, I employ Bayesian optimization, which is an efficient global optimization method for black-box functions. It builds a probabilistic model of the objective function and uses an acquisition function to decide where to sample next.
In this study, I optimize three hyperparameters: the number of LSTM hidden units (ranging from 10 to 256), the regularization coefficient (ranging from \(10^{-10}\) to 0.1), and the initial learning rate (ranging from \(10^{-5}\) to 0.9). The objective function is the classification error on the validation set. After 15 iterations of Bayesian optimization, the optimal hyperparameters are determined. The initial values and the optimized values are listed in the following table.
| Hyperparameter | Initial value | Optimized value |
|---|---|---|
| LSTM hidden units | 70 | 98 |
| Regularization coefficient | 0.001 | 0.003 |
| Initial learning rate | 0.01 | 0.0108 |
Bayesian optimization significantly reduces the manual effort and helps the model achieve better performance.
4.3 Model Architecture with Attention and Bayesian Optimization
The improved model architecture is based on the DP-CNN-LSTM structure but with several modifications. First, the two fully connected layers in the SE module are inserted after the second convolution block to recalibrate the feature channels. Second, the number of LSTM layers is increased to two, with 50 and 20 hidden units, respectively. Third, a global average pooling layer is used before the SE module to compress the spatial information. The detailed architecture is shown in the following table.
| Layer | Type | Output size |
|---|---|---|
| Conv_1 | Convolution (7×1, 64 filters) | 7×1×64 |
| BatchNorm_1 | Batch normalization | 7×1×64 |
| ReLU_1 | Activation (ReLU) | 7×1×64 |
| Conv_2 | Convolution (4×1, 64 filters) | 4×1×64 |
| BatchNorm_2 | Batch normalization | 4×1×64 |
| ReLU_2 | Activation (ReLU) | 4×1×64 |
| GAPool | Global average pooling | 1×1×64 |
| FC_1 | Fully connected (16 neurons) | 1×1×16 |
| ReLU_3 | Activation (ReLU) | 1×1×16 |
| FC_2 | Fully connected (64 neurons) | 1×1×64 |
| Sigmoid | Activation (Sigmoid) | 1×1×64 |
| Multiplication | Channel-wise reweighting | 4×1×64 |
| Flatten | Flatten to vector | 256 |
| LSTM_1 | LSTM (50 hidden units) | 50 |
| LSTM_2 | LSTM (20 hidden units) | 20 |
| ReLU_4 | Activation (ReLU) | 20 |
| FC_3 | Fully connected (22 outputs) | 22 |
| Softmax | Softmax classifier | 22 |
| Output | Classification output | 22 |
The model is trained with the same Adam optimizer and data split as the previous model. After training, the test accuracy is 96.8% and the training loss is 0.258%. The accuracy and loss curves show that the model converges smoothly without overfitting.
After applying Bayesian optimization, the test accuracy further improves to 99.7% and the loss decreases to 0.193%. This significant improvement confirms that the optimized hyperparameters lead to a much better fault diagnosis performance for the solar inverter.
4.4 Robustness under Noise with Attention and Bayesian Optimization
To verify the robustness of the improved model, I repeat the noise experiments with SNR values of 5 dB, 3 dB, 1 dB, and 0 dB. The results are shown in the table below.
| SNR (dB) | Accuracy (%) | Loss (%) |
|---|---|---|
| 5 | 98.9 | 0.202 |
| 3 | 97.9 | 0.216 |
| 1 | 97.6 | 0.220 |
| 0 | 97.5 | 0.228 |
Even at SNR = 0 dB, the accuracy remains as high as 97.5%, which is about 5% higher than the DP-CNN-LSTM model without attention. This demonstrates the effectiveness of the SE attention mechanism in extracting salient features from noisy signals. The Bayesian optimization further boosts the model’s generalization ability by finding the optimal hyperparameter configuration.
4.5 Additional Performance Evaluation
In addition to accuracy and loss, I evaluate the improved model using precision, recall, and F1-score. These metrics are particularly useful when the dataset may have class imbalance or when the cost of false positives and false negatives differs. They are defined as follows:
$$ Precision = \frac{TP}{TP + FP} $$
$$ Recall = \frac{TP}{TP + FN} $$
$$ F1\text{-}score = \frac{2 \cdot Precision \cdot Recall}{Precision + Recall} $$
I compute these metrics for the improved model under different noise levels. The results are listed in the table below.
| SNR (dB) | Precision | Recall | F1-score |
|---|---|---|---|
| 5 | 0.986 | 0.983 | 0.985 |
| 3 | 0.976 | 0.972 | 0.975 |
| 1 | 0.971 | 0.967 | 0.968 |
| 0 | 0.966 | 0.959 | 0.963 |
All three metrics remain above 0.95 even under the strongest noise level, indicating that the model not only makes correct predictions but also maintains a good balance between precision and recall. This is essential for practical solar inverter monitoring systems, where both missed alarms and false alarms can have serious consequences.
5. Conclusion and Outlook
In this thesis, I have investigated intelligent fault diagnosis methods for IGBT open-circuit faults in solar inverters. I constructed a comprehensive simulation model of a PV power generation system, verified its feasibility through THD analysis, and collected DC-side current signals under 22 different operating conditions. Based on the collected data, I proposed two deep learning based diagnostic frameworks.
The first framework, DP-CNN-LSTM, applies EMD and PCA for data preprocessing and combines CNN and LSTM for feature extraction and temporal modeling. This model achieves a test accuracy of 95.2% and shows robustness under noisy conditions. The second framework incorporates an SE attention mechanism to recalibrate channel-wise features and uses Bayesian optimization to automatically tune hyperparameters. The improved model achieves an outstanding test accuracy of 99.7% in the noise-free case and remains above 97.5% even at SNR = 0 dB. The precision, recall, and F1-score are consistently above 0.96 across all tested noise levels. These results demonstrate the effectiveness of the proposed methods for reliable fault diagnosis in solar inverters.
There are several directions for future research. First, the current study focuses on IGBT open-circuit faults; future work should consider other component faults such as PV panel degradation, capacitor failures, and sensor faults. Second, the diagnostic method should be further developed to support transient fault-tolerant operation, enabling the solar inverter to continue running during the fault diagnosis period. Third, field tests with real solar inverter data are needed to validate the practical applicability of the proposed methods. Finally, the generalization ability of the models could be improved by using transfer learning or generative adversarial networks to create more diverse training samples.
In summary, this thesis provides a practical and effective solution for solar inverter fault diagnosis, contributing to the safe and efficient operation of photovoltaic power plants.