
The imperative for efficient and safe operation of large-scale cell energy storage system deployments is paramount in modern power grids. A critical challenge within these systems is managing the inherent inconsistency among individual battery cells. Disparities arising from manufacturing tolerances, operational environment variations, and uneven aging during charge-discharge cycles are amplified in distributed architectures. These inconsistencies not only degrade the overall performance and usable capacity of the cell energy storage system but also pose significant safety risks, potentially triggering cascading failures and leading to substantial economic losses. While existing state recognition techniques can model the dynamic behavior of batteries, they often struggle to capture the subtle, multimodal signatures of inter-cell variations—such as localized overheating, casing deformation (swelling), or electrolyte leakage—leading to inadequate diagnostic precision.
To address this gap, this paper proposes a novel methodology for recognizing the consistency state of distributed energy storage batteries by integrating multi-modal data fusion with the advanced object detection capabilities of the YOLOv7 algorithm. The core innovation lies in moving beyond a single data type, synergistically combining operational electrochemical data with visual thermal and geometric data to form a comprehensive diagnostic picture. This approach leverages YOLOv7’s powerful feature extraction and multi-scale analysis to accurately identify specific anomaly states associated with inconsistency.
The foundation of the methodology is the acquisition of a rich, multi-modal dataset. High-precision sensors are deployed at critical nodes within the distributed cell energy storage system to collect real-time operational parameters (voltage, current, internal resistance). Simultaneously, high-resolution imaging devices, including infrared (thermal) and visual cameras, capture the physical and thermal state of battery modules. Let \( x(t) \) represent the raw operational data time series, and \( I(i, j) \) denote the pixel intensity at location \( (i, j) \) in a captured image (thermal or visual). To enhance data quality and mitigate noise, distinct filtering techniques are applied. For the time-series operational data, a moving average filter is employed:
$$ X_i = \frac{1}{n} \sum_{e=0}^{n-1} x(t – e) $$
where \( n \) is the filter window size, and \( X_i \) is the filtered operational data. For the 2D image data, a Gaussian filter is applied for smoothing:
$$ Y(i, j) = \sum_{a=-A}^{A} \sum_{b=-B}^{B} w(a, b) \cdot I(i+a, j+b) $$
where \( w(a, b) \) is the Gaussian kernel function over a window of size \( (2A+1) \times (2B+1) \), and \( Y(i, j) \) is the filtered image.
Direct input of these heterogeneous data streams (1D sequences and 2D matrices) would lead to alignment issues and inefficient feature learning. Therefore, a weighted fusion strategy is adopted to create a unified data representation that preserves critical information from both modalities. The fused data matrix \( G_d \) is constructed as:
$$ G_d = \delta_x \cdot X + \delta_y \cdot Y(i, j) $$
where \( \delta_x \) and \( \delta_y \) are the empirically determined weighting coefficients for operational and image data, respectively, satisfying \( \delta_x + \delta_y = 1 \). This fused representation \( G_d \) serves as the primary input for the subsequent consistency state diagnosis.
The diagnosis engine is built upon the YOLOv7 architecture. The fused data \( G_d \) is fed into YOLOv7’s sophisticated backbone network for deep feature extraction. This process involves convolutional layers that learn hierarchical representations relevant to battery state anomalies. The convolution operation at layer \( j \) can be expressed as:
$$ Y_j = \sum_{m=0}^{M-1} \sum_{n=0}^{N-1} \sum_{p=0}^{P-1} W_{mnp} \star G_d + b_j $$
where \( W_{mnp} \) represents the convolutional kernel weights, \( M, N, P \) denote input channels, output channels, and kernel count, \( \star \) is the convolution operator, and \( b_j \) is the bias term. Following convolution, pooling layers and subsequent processing within the network yield a set of high-level features \( T_z \) that encode potential inconsistency signatures:
$$ T_z = Q(C_h(w_c \cdot Y_j + b_c) + b_q) $$
Here, \( C_h(\cdot) \) denotes a pooling function (e.g., max pooling), \( w_c \) and \( b_c \) are learnable parameters, and \( Q(\cdot) \) represents the function of the feature output layer with bias \( b_q \).
To robustly handle anomalies at various scales (e.g., small leakage spots vs. large swollen areas), the extracted features \( T_z \) are passed through a Path Aggregation Network (PANet) within YOLOv7, acting as a feature pyramid for enhancement:
$$ T_z^* = \sum_{z=1}^{Z} \lambda_z \cdot F_a(F_b \cdot T_z) $$
where \( \lambda_z \) is a scaling factor, \( F_a \) and \( F_b \) are functions and parameters of the residual learning branches in the PANet, and \( Z \) is the total number of feature scales. The enhanced features \( T_z^* \) are then processed by the detection head to localize and classify anomalies.
The training of the YOLOv7 model is guided by a composite loss function \( L_s \), which is crucial for accurate bounding box regression and classification. It incorporates a modified Complete IoU (CIoU) loss to better handle geometric relationships. A key component is the aspect ratio consistency term \( v_s \):
$$ v_s = \frac{4}{\pi^2} \left( \arctan\left(\frac{w_c}{h_c}\right) – \arctan\left(\frac{w_p}{h_p}\right) \right)^2 $$
where \( (w_c, h_c) \) are the width and height of the predicted bounding box, and \( (w_p, h_p) \) are those of the target (ground truth) box. The overall localization and confidence loss for a detection is formulated as:
$$ L_s = 1 – r_s + \frac{d_s^2}{c_s^2} + \alpha_s v_s + \text{Classification Loss}(T_z^*) $$
In this equation, \( r_s \) represents the Intersection over Union (IoU) between the predicted and target boxes, \( d_s \) is the distance between their centers, \( c_s \) is the diagonal length of the smallest enclosing box covering both, and \( \alpha_s \) is a weighting parameter. The final term represents the cross-entropy loss for classifying the detected region into a specific anomaly state. Based on the trained model, the real-time state \( F_l \) of a battery unit is classified as consistent or inconsistent through a decision function involving the model’s output probabilities \( \phi(\cdot) \) for each state parameter \( d_k \):
$$ F_l = \sum_{z=1}^{Z} \beta_z \left[ \phi(d_z) + \sum_{g=1}^{m} (1 – \phi(d_z)) \phi(d_g) \prod_{q \neq g} (1 – \phi(d_q)) \right] – L_s $$
where \( \beta_z \) is a normalization factor, and \( m \) represents neighboring context parameters. If \( F_l \) exceeds a predefined threshold, the cell is diagnosed as being in an inconsistent state.
Following the diagnosis, the specific type of consistency failure is identified by calculating a quantitative Consistency State Value \( Z_l \). This value incorporates both the visual diagnostic confidence and a key thermal metric: the Temperature Field Contrast \( H_z \). The contrast is derived from the enhanced feature maps \( T_z^* \), reflecting the probability distribution \( p(T_z^*) \) of thermal anomalies:
$$ H_z = -\sum_{z=1}^{Z} p(T_z^*) \log_2 p(T_z^*) $$
The final Consistency State Value \( Z_l \) is then computed as:
$$ Z_l = \frac{\gamma_z \cdot H_z + P_l}{F_l} $$
Here, \( \gamma_z \) is a cell-type-specific parameter, and \( P_l \) is a penalty term for the magnitude of state deviation. The value of \( Z_l \) is mapped to distinct consistency failure modes based on empirically and safety-standard-derived thresholds, as summarized in the table below:
| Consistency State Value \( Z_l \) Range | Identified Consistency State | Rationale & Standard Reference |
|---|---|---|
| (0.00, 0.50] | Normal State | Maximum allowable temperature difference ≤ 5°C (IEC 62619). Normalized safe margin threshold. |
| (0.50, 0.70] | Local Overheating State | Local temperature rise > 15°C triggers alarm (UL 1973). Threshold includes base safety margin. |
| (0.70, 0.90] | Battery Swelling/Deformation State | Internal pressure > 0.3 MPa causing permanent casing deformation (SAE J2928). |
| (0.90, 1.00] | Leakage/Performance Degradation State | Severe failure mode indicating electrolyte leakage or critical performance loss. |
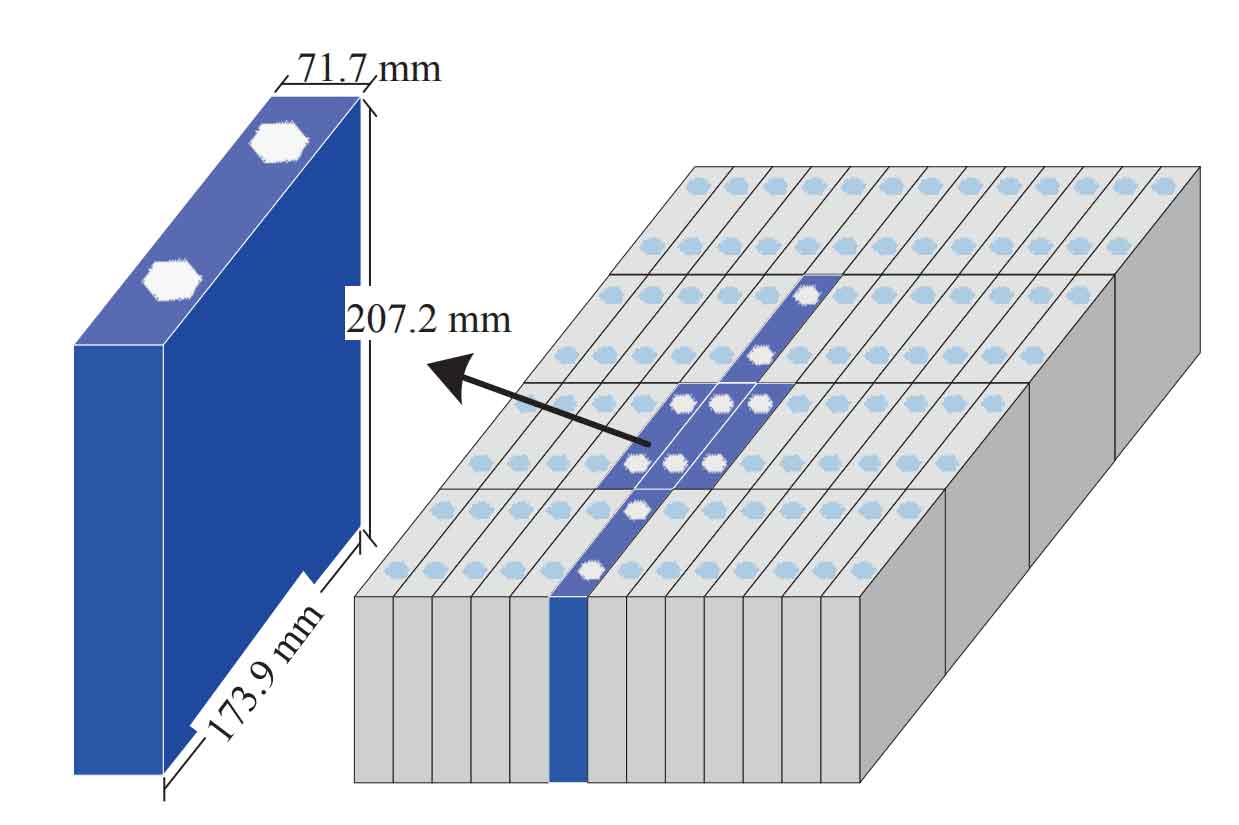
To validate the proposed methodology, experimental tests were conducted on a 900kW lithium iron phosphate (LiFePO4) cell energy storage system. The system comprised 10 battery strings in parallel, each string consisting of 100 cells connected in series. Key parameters of the individual cells are listed below:
| Parameter | Value |
|---|---|
| Nominal Voltage | 3.2 V |
| Nominal Capacity | 280 Ah |
| Internal Resistance | ~20 mΩ |
| Operating Temperature | -20°C to 55°C |
The algorithm parameters were set as follows: filter window \( n=5 \), fusion weights \( \delta_x=0.55 \), \( \delta_y=0.45 \), residual parameter \( F_b=0.75 \), loss weight \( \alpha_s=0.65 \). The YOLOv7 model was configured with specific training parameters:
| YOLOv7 Training Parameter | Value |
|---|---|
| Input Resolution | 640×640 |
| Initial Learning Rate | 0.01 |
| Batch Size | 32 |
| Training Epochs | 300 |
| Confidence Threshold | 0.50 |
The model training converged effectively, with the loss function \( L_s \) decreasing from an initial value of approximately 7.4 to below 2.8 by epoch 120, which was selected as the optimal stopping point. The performance of the proposed method was compared against two established techniques from literature: a method based on charging curve transformation (Baseline 1) and a method based on electrochemical impedance spectroscopy (Baseline 2). The primary metric for comparison was the mean Intersection over Union (IoU) of the identified anomaly regions against ground truth annotations across multiple test runs.
The proposed YOLOv7-based method achieved an average recognition rate of 0.98 for different inconsistency states (Normal, Overheating, Swelling, Leakage) and a mean IoU value of 0.97 across 40 experimental trials. In contrast, Baseline 1 achieved a mean IoU of 0.84, and Baseline 2 achieved 0.79. The superior performance of the proposed method is attributed to the effective multi-modal data fusion, which provides a more comprehensive state representation, combined with YOLOv7’s powerful multi-scale feature extraction and enhancement via the feature pyramid network. This allows the model to precisely localize and classify subtle visual and thermal patterns associated with early-stage inconsistencies that are often missed by methods relying solely on electrical data.
In conclusion, the integration of multi-modal sensor data with the advanced YOLOv7 deep learning framework presents a highly effective solution for the precise recognition of consistency states in distributed cell energy storage system. By simultaneously analyzing electrochemical signals and visual-thermal imagery, the method captures a holistic view of battery health, enabling the accurate identification of specific failure modes like local overheating, casing deformation, and electrolyte leakage. The high recognition accuracy and IoU scores demonstrated in validation experiments underscore the practicality and robustness of this approach. This technology facilitates real-time, proactive health monitoring, allowing for timely maintenance interventions, enhanced safety management, and optimized operational strategies for battery energy storage systems, ultimately contributing to greater grid reliability and economic efficiency.