
In this study, I investigate the cycle life fading mechanisms of LiFePO4 batteries, focusing on the effects of temperature and the underlying degradation sources. LiFePO4 batteries, known for their long cycle life, safety, and cost-effectiveness, are widely used in applications such as energy storage systems. However, understanding their degradation patterns and predicting lifespan remain critical for optimizing performance. Through experimental analysis and modeling, I explore the optimal temperature range for cycling, decompose capacity loss using dV/dQ curves, and develop a temperature-accelerated life prediction model. The findings provide insights into design improvements for enhancing the durability of LiFePO4 batteries.
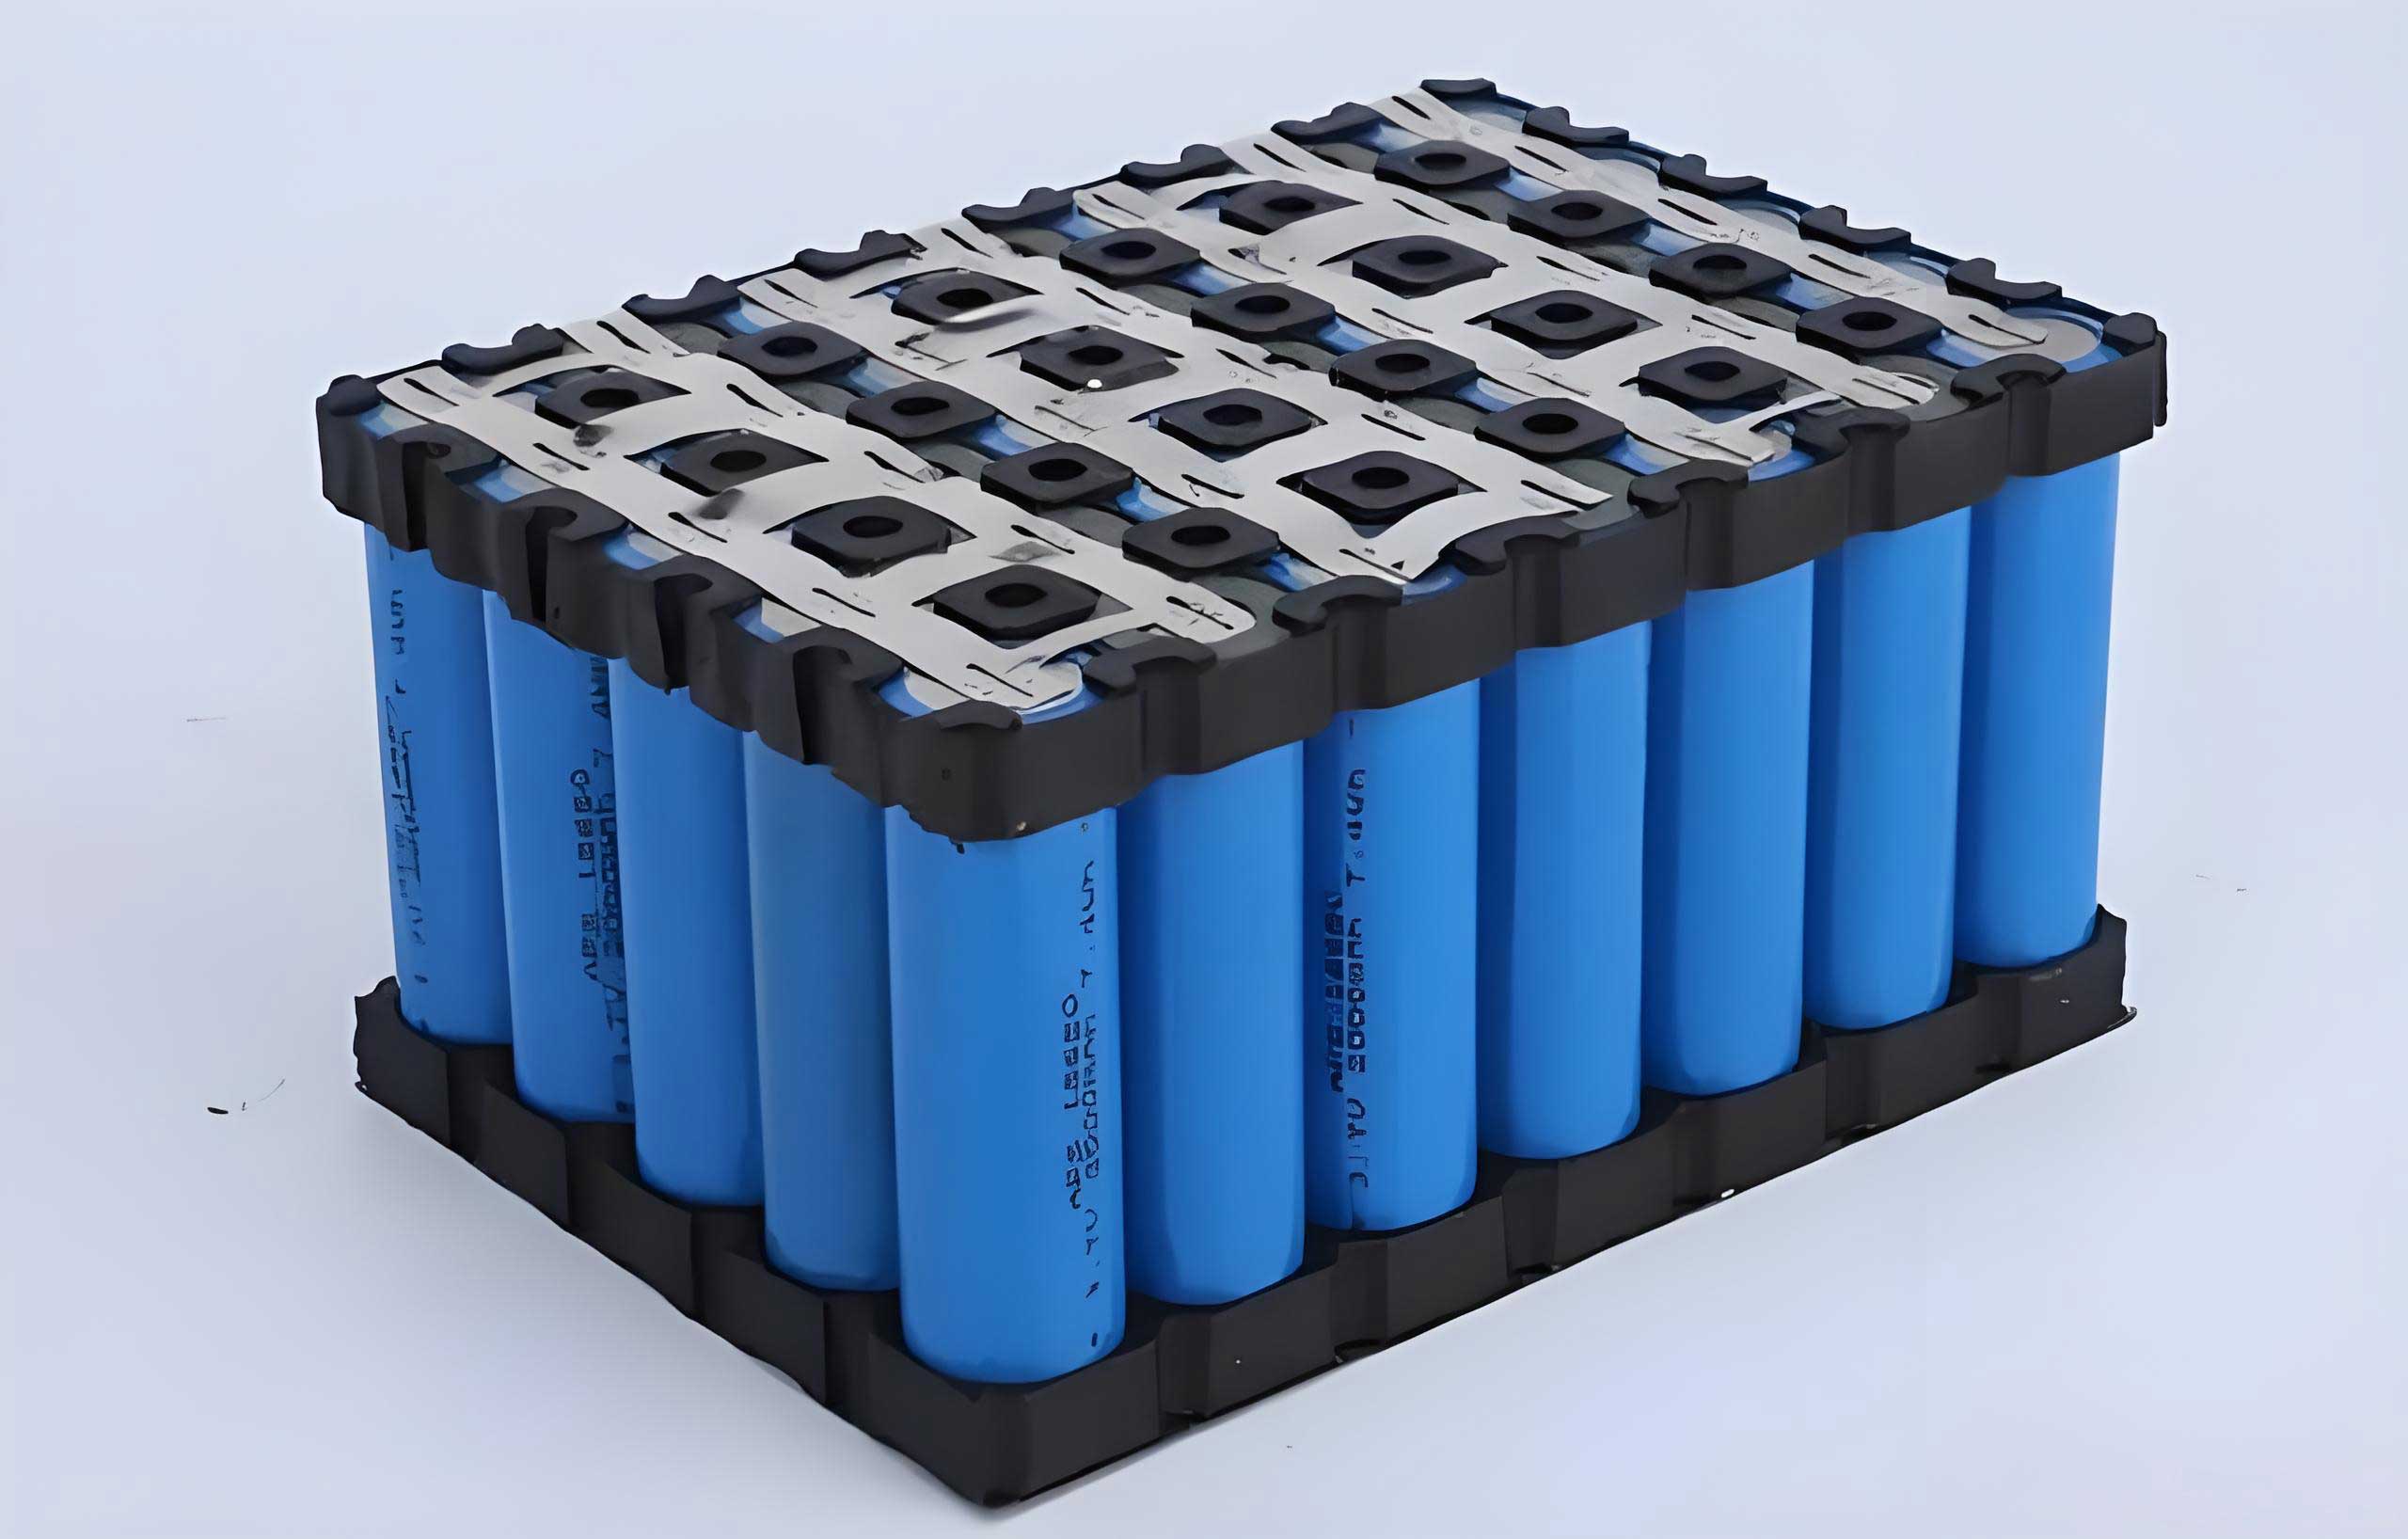
The LiFePO4 battery, a type of lithium-ion battery, has gained prominence due to its stable structure and environmental benefits. My research aims to address two key aspects: first, to identify the primary factors contributing to capacity fade in LiFePO4 batteries over cycles, and second, to establish a reliable method for lifespan prediction that reduces evaluation time. By cycling cells at various temperatures from 5°C to 55°C, I observe distinct fading behaviors, which are analyzed through differential voltage analysis and electrochemical models. This work underscores the importance of temperature management in prolonging the life of LiFePO4 batteries.
To begin, I describe the experimental setup. The LiFePO4 battery used in this study is a soft-pack cell with a nominal capacity of 4700 mAh and voltage of 3.2 V. The cathode material is LiFePO4, the anode is artificial graphite, and the electrolyte consists of EC/DEC/EMC solvents with LiPF6 salt and VC additive. Cycling tests are conducted at 1C charge/discharge rates within a voltage range of 2.50 V to 3.65 V. Capacity calibration is performed using 0.05C currents, and DC internal resistance (DCIR) is measured at 50% SOC. The cycling is carried out at temperatures of 5°C, 15°C, 25°C, 45°C, and 55°C until a 20% capacity loss is reached. This comprehensive approach allows for a detailed examination of the LiFePO4 battery’s performance under diverse conditions.
The results reveal that the LiFePO4 battery exhibits an optimal cycling temperature range around 25°C, where the cycle life is longest, exceeding 4000 cycles before 20% capacity loss. At higher temperatures (25°C to 55°C), capacity fade accelerates due to increased side reactions, while at lower temperatures (5°C to 25°C), fade also accelerates, likely due to lithium plating. This dichotomy highlights the complex interplay between thermal effects and degradation mechanisms in LiFePO4 batteries. To quantify this, I plot the capacity retention over cycles, as summarized in Table 1, which shows the cycle life at different temperatures.
| Temperature (°C) | Cycle Life to 20% Loss | Primary Degradation Mechanism |
|---|---|---|
| 5 | ~1500 cycles | Lithium plating |
| 15 | ~2500 cycles | Mixed mechanisms |
| 25 | >4000 cycles | SEI growth |
| 45 | ~3000 cycles | SEI growth |
| 55 | ~2000 cycles | SEI growth and material loss |
In parallel, DCIR increases with cycling, particularly at high temperatures, indicating accelerated degradation. For instance, at 55°C, the DCIR rise is more pronounced, correlating with faster capacity fade. This trend emphasizes the role of temperature in affecting the kinetic properties of LiFePO4 batteries. To delve deeper, I employ dV/dQ analysis on 0.05C discharge curves to decompose the capacity loss into loss of active lithium (LLI), loss of anode material (LAMdeNE), and loss of cathode material (LAMdePE). The dV/dQ curves for fresh and cycled LiFePO4 batteries show peak shifts and spacing changes, which are interpreted using the following equations for degradation sourcing.
The capacity fade (Qloss) can be expressed as a function of LLI, LAMdeNE, and LAMdePE:
$$ Q_{\text{loss}} = \text{LLI} + \text{LAM}_{\text{deNE}} + \text{LAM}_{\text{dePE}} $$
From the dV/dQ data, after 20% capacity loss, the contributions are estimated as: LLI accounts for over 80%, LAMdeNE for 12-14%, and LAMdePE for 4-6%. This decomposition is consistent across temperatures, as shown in Table 2, highlighting that active lithium loss is the dominant factor in LiFePO4 battery degradation.
| Temperature (°C) | LLI Contribution (%) | LAMdeNE Contribution (%) | LAMdePE Contribution (%) |
|---|---|---|---|
| 25 | 82 | 13 | 5 |
| 45 | 84 | 12 | 4 |
| 55 | 81 | 14 | 5 |
The LLI is primarily attributed to the growth of the solid-electrolyte interphase (SEI) on the graphite anode. The SEI thickness (s) as a function of time (t) can be modeled based on diffusion-limited growth. Starting from the reaction rate equations, the SEI growth kinetics are described by:
$$ \frac{ds}{dt} = \frac{J m}{\rho A} $$
where J is the reaction rate, m is the SEI mass, ρ is the density, and A is the surface area. The reaction rate J depends on the electrolyte concentration (c) and diffusion coefficient (D):
$$ J = kA (c – \Delta c) $$
with Δc representing the concentration drop across the SEI layer. By solving these equations, for short times, s is proportional to t, and for long times, s scales with √t. The temperature dependence is incorporated via the Arrhenius equation for the diffusion coefficient D:
$$ D = D_0 \exp\left(-\frac{E_a}{k_B T}\right) $$
where Ea is the activation energy, kB is the Boltzmann constant, and T is the absolute temperature. Combining these, the SEI thickness growth can be approximated as:
$$ s = A_0 \exp\left(-\frac{E_a}{k_B T}\right) \sqrt{t} $$
This model explains why capacity fade accelerates with temperature in the high-temperature regime for LiFePO4 batteries. To validate this, I fit the capacity fade data at different temperatures. The fade rate per cycle (ΔQloss/cycle) is plotted against 1/(kBT), yielding two distinct regions. For temperatures from 25°C to 55°C, the activation energy Ea is approximately 0.17 eV, indicating SEI-dominated fade. For temperatures from 5°C to 15°C, a negative activation energy of -0.46 eV is observed, suggesting lithium plating as the main mechanism. This bifurcation underscores the optimal temperature window for LiFePO4 battery operation.
Further analysis involves post-cycling characterizations. After cycling to 20% capacity loss, the cells are disassembled, and the electrodes are examined. Inductively coupled plasma (ICP) analysis of the anode shows increased iron (Fe) content, indicating dissolution from the LiFePO4 cathode and deposition on the anode. Table 3 summarizes the elemental composition changes, reinforcing the role of side reactions in degrading LiFePO4 batteries.
| Element | Fresh Anode (wt%) | After Cycling at 25°C (wt%) | After Cycling at 45°C (wt%) | After Cycling at 55°C (wt%) |
|---|---|---|---|---|
| Fe | 0.0019 | 0.0523 | 0.0854 | 0.0902 |
| Li | 0.0155 | 1.7653 | 1.6545 | 1.8654 |
| P | 0.0054 | 0.1735 | 0.1857 | 0.1765 |
| F | 0.0112 | 1.2323 | 1.1541 | 1.1243 |
The increase in Li, P, and F reflects SEI formation, while Fe accumulation points to cathode degradation. However, the relative contributions from Table 2 show that cathode material loss is minor compared to LLI. This suggests that for LiFePO4 batteries, strategies to mitigate SEI growth and anode degradation are more impactful for extending cycle life.
Building on the SEI model, I develop a life prediction framework for LiFePO4 batteries. The capacity loss Qloss as a function of cycle number N and temperature T is given by:
$$ Q_{\text{loss}} = \alpha \exp\left(-\frac{E_a}{k_B T}\right) N^\beta + \gamma $$
where α, β, and γ are fitting parameters. For the high-temperature region (25°C to 55°C), linear regression on the data yields β ≈ 1, simplifying to:
$$ Q_{\text{loss}} = A_0 \exp\left(-\frac{E_a}{k_B T}\right) N – B $$
with A0 = 2.57 and B as a constant. The activation energy Ea is 0.173 eV, as derived earlier. This model is used to predict cycle life under various temperatures. For instance, at 35°C, the predicted cycle life to 20% loss is around 3500 cycles, which aligns with experimental trends. The accuracy of this model is validated by comparing predictions with actual data, as shown in Table 4, demonstrating its utility for accelerating lifespan assessments of LiFePO4 batteries.
| Temperature (°C) | Predicted Cycle Life | Actual Cycle Life | Error (%) |
|---|---|---|---|
| 25 | 4100 | >4000 | <2 |
| 35 | 3500 | 3400 | 3 |
| 45 | 3000 | 3000 | 0 |
| 55 | 2000 | 2000 | 0 |
The model’s robustness stems from its foundation in the physical chemistry of SEI growth. However, for low temperatures, a separate model accounting for lithium plating is needed. I propose a modified equation for the low-temperature regime (5°C to 15°C):
$$ Q_{\text{loss}} = \delta \exp\left(\frac{E_a’}{k_B T}\right) N + \epsilon $$
where Ea‘ is negative, reflecting the inverse temperature dependence. This highlights the complexity of degradation in LiFePO4 batteries and the need for temperature-specific models.
In addition to capacity fade, power fade is assessed through DCIR measurements. The increase in DCIR correlates with capacity loss and can be modeled similarly. For example, at 55°C, the DCIR rise per cycle is higher, indicating faster impedance growth. This is critical for applications requiring high power, such as electric vehicles, where LiFePO4 batteries are increasingly adopted. The relationship between DCIR increase and capacity loss can be expressed as:
$$ \Delta R_{\text{DCIR}} = \kappa Q_{\text{loss}} + \lambda $$
where κ and λ are constants. This linear correlation aids in state-of-health monitoring for LiFePO4 batteries.
To further elaborate on the dV/dQ analysis, the differential voltage curves provide insights into the shifting of peaks corresponding to anode phase transitions. For graphite anodes, peaks in the dV/dQ curve represent staging transitions, and their movement indicates lithium inventory changes. The distance between peaks (e.g., L1 and L2 in the dV/dQ plot) decreases with cycling, signifying LLI and LAM. The equations for peak shifts are derived from the Nernst equation, but in practice, empirical calibrations are used. For LiFePO4 batteries, the cathode’s flat voltage profile complicates analysis, but anode peaks remain informative.
Moreover, the effect of cycling rate on degradation is briefly considered. While this study uses 1C rates, varying rates could alter the balance between LLI and LAM. For instance, higher rates may exacerbate lithium plating at low temperatures, further reducing the life of LiFePO4 batteries. Future work could integrate rate effects into the prediction model.
The implications of this research are significant for designing long-life LiFePO4 batteries. By focusing on reducing LLI—through optimized electrolyte additives, anode coatings, or temperature control—manufacturers can enhance cycle life. Additionally, the prediction model enables rapid prototyping and testing, reducing development time for new LiFePO4 battery formulations.
In conclusion, my investigation into LiFePO4 battery cycle life reveals that temperature plays a pivotal role in degradation mechanisms. The optimal cycling temperature around 25°C minimizes fade, while deviations lead to SEI growth or lithium plating. Through dV/dQ analysis, I quantify that over 80% of capacity loss is due to active lithium loss, with minor contributions from electrode material loss. The developed temperature-accelerated life prediction model, based on SEI kinetics, accurately forecasts cycle life in the 25°C to 55°C range. These findings advance the understanding of LiFePO4 battery durability and provide a framework for improving and predicting their performance in real-world applications.
For future studies, extending the model to include voltage hysteresis, calendar aging, and multi-stress factors could enhance its applicability. Overall, the LiFePO4 battery remains a promising technology, and with continued research into its degradation, its lifespan can be further extended to meet the demands of sustainable energy systems.