
The rapid integration of renewable energy sources such as wind and solar power into modern power grids has introduced significant challenges related to grid stability, power quality, and energy dispatch. Battery energy storage systems have emerged as a critical technology to address these challenges due to their fast response, flexible power regulation, and ability to provide grid support services such as frequency regulation, voltage sag mitigation, and peak shaving. However, the accurate modeling of battery energy storage systems under electromagnetic transient conditions remains a fundamental requirement for studying their dynamic interactions with the grid and for designing effective control and protection strategies.
Existing research has predominantly focused on developing electromagnetic transient models using foreign simulation platforms such as MATLAB, PSCAD/EMTDC, and PSS/E. While these platforms offer robust modeling capabilities, the reliance on foreign software raises concerns regarding technological independence, data security, and customization for local grid requirements. The domestically developed ADPSS simulation platform presents a viable alternative, yet limited research has been conducted on its application for high-fidelity electromagnetic transient modeling of battery energy storage systems. This gap motivates the present study, which aims to develop a comprehensive electromagnetic transient modeling and verification methodology for battery energy storage systems using the ADPSS platform.
In this work, we first design a generic low/high voltage fault ride-through control strategy based on the fault characteristics of mainstream battery energy storage units and grid interconnection standards. We then construct electromagnetic transient simulation models of a representative battery energy storage system on both the MATLAB and ADPSS platforms. Through systematic comparison of simulation results with manufacturer packaged model test data, we identify key discrepancies in response characteristics and trace these discrepancies to differences in individual module implementations. Based on this analysis, we propose a parameter and structure calibration method for the ADPSS simulation model, forming a high-precision electromagnetic transient modeling approach for battery energy storage systems on the ADPSS platform. The effectiveness of the proposed method is validated through comprehensive fault ride-through response comparisons and error analysis.
Control Methodology for Low and High Voltage Fault Ride-Through
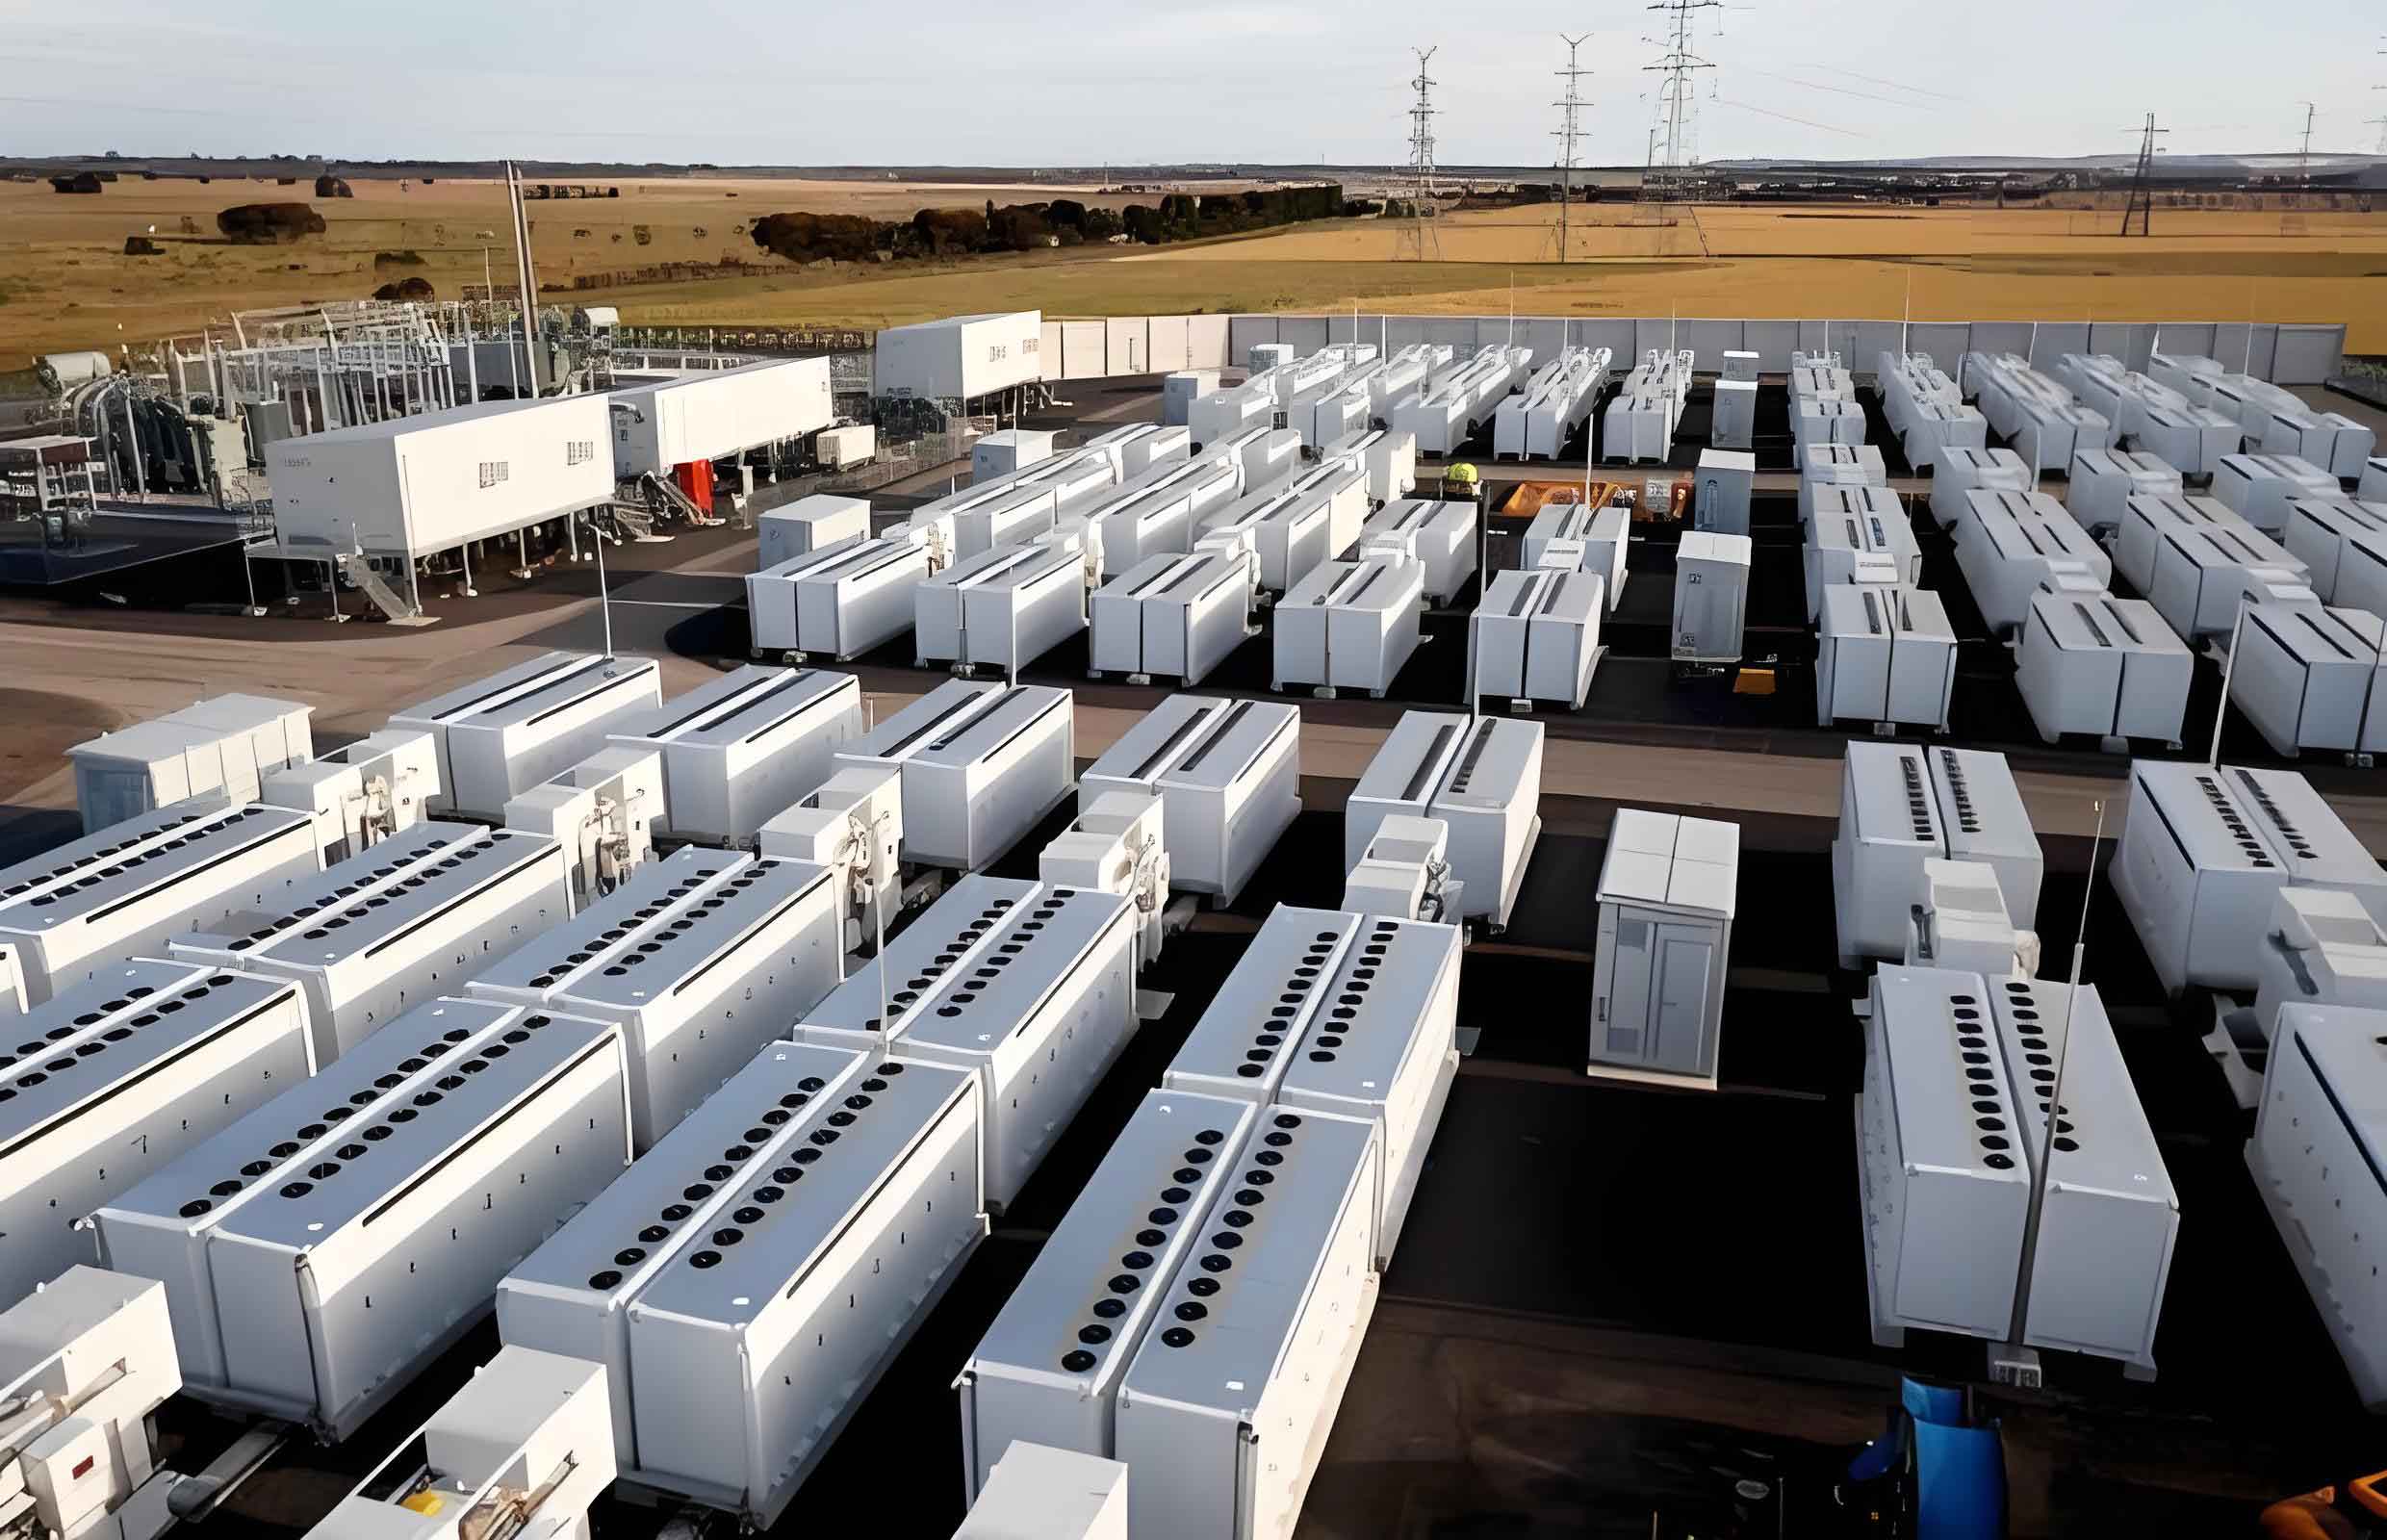
The grid-connected structure of a typical battery energy storage system consists of a battery bank, a grid-connected power conversion system, and a control system. The power conversion system regulates active and reactive power to maintain AC side voltage stability and reduce grid fluctuations. From the grid perspective, the external power characteristics of the battery energy storage system are primarily determined by the control strategy of the power conversion system. Therefore, designing a universal control strategy for low and high voltage fault ride-through is essential.
Steady-State Power Control Architecture
The steady-state power control structure serves as the foundation for implementing low and high voltage fault ride-through control. The d-axis and q-axis in the main circuit are coupled, which can affect the control performance of active and reactive power. To address this, we adopt a dual closed-loop feedforward decoupling control structure. The steady-state control architecture includes an outer power loop and an inner current loop. The inner current loop uses feedforward compensation to cancel the coupling terms between the controller and the main circuit. After decoupling, the d-axis control is associated only with active power, while the q-axis control is associated only with reactive power, enabling independent regulation of active and reactive power.
Generic Voltage Fault Ride-Through Control Strategy
During voltage dips or swells, the battery energy storage system controller must not only maintain DC bus voltage stability but also provide or absorb reactive power to support grid voltage recovery. Based on the low and high voltage fault ride-through characteristics of mainstream battery energy storage units and the reactive power support standards specified in relevant technical specifications, we design a universal voltage fault ride-through control method as illustrated conceptually.
The key equations governing the control strategy are as follows. During low voltage faults, the d-axis and q-axis current references are given by:
$$i_{dref} = \min\left( \min\left( k_{dL1} u + k_{dL2} I_{d0} + I_{dLset},\; k_0 u + \frac{P_0}{u} \right),\; \sqrt{I_{max}^2 – i_{qref}^2} \right)$$
$$i_{qref} = \max\left( k_{qL1} (U_{Lin} – u) + k_{qL2} I_{q0} + I_{qLset},\; I_{qLmin} \right)$$
During high voltage faults, the d-axis and q-axis current references are expressed as:
$$i_{dref} = k_{op} (P_{ref} – P) + k_{oi} \int (P_{ref} – P) dt$$
$$i_{qref} = \min\left( k_{qH1} (u – U_{Hin}) + k_{qH2} I_{q0} + I_{qHset},\; I_{qHmax} \right)$$
In these equations, \(u\) represents the terminal voltage magnitude, \(I_{max}\) is the maximum current limit, \(P_0\) is the initial active power, \(I_{d0}\) and \(I_{q0}\) are the initial active and reactive currents, \(U_{Lin}\) and \(U_{Hin}\) are the voltage thresholds for entering low and high voltage ride-through modes, and \(k_{dL1}, k_{dL2}, k_{qL1}, k_{qL2}, k_{qH1}, k_{qH2}, k_0\) are coefficients for current calculation. The proportional and integral gains of the PI controller are denoted as \(k_{op}\) and \(k_{oi}\).
The control logic can be summarized as follows. When a voltage dip or swell occurs, the reactive power outer loop is disconnected, and a reactive current generator is used in cascade with the inner loop to improve reactive response speed and provide appropriate voltage support according to the magnitude of voltage deviation. For active power control, during low voltage faults, the active power outer loop is disconnected and a reactive power priority control strategy is adopted. After fault clearance, active power is restored at a predefined ramp rate. During high voltage faults, the active power outer loop maintains steady-state grid-connected operation, and active power is kept constant by reducing the active current.
Model Construction on MATLAB and ADPSS Platforms
Based on the proposed generic low and high voltage fault ride-through control method, we constructed simulation models of a 200 kW battery energy storage system on both the MATLAB and ADPSS platforms. The model structure comprises three main components: the main circuit, the control circuit, and the measurement circuit.
Main Circuit Configuration
The main circuit includes the battery energy storage model, dual DC bus capacitors, an averaged converter, an LCL filter, and a step-up transformer. For the battery characteristics modeling, we adopted an improved Rint model to simulate the external characteristics of the lithium-ion battery. In this model, a controlled voltage source is used to represent the battery behavior under different operating conditions. The voltage expressions for charging and discharging modes are:
$$E_{charge} = E_0 – K\frac{Q}{Q – i_s} (i^* – i_s) + A e^{-B i_s}$$
$$E_{discharge} = E_0 – K\frac{Q}{i_s + 0.1Q} – K\frac{Q}{Q – i_s} i_s + A e^{-B i_s}$$
Here, \(E_0\) is the nominal voltage, \(K\) is the polarization voltage, \(Q\) is the battery capacity, \(i_s\) is the integral current, \(i^*\) is the filtered current, and \(A\) and \(B\) are parameters characterizing the exponential voltage drop and time constant.
The main circuit parameters are summarized in the following table:
| Parameter | Value | Unit |
|---|---|---|
| Rated power | 200 | kW |
| DC side rated voltage | 800 | V |
| DC side capacitance | 2960 | μF |
| Converter output filter resistance | 0.05 | Ω |
| Converter output filter inductance | 185 | μF |
| Transformer turns ratio | 35 kV / 800 V | – |
| High-side winding resistance | 0.0048 | p.u. |
| Low-side winding resistance | 0.0048 | p.u. |
| High-side leakage reactance | 0.035 | p.u. |
| Low-side leakage reactance | 0.035 | p.u. |
Control and Measurement Circuits
The external power characteristics of the battery energy storage system are primarily determined by the control circuit. The control parameters are designed according to standard practices for grid-connected converters. The measurement circuit is responsible for acquiring voltage and current signals, performing electrical quantity transformations, power calculations, and fault flag generation. The key parameters of the control circuit and measurement circuit are presented below.
| Parameter | Value | Unit |
|---|---|---|
| Active power outer loop proportional gain | 0.5 | – |
| Active power outer loop integral gain | 10 | – |
| Reactive power outer loop proportional gain | 0.5 | – |
| Reactive power outer loop integral gain | 10 | – |
| Current inner loop proportional gain | 1.2 | – |
| Current inner loop integral gain | 50 | – |
| Active current maximum limit | 1.05 | p.u. |
| Reactive current maximum limit | 1.05 | p.u. |
| Active power ramp rate | 0.5 | p.u./s |
| Reactive power ramp rate | 0.5 | p.u./s |
| Parameter | Value | Unit |
|---|---|---|
| Voltage measurement low-pass filter time constant | 0.01 | s |
| Current measurement low-pass filter time constant | 0.01 | s |
| Low voltage ride-through entry threshold | 0.89 | p.u. |
| Low voltage ride-through exit threshold | 0.91 | p.u. |
| High voltage ride-through entry threshold | 1.10 | p.u. |
| High voltage ride-through exit threshold | 1.08 | p.u. |
Response Characteristic Comparison Between MATLAB and ADPSS Models
To evaluate the accuracy of the battery energy storage system models developed on the two platforms, we conducted a comprehensive comparison of steady-state and transient response characteristics using the manufacturer packaged model test data as the reference benchmark.
Steady-State Characteristics
Power perturbation tests were performed by gradually changing the active or reactive power reference commands to assess the power tracking capability of the battery energy storage system during normal operation. The results revealed that while the MATLAB model exhibited consistent trends with the manufacturer packaged model in terms of steady-state voltage, active current, and reactive current, the ADPSS model showed notable deviations. For instance, during a reactive power test at a specific time point, the positive sequence voltage and reactive current outputs from the ADPSS model were 0.999 p.u. and -1.001 p.u., respectively, whereas the manufacturer packaged model yielded 0.925 p.u. and -1.081 p.u.
Transient Characteristics Under Voltage Faults
To compare transient response characteristics, we simulated grid voltage dip and swell events by introducing grounding resistance and shunt capacitance at the grid side. For the voltage dip scenario with an initial discharge power of 1.0 p.u. and a symmetrical voltage drop to 0.5 p.u., the transient response curves showed that the MATLAB model maintained consistent transient trends with the manufacturer packaged model throughout the entire fault period. In contrast, the ADPSS model exhibited significant discrepancies, including differences in reactive power amplitude and a noticeable lag in control strategy switching time during fault occurrence. For active power, the ADPSS model showed an instantaneous current spike reaching 1.15 p.u. after fault inception, while the manufacturer packaged model maintained the active current below the maximum limit of 1.05 p.u. without any significant spike.
The weighted average deviations between the simulation results and the manufacturer packaged model test data were calculated for multiple electrical quantities. The MATLAB model demonstrated deviations substantially lower than the standard maximum allowable deviation, while the ADPSS model showed larger deviations, particularly for voltage, reactive current, and active power.
Analysis of Module-Level Consistencies and Differences
To identify the root causes of the observed discrepancies in the ADPSS battery energy storage system model, we conducted a detailed comparative analysis at the module level across three categories: main circuit, control circuit, and measurement circuit.
Main Circuit Differences
When the grid voltage was set to 1.0 p.u., the transformer low-side voltages for the ADPSS and MATLAB models were 0.990 p.u. and 0.981 p.u., respectively. Through detailed comparison, we found that while both models used identical transformer modules, the single-phase equivalent circuits used for parameter calculation differed. The ADPSS platform represents the transformer using an R-L coupled branch with a single-phase equivalent circuit that includes excitation branch resistance \(R_m\) and reactance \(X_m\). In contrast, the MATLAB platform uses a different equivalent circuit with excitation branch resistance \(R_z\) and reactance \(X_z\). The equivalent circuit representations are summarized below.
| Component | ADPSS Platform | MATLAB Platform |
|---|---|---|
| Excitation branch resistance | \(R_m\) (computed from physical parameters) | \(R_z\) (computed from physical parameters) |
| Excitation branch reactance | \(X_m\) (computed from physical parameters) | \(X_z\) (computed from physical parameters) |
| Winding 1 resistance | \(R_1\) | \(R_1\) |
| Winding 2 resistance | \(R_2\) | \(R_2\) |
| Winding 1 leakage reactance | \(X_1\) | \(X_1\) |
| Winding 2 leakage reactance | \(X_2\) | \(X_2\) |
Due to differences in the internal packaging of the transformer module between the two platforms, using identical parameter settings resulted in different port voltages, thereby causing steady-state characteristic discrepancies in the battery energy storage system models.
Control Circuit Differences
When the same power step command was applied to the control loops of both models, the transient response of the active current reference from the outer power loop showed distinct differences. The MATLAB model PI controller output was effectively limited to the active current maximum of 1.05 p.u., while the ADPSS model PI controller output exhibited a pronounced spike exceeding this limit.
Investigation into the internal structure of the PI controllers revealed the fundamental cause. The ADPSS PI controller applies output limiting to the integral term only, with the final output being the sum of the proportional term and the limited integral term. The MATLAB PI controller, in contrast, applies output limiting at the overall output port. This structural difference is illustrated conceptually as follows:
For the ADPSS platform PI controller:
$$Y = k_p \Delta X + \text{limiter}\left( \frac{1}{T} \int \Delta X \, dt \right)$$
For the MATLAB platform PI controller:
$$Y = \text{limiter}\left( k_p \Delta X + k_i \int \Delta X \, dt \right)$$
where \(Y\) is the output, \(\Delta X\) is the input error, \(k_p\) is the proportional gain, \(T\) is the time constant in ADPSS, and \(k_i\) is the integral gain in MATLAB. This difference in limiting mechanism explains the transient spike observed in the ADPSS model.
Measurement Circuit Differences
The transient characteristic discrepancies observed during fault conditions were partially attributed to differences in the control strategy switching timing, which is determined by the fault flag generated by the hysteresis comparator. The ADPSS platform hysteresis comparator operates based on an interval average value \(\mu_M\) and an interval margin \(\gamma_{HY}\). The MATLAB platform hysteresis comparator uses turn-on and turn-off thresholds \(Y_{ON}\) and \(Y_{OFF}\).
For the ADPSS platform, the switching thresholds are:
$$\text{Turn-on threshold} = \mu_M – \gamma_{HY}$$
$$\text{Turn-off threshold} = \mu_M + \gamma_{HY}$$
For the MATLAB platform, the switching thresholds are directly specified as \(Y_{ON}\) and \(Y_{OFF}\). When the hysteresis comparator parameters are not properly matched between the two platforms, the control strategy switching timing differs, leading to transient response discrepancies in the battery energy storage system model.
Model Calibration Methodology for ADPSS Platform
Based on the identified module-level differences, we developed a systematic calibration methodology for the ADPSS battery energy storage system model. The calibration approach addresses three key areas: main circuit parameter adjustment, control circuit structure modification, and measurement circuit parameter matching.
Main Circuit Calibration
The main circuit discrepancy between the two platforms primarily stems from the difference in transformer equivalent circuit representation. To eliminate this discrepancy, we derived calibration formulas for the ADPSS transformer excitation branch resistance and reactance based on the MATLAB equivalent circuit parameters:
$$R_m = \frac{R_z X_z^2}{R_z^2 + X_z^2}$$
$$X_m = \frac{R_z^2 X_z}{R_z^2 + X_z^2}$$
Additionally, parameter conversion between physical values and per-unit values in ADPSS follows the standard formulas:
$$R_{1,pu} = R_{2,pu} = \frac{P_k S_b}{2000 S_N^2}$$
$$X_{1,pu} = X_{2,pu} = \frac{U_k S_b}{200 S_N}$$
$$G_{m,pu} = \frac{P_0}{1000 S_N}$$
$$B_{m,pu} = \frac{I_0 S_N}{100 S_b}$$
Here, \(P_k\) is the short-circuit loss, \(U_k\) is the short-circuit voltage percentage, \(P_0\) is the no-load loss, \(I_0\) is the no-load current percentage, \(S_b\) is the base capacity, and \(S_N\) is the transformer rated capacity. After calibration, with the grid voltage set to 1.0 p.u., the transformer low-side voltages of both models converged to 1.006 p.u., confirming the effectiveness of the main circuit calibration method.
Control Circuit Calibration
To address the PI controller output limiting discrepancy, we modified the ADPSS PI controller structure. The calibration approach involves setting the internal maximum and minimum output limits of the PI controller to infinity and adding an independent limiting element after the PI controller. The calibrated PI controller structure is represented as:
$$Y = \text{limiter}\left( k_p \Delta X + \frac{1}{T} \int \Delta X \, dt \right)$$
This modification ensures that the output limiting behavior matches that of the MATLAB PI controller. After calibration, when the same power step command was applied to both models, the active current reference outputs from the power outer loop exhibited identical transient trends with the maximum value limited to 1.05 p.u.
Measurement Circuit Calibration
To correct the control strategy switching timing error caused by hysteresis comparator parameter mismatch, we established the relationship between the ADPSS and MATLAB hysteresis comparator parameters:
$$Y_{ON} = \mu_M + \gamma_{HY}$$
$$Y_{OFF} = \mu_M – \gamma_{HY}$$
The output channel correspondence between the two platforms is summarized below.
| MATLAB Output Setting | ADPSS Corresponding Channel |
|---|---|
| Turn-on output = 1, Turn-off output = 0 | High-level output channel |
| Turn-on output = 0, Turn-off output = 1 | Low-level output channel |
For a specific application example, to set the low voltage fault hysteresis comparator with MATLAB parameters of turn-on threshold 0.91 p.u. and turn-off threshold 0.89 p.u., the calibrated ADPSS parameters would be \(\mu_M = 0.90\) and \(\gamma_{HY} = 0.01\). After calibration, the fault flag waveforms of both models showed identical switching timing during grid voltage dips, validating the hysteresis comparator calibration method.
Verification of Calibrated ADPSS Model
To validate the effectiveness of the proposed calibration methodology, we conducted comprehensive fault ride-through tests following standard test procedures. The calibrated ADPSS battery energy storage system model was tested under various voltage dip and swell scenarios, and the results were compared with manufacturer packaged model test data.
Low Voltage Fault Ride-Through Verification
Two representative low voltage fault scenarios were considered: a voltage dip to 0.2 p.u. lasting 0.625 seconds and a voltage dip to 0.5 p.u. lasting 1.21 seconds, both with an initial discharge power of 1.0 p.u. The response characteristics before, during, and after calibration are summarized in the following table.
| Scenario | Electrical Quantity | Pre-Calibration Deviation (%) | Post-Calibration Deviation (%) | Standard Limit (%) |
|---|---|---|---|---|
| Voltage dip to 0.2 p.u. | Positive sequence voltage | 4.82 | 0.95 | 2.00 |
| Active power | 8.37 | 1.23 | 3.00 | |
| Reactive power | 7.94 | 1.08 | 3.00 | |
| Reactive current | 12.53 | 1.63 | 3.00 | |
| Voltage dip to 0.5 p.u. | Positive sequence voltage | 3.76 | 0.72 | 2.00 |
| Active power | 6.91 | 0.89 | 3.00 | |
| Reactive power | 6.18 | 0.76 | 3.00 | |
| Reactive current | 9.45 | 1.21 | 3.00 |
The results demonstrate that the calibrated ADPSS model achieves significant improvement in accuracy, with all weighted average deviations reduced to below 1.63% compared to pre-calibration deviations that reached up to 12.53%. The post-calibration response curves closely match the manufacturer packaged model data in terms of both steady-state values and transient trends.
High Voltage Fault Ride-Through Verification
Two high voltage fault scenarios were examined: a voltage swell to 1.25 p.u. lasting 1.0 second and a voltage swell to 1.3 p.u. lasting 0.5 seconds, both with an initial discharge power of 1.0 p.u. The comparison results are presented below.
| Scenario | Electrical Quantity | Pre-Calibration Deviation (%) | Post-Calibration Deviation (%) | Standard Limit (%) |
|---|---|---|---|---|
| Voltage swell to 1.25 p.u. | Positive sequence voltage | 3.45 | 0.68 | 2.00 |
| Active power | 5.73 | 0.82 | 3.00 | |
| Reactive power | 5.26 | 0.71 | 3.00 | |
| Reactive current | 8.14 | 1.05 | 3.00 | |
| Voltage swell to 1.3 p.u. | Positive sequence voltage | 4.01 | 0.83 | 2.00 |
| Active power | 6.42 | 0.97 | 3.00 | |
| Reactive power | 5.89 | 0.79 | 3.00 | |
| Reactive current | 9.12 | 1.18 | 3.00 |
The calibrated ADPSS model shows excellent agreement with the manufacturer packaged model for high voltage fault scenarios as well. The post-calibration deviations for all electrical quantities are well within the standard allowable limits, confirming the effectiveness of the proposed calibration methodology.
Comprehensive Error Analysis
To quantify the overall improvement achieved through calibration, we computed weighted average deviations across multiple operating conditions using the standard formula:
$$F_G = 0.1 F_{1,A} + 0.6 F_{1,B} + 0.3 F_{1,C}$$
where \(F_{1,A}\), \(F_{1,B}\), and \(F_{1,C}\) represent the steady-state interval average deviations for the pre-fault, during-fault, and post-fault stages, respectively. The steady-state interval average deviation \(F_1\) and transient interval average deviation \(F_2\) are calculated as:
$$F_n = \left| \frac{\sum_{i=K_{Start}}^{K_{End}} (X_M(i) – X_S(i))}{K_{End} – K_{Start} + 1} \right|, \quad n = 1,2$$
The steady-state maximum deviation \(F_3\) is:
$$F_3 = \max_i \left| X_S(i) – X_M(i) \right|$$
Here, \(X_M(i)\) and \(X_S(i)\) are the per-unit values of the i-th electrical quantity from the manufacturer packaged model test data and the simulation model data, respectively. \(K_{Start}\) and \(K_{End}\) are the data indices defining the evaluation interval.
The comprehensive error analysis across all tested fault scenarios is summarized below.
| Fault Scenario | Calibration Status | Voltage Deviation (%) | Active Power Deviation (%) | Reactive Power Deviation (%) | Active Current Deviation (%) | Reactive Current Deviation (%) |
|---|---|---|---|---|---|---|
| Low voltage (0.2 p.u.) | Pre-calibration | 4.82 | 8.37 | 7.94 | 6.15 | 12.53 |
| Post-calibration | 0.95 | 1.23 | 1.08 | 0.87 | 1.63 | |
| Low voltage (0.5 p.u.) | Pre-calibration | 3.76 | 6.91 | 6.18 | 4.82 | 9.45 |
| Post-calibration | 0.72 | 0.89 | 0.76 | 0.64 | 1.21 | |
| High voltage (1.25 p.u.) | Pre-calibration | 3.45 | 5.73 | 5.26 | 3.98 | 8.14 |
| Post-calibration | 0.68 | 0.82 | 0.71 | 0.59 | 1.05 | |
| High voltage (1.3 p.u.) | Pre-calibration | 4.01 | 6.42 | 5.89 | 4.36 | 9.12 |
| Post-calibration | 0.83 | 0.97 | 0.79 | 0.71 | 1.18 |
The results clearly demonstrate that the proposed calibration methodology reduces the response deviations of the ADPSS battery energy storage system model to within 2% for all tested fault scenarios, significantly below the standard allowable limits. This confirms that the calibrated ADPSS model can accurately replicate the dynamic behavior of real battery energy storage systems under various grid fault conditions.
Mapping of Module Differences to Response Characteristic Discrepancies
The systematic analysis of module-level differences and their impacts on overall response characteristics is essential for understanding the calibration requirements. The following table summarizes the key mapping relationships identified in this study.
| Circuit Category | Module Difference | Resulting Response Discrepancy |
|---|---|---|
| Main circuit | Transformer equivalent circuit representation difference | Steady-state amplitude differences in all electrical quantities |
| Control circuit | PI controller output limiting mechanism difference | Transient active current spike after fault inception |
| Measurement circuit | Hysteresis comparator signal generation principle difference | Control strategy switching timing differences during and after faults |
These mappings highlight the importance of addressing each module-level difference to achieve accurate electromagnetic transient simulation of battery energy storage systems on the ADPSS platform. The calibration methodology developed in this study systematically resolves all three categories of discrepancies, resulting in a high-fidelity simulation model.
Discussion on Numerical Solution Aspects
While the calibration methodology presented in this work effectively eliminates discrepancies arising from mathematical model differences, it is important to note that numerical solution aspects, including matrix computation methods and solver algorithms, may also contribute to simulation accuracy differences between platforms. The ADPSS platform employs specific numerical integration methods and linear equation solvers that differ from those used in MATLAB. These numerical aspects can influence transient response accuracy, particularly during fast switching events and fault transients.
Future work should investigate the impacts of numerical solution differences on the electromagnetic transient simulation accuracy of battery energy storage systems. This includes studying the effects of time step size, integration algorithm order, and solver tolerance settings on simulation results. By combining the calibration methodology proposed in this work with optimized numerical solution settings, it is possible to further enhance the accuracy and efficiency of ADPSS-based battery energy storage system simulations.
Conclusions and Contributions
In this work, we have developed a comprehensive electromagnetic transient modeling and verification methodology for battery energy storage systems using the ADPSS simulation platform. The key contributions and findings are summarized as follows.
First, we designed a generic low and high voltage fault ride-through control strategy for battery energy storage systems. This control strategy integrates reactive power support requirements specified in grid codes with practical fault response characteristics of mainstream battery energy storage units. The control method automatically switches between steady-state and fault operation modes based on voltage magnitude, providing appropriate reactive current injection during voltage dips and swells while maintaining active power regulation capability.
Second, we constructed electromagnetic transient simulation models of a 200 kW battery energy storage system on both the MATLAB and ADPSS platforms. Through systematic comparison of simulation results with manufacturer packaged model test data, we verified that the MATLAB model achieves higher consistency with actual system response characteristics. The ADPSS model exhibited notable discrepancies in both steady-state and transient responses, including amplitude errors and waveform distortions.
Third, we conducted a detailed module-level comparative analysis to identify the root causes of response characteristic discrepancies. Three key differences were identified: the transformer equivalent circuit representation in the main circuit, the PI controller output limiting mechanism in the control circuit, and the hysteresis comparator parameterization in the measurement circuit. The specific impacts of each difference on overall system response were characterized and mapped.
Fourth, we proposed a systematic calibration methodology for the ADPSS battery energy storage system model, addressing all three categories of module-level differences. The calibration methods include parameter adjustment formulas for the transformer excitation branch, structural modification of the PI controller with external limiting, and parameter matching rules for hysteresis comparators. The calibration methodology is practical and can be implemented without modifying the core solver of the ADPSS platform.
Fifth, we validated the calibrated ADPSS model through comprehensive fault ride-through tests covering voltage dips from 0.2 p.u. to 0.9 p.u. and voltage swells from 1.1 p.u. to 1.4 p.u. The results demonstrated that post-calibration response deviations were reduced to within 2% for all tested scenarios, significantly below the standard allowable limits. The calibrated model accurately reproduces the steady-state and transient behavior of the manufacturer packaged model, including fault inception transients, fault period dynamics, and post-fault recovery characteristics.
The developed modeling and verification methodology enables high-fidelity electromagnetic transient simulation of battery energy storage systems on the domestically developed ADPSS platform. This contributes to reducing dependence on foreign simulation software and supports the broader application of ADPSS for power system analysis and design. The methodology is particularly valuable for utility companies, research institutions, and system operators who need to study the dynamic interactions between large-scale battery energy storage systems and power grids using domestic simulation tools.
Future research directions include extending the calibration methodology to other types of energy storage systems, such as flow batteries and supercapacitors, and investigating the impacts of numerical solution differences between platforms on simulation accuracy. Additionally, the development of standardized calibration procedures and automated tools would facilitate the widespread adoption of the methodology in practical engineering applications.
| Calibration Domain | Equation | Description |
|---|---|---|
| Transformer parameters | \(R_m = \frac{R_z X_z^2}{R_z^2 + X_z^2}\) | Excitation branch resistance calibration |
| \(X_m = \frac{R_z^2 X_z}{R_z^2 + X_z^2}\) | Excitation branch reactance calibration | |
| Per-unit conversion | \(R_{1,pu} = R_{2,pu} = \frac{P_k S_b}{2000 S_N^2}\) | Winding resistance per-unit conversion |
| \(X_{1,pu} = X_{2,pu} = \frac{U_k S_b}{200 S_N}\) | Winding leakage reactance per-unit conversion | |
| \(G_{m,pu} = \frac{P_0}{1000 S_N}\) | Excitation conductance per-unit conversion | |
| \(B_{m,pu} = \frac{I_0 S_N}{100 S_b}\) | Excitation susceptance per-unit conversion | |
| PI controller | \(Y = \text{limiter}\left( k_p \Delta X + \frac{1}{T} \int \Delta X \, dt \right)\) | Calibrated PI controller structure with external limiting |
| Hysteresis comparator | \(Y_{ON} = \mu_M + \gamma_{HY}\) | Turn-on threshold calibration |
| \(Y_{OFF} = \mu_M – \gamma_{HY}\) | Turn-off threshold calibration | |
| Error metrics | \(F_n = \left| \frac{\sum_{i=K_{Start}}^{K_{End}} (X_M(i) – X_S(i))}{K_{End} – K_{Start} + 1} \right|\) | Interval average deviation for steady-state (\(n=1\)) and transient (\(n=2\)) |
| \(F_3 = \max_i \left| X_S(i) – X_M(i) \right|\) | Steady-state maximum deviation | |
| \(F_G = 0.1 F_{1,A} + 0.6 F_{1,B} + 0.3 F_{1,C}\) | Weighted average deviation |
In conclusion, this work establishes a rigorous framework for developing accurate electromagnetic transient models of battery energy storage systems on the ADPSS simulation platform. The proposed methodology bridges the gap between domestic simulation tools and high-precision modeling requirements, supporting the advancement of power system simulation technology and the integration of renewable energy resources.