
The imperative to mitigate climate change has catalyzed a global transition towards sustainable energy, with numerous nations committing to carbon neutrality. Electric vehicles (EVs), encompassing battery electric vehicles (BEVs), plug-in hybrid electric vehicles (PHEVs), and hybrid electric vehicles (HEVs), are pivotal in this shift by reducing dependence on fossil fuels and lowering greenhouse gas emissions. The lithium-ion battery stands as the dominant power source for modern EVs due to its superior energy density, long cycle life, and declining cost. However, the performance, safety, and longevity of lithium-ion batteries are critically dependent on their operating temperature. An optimal range, typically between 20°C and 40°C, is essential to prevent accelerated aging and hazardous conditions like thermal runaway. Consequently, elucidating the heat generation mechanisms within lithium-ion batteries and developing high-precision thermal management technologies are crucial for maximizing their potential.
Numerical simulation, offering advantages of low resource consumption and short development cycles, is extensively employed for thermal analysis and thermal management system (TMS) design for lithium-ion batteries. The accuracy of the battery thermal model is paramount for reliable TMS simulation outcomes. Thermal models for lithium-ion batteries are generally categorized into uncoupled thermal models, electrical-thermal models, and electrochemical-thermal models. The first two types often rely on empirical or equivalent circuit models. Their accuracy is highly contingent on macroscopic test data, limiting their generality. More importantly, they cannot resolve internal multi-physics field distributions or describe intrinsic heat generation mechanisms.
In contrast, the electrochemical-thermal coupling model integrates a physics-based electrochemical model with a thermal model. The electrochemical model, typically based on the Newman Pseudo-Two-Dimensional (P2D) framework, describes the fundamental physicochemical processes in battery components—current collectors, electrodes, and separator—revealing distributions of concentration and potential fields. This model offers high fidelity and is widely used for battery design optimization and analysis of electrochemical and thermal behaviors. However, a fully resolved three-dimensional layered electrochemical-thermal model becomes computationally prohibitive at the cell or module scale. A lumped thermal model approach, which simplifies the internal layered structure and couples a one-dimensional electrochemical model with a three-dimensional thermal model, effectively addresses this challenge for cell-scale simulations while retaining spatial information along the thickness direction.
Existing lumped models often oversimplify by using a single, volume-averaged electrochemical model for the entire thermal domain. This approach cannot capture the electrochemical heterogeneity induced by temperature gradients within the cell. Furthermore, as the simulation scale expands to module or pack levels, especially when coupled with fluid dynamics for TMS design, conventional electrochemical-thermal models still face significant computational burdens, necessitating further simplification.
To bridge this gap, this work develops a novel electrochemical-thermal coupling model for lithium-ion batteries based on an explicit numerical scheme within the open-source platform OpenFOAM. The model employs a refined lumped approach where a one-dimensional electrochemical sub-model is explicitly coupled with a three-dimensional thermal sub-model at every computational grid of the thermal domain. This design enables the efficient simulation of large-scale systems while accounting for local temperature-dependent electrochemical variations. The model is validated against experimental data across various C-rates. Subsequently, it is utilized to analyze internal resistance evolution, heat generation mechanisms, and the impact of cell inconsistency on thermal distribution within a battery module.
Model Development
Model Description and Assumptions
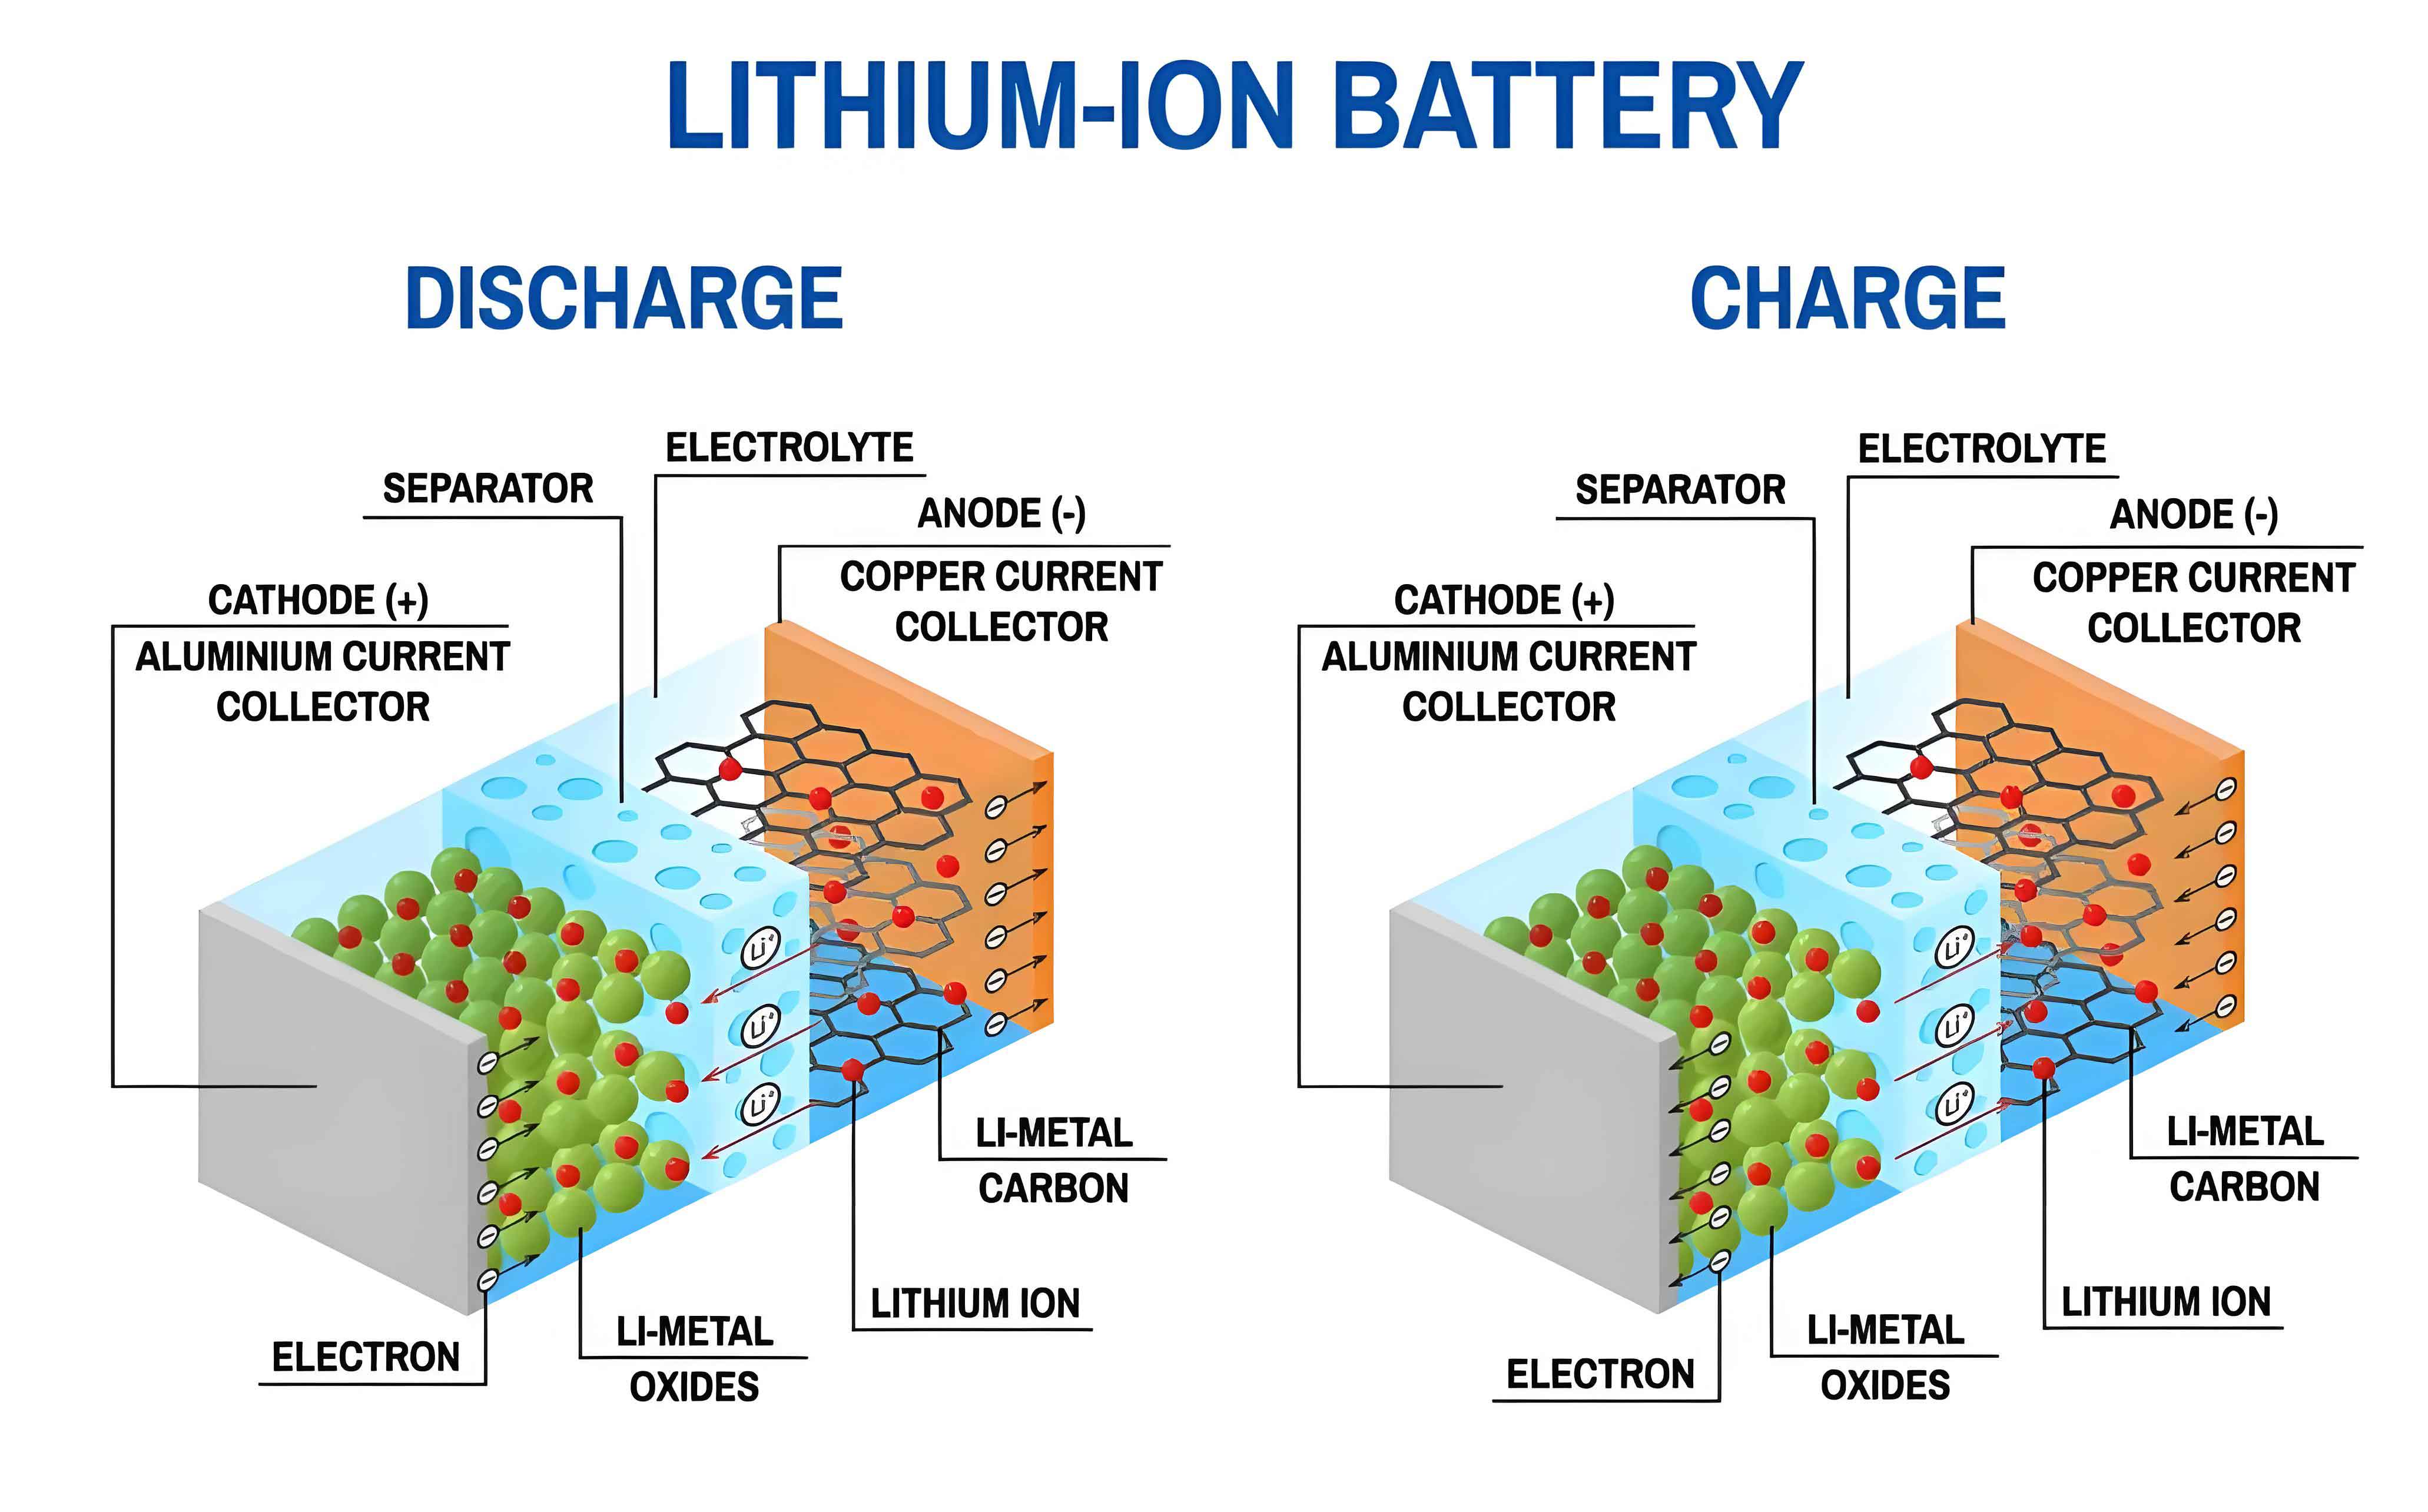
The core working unit of a lithium-ion battery is the cell, constructed by stacking or winding multilayer electrodes. A single electrode pair consists of a negative current collector (copper foil), negative electrode (e.g., graphite), separator, positive electrode (e.g., NCM), and positive current collector (aluminum foil). The present model simplifies this layered structure into a homogeneous three-dimensional domain for thermal analysis while solving the electrochemical dynamics along a representative one-dimensional line through the cell thickness.
The key assumptions of the model are:
1. The active materials (graphite and NCM) are composed of spherical particles of uniform size.
2. No side reactions or gas generation occurs.
3. The electrochemical model is one-dimensional, capturing variations only along the electrode thickness, while the thermal model is three-dimensional.
4. For computational efficiency, each battery component (e.g., anode, separator) is treated as a single node in the thickness direction within the electrochemical solver, but the coupling with the thermal model is performed per thermal grid.
Governing Equations
The electrochemical sub-model is governed by conservation equations for charge and species.
Charge Conservation in the Solid Phase:
$$ \frac{\partial}{\partial x} \left( \sigma^{\text{eff}}_s \frac{\partial \phi_s}{\partial x} \right) – j = 0 $$
where $\phi_s$ is the solid phase potential, $\sigma^{\text{eff}}_s$ is the effective solid phase conductivity, and $j$ is the volumetric exchange current density.
Charge Conservation in the Liquid Phase:
$$ \frac{\partial}{\partial x} \left( \sigma^{\text{eff}}_e \frac{\partial \phi_e}{\partial x} + k^{\text{eff}}_D \frac{\partial (\ln c_e)}{\partial x} \right) + j = 0 $$
where $\phi_e$ is the liquid phase potential, $\sigma^{\text{eff}}_e$ is the effective liquid phase conductivity, $c_e$ is the electrolyte lithium-ion concentration, and $k^{\text{eff}}_D$ is the diffusion conductivity.
Lithium Conservation in the Solid Phase (Spherical Particle):
$$ \frac{\partial c_s}{\partial t} = \frac{1}{r^2} \frac{\partial}{\partial r} \left( D_s r^2 \frac{\partial c_s}{\partial r} \right) $$
with the boundary condition at the particle surface:
$$ -D_s \left. \frac{\partial c_s}{\partial r} \right|_{r=r_s} = \frac{j}{a_s F} $$
where $c_s$ is the solid phase Li concentration, $D_s$ is the solid diffusion coefficient, $r_s$ is the particle radius, $a_s$ is the specific surface area ($3\epsilon_s/r_s$), and $F$ is Faraday’s constant.
Lithium Conservation in the Liquid Phase:
$$ \frac{\partial (\epsilon_e c_e)}{\partial t} = \frac{\partial}{\partial x} \left( D^{\text{eff}}_e \frac{\partial c_e}{\partial x} \right) + \frac{(1 – t^+)}{F} j $$
where $\epsilon_e$ is the electrolyte phase volume fraction, $D^{\text{eff}}_e$ is the effective liquid diffusion coefficient, and $t^+$ is the transference number.
Butler-Volmer Kinetics:
The charge transfer reaction at the solid-electrolyte interface is governed by:
$$ j = a_s i_0 \left\{ \exp\left( \frac{\alpha_a F}{RT} \eta \right) – \exp\left( -\frac{\alpha_c F}{RT} \eta \right) \right\} $$
where $i_0$ is the exchange current density, $\alpha_a$ and $\alpha_c$ are anodic and cathodic transfer coefficients, and $\eta$ is the surface overpotential.
$$ i_0 = F k c_e^{\alpha_a} (c_{s,\text{max}} – c_{s,\text{sur}})^{\alpha_a} c_{s,\text{sur}}^{\alpha_c} $$
$$ \eta = \phi_s – \phi_e – U – \frac{j}{a_s} R_{\text{film}} $$
Here, $k$ is the reaction rate constant, $c_{s,\text{sur}}$ and $c_{s,\text{max}}$ are the surface and maximum solid-phase concentrations, $U$ is the open-circuit potential, and $R_{\text{film}}$ is the film resistance.
Energy Conservation (Thermal Sub-model):
Ignoring internal convection and radiation, the three-dimensional heat equation is:
$$ \frac{\partial (\rho C_p T)}{\partial t} = \nabla \cdot (\lambda \nabla T) + \dot{q}_{\text{gen}} $$
where $\rho$ is density, $C_p$ is specific heat capacity, $\lambda$ is thermal conductivity, and $\dot{q}_{\text{gen}}$ is the volumetric heat generation rate. The heat generation comprises three sources: reaction heat, activation heat, and ohmic heat, which serve as the coupling terms from the electrochemical model:
$$ \dot{q}_{\text{gen}} = \dot{q}_{\text{rea}} + \dot{q}_{\text{act}} + \dot{q}_{\text{ohm}} $$
$$ \dot{q}_{\text{rea}} = \int_0^L j T \frac{\Delta S}{nF} \, dx / L $$
$$ \dot{q}_{\text{act}} = \int_0^L j (\phi_s – \phi_e – U) \, dx / L $$
$$ \dot{q}_{\text{ohm}} = \int_0^L \left[ \sigma^{\text{eff}}_s \left( \frac{\partial \phi_s}{\partial x} \right)^2 + \sigma^{\text{eff}}_e \left( \frac{\partial \phi_e}{\partial x} \right)^2 + k^{\text{eff}}_D \left( \frac{\partial \ln c_e}{\partial x} \right) \left( \frac{\partial \phi_e}{\partial x} \right) \right] dx / L $$
where $L$ is the total thickness of the electrochemical domain, and $\Delta S$ is the entropy change of the electrode reaction.
The effective properties for the homogeneous 3D thermal domain are calculated as volume or thickness averages:
$$ \rho = \frac{\sum \rho_i V_i}{\sum V_i}, \quad C_p = \frac{\sum C_{p,i} V_i}{\sum V_i} $$
$$ \lambda_y = \lambda_z = \frac{\sum \lambda_i l_i}{\sum l_i}, \quad \lambda_x = \frac{\sum l_i}{\sum (l_i / \lambda_i)} $$
where subscript $i$ denotes different cell components (current collectors, electrodes, separator).
Explicit Numerical Formulation
A key innovation of this model is the use of an explicit discretization scheme for the one-dimensional electrochemical sub-model. This approach directly solves the governing equations without the iterative solver required for the implicit treatment of charge conservation equations, significantly enhancing computational efficiency for large-scale thermal management simulations.
The spatial domain is discretized into nodes representing the negative current collector (nc), negative electrode (ne), separator (sp), positive electrode (pe), and positive current collector (pc). The potential equations are explicitly solved. For instance, the solid potential in the negative electrode is calculated as:
$$ \phi_{s,\text{ne}}^t = \frac{I_{\text{app}} l_{\text{nc}}}{2 \sigma_{s,\text{nc}}} + \phi_{s,\text{nc}}^t $$
where $I_{\text{app}}$ is the applied current, $l$ is thickness, and $t$ denotes the current time step. The liquid potential at interfaces is solved using explicit forms of the conservation equation, accounting for concentration gradients.
The electrolyte concentration is updated explicitly. For the negative electrode node:
$$ c_{e,\text{ne}}^{t+\Delta t} = c_{e,\text{ne}}^{t} + \frac{D_{e,\text{ne}\text{sp}} \Delta t}{\epsilon_{e,\text{ne}} l_{\text{ne}}} \frac{c_{e,\text{sp}}^{t} – c_{e,\text{ne}}^{t}}{(l_{\text{sp}} + l_{\text{ne}})/2} – \frac{(1-t^+) I_{\text{app}} \Delta t}{\epsilon_{e,\text{ne}} l_{\text{ne}} F} $$
The solid-phase diffusion equation is solved using a five-node finite difference method explicit in time. For an internal node $k$ in a particle:
$$ c_{s,k}^{t+\Delta t} = \frac{A D_s \Delta t}{r^2} c_{s,k-1}^t + \left(1 – \frac{B D_s \Delta t}{r^2}\right) c_{s,k}^t + \frac{C D_s \Delta t}{r^2} c_{s,k+1}^t $$
where A, B, and C are coefficients derived from the discretization of the spherical coordinate system. The surface node ($k=5$) includes the flux boundary condition from the Butler-Volmer equation.
This explicit formulation, while requiring careful adherence to stability criteria (via appropriate time-step selection), eliminates matrix solutions, leading to faster computation per time step. The thermal and electrochemical models are coupled at every cell of the 3D thermal mesh. Each thermal cell possesses its own instance of the 1D electrochemical model, receiving the local temperature and returning the locally computed heat generation rate $\dot{q}_{\text{gen}}$. This allows the model to capture the effect of temperature distribution on local electrochemical reaction rates and heat generation.
Model Parameters and Temperature Dependence
The model parameters for the graphite/NCM lithium-ion battery cell are listed in the tables below. Critical parameters exhibit temperature dependence, which is crucial for accurate thermal coupling.
| Parameter | Negative Current Collector | Negative Electrode | Separator | Positive Electrode | Positive Current Collector | Electrolyte |
|---|---|---|---|---|---|---|
| Thickness, $l$ (µm) | 10 | 64 | 25 | 53 | 15 | – |
| Active Material Volume Fraction, $\epsilon_s$ | – | 0.55 | – | 0.43 | – | – |
| Electrolyte Volume Fraction, $\epsilon_e$ | – | 0.32 | 0.4 | 0.33 | – | – |
| Particle Radius, $r_s$ (µm) | – | 10 | – | 5 | – | – |
| Max Solid Conc., $c_{s,\text{max}}$ (mol m⁻³) | – | 31370 | – | 68160 | – | – |
| Initial Stoichiometry, $x_0$ / $y_0$ | – | 0.9 | – | 0.38 | – | – |
| Initial Electrolyte Conc., $c_{e,0}$ (mol m⁻³) | – | – | – | – | – | 1000 |
| Electrical Conductivity, $\sigma_s$ (S m⁻¹) | 1.00E+07 | 100 | – | 10 | 3.77E+07 | – |
| Charge Transfer Coefficients, $\alpha_a$, $\alpha_c$ | – | 0.5, 0.5 | – | 0.5, 0.5 | – | – |
| Reaction Rate Constant, $k$ (m².⁵ mol⁻⁰.⁵ s⁻¹) | – | 2.507E-10 | – | 3.846E-11 | – | – |
| Activation Energy for $k$, $E_k$ (kJ mol⁻¹) | – | 68 | – | 50 | – | – |
| SEI Film Resistance, $R_{\text{film}}$ (Ω cm²) | – | 10 | – | 10 | – | – |
| Solid Diffusivity, $D_s$ (m² s⁻¹) | – | 1.6E-14(1.5-x)¹.⁵ | – | 3E-14 | – | – |
| Activation Energy for $D_s$, $E_D$ (kJ mol⁻¹) | – | 26 | – | 26 | – | – |
| Density, $\rho$ (kg m⁻³) | 8700 | 1889 | 492 | 2918 | 2700 | 1210 |
| Specific Heat, $C_p$ (J kg⁻¹ K⁻¹) | 396 | 641 | 1883 | 800 | 897 | 1518 |
| Thermal Conductivity, $\lambda$ (W m⁻¹ K⁻¹) | 398 | 1.04 | 0.5 | 1.48 | 237 | 0.099 |
| Property | Expression |
|---|---|
| Solid Diffusion Coefficient | $D_s(T) = D_{s,\text{ref}} \, \exp\left[ -\frac{E_D}{R} \left( \frac{1}{T} – \frac{1}{T_{\text{ref}}} \right) \right]$ |
| Liquid Diffusion Coefficient | $D_e(c_e, T) = 10^{-10} \times \exp(1.01 c_e) \times \exp\left(-\frac{1560}{T}\right) \times \exp\left(-\frac{487}{T} c_e\right) \times \epsilon_e^{1.5}$ |
| Ionic Conductivity | $\sigma_e(c_e, T) = \frac{0.521 (1 + (T – 228)) c_e \left(1 – 1.06\sqrt{c_e} + 0.353 c_e \left(1 – 0.00359 \exp\left(\frac{1000}{T}\right)\right)\right)}{1 + c_e^4 \left(0.00148 \exp\left(\frac{1000}{T}\right)\right)} \times \epsilon_e^{1.5}$ |
| Thermodynamic Factor | $k_D^{\text{eff}} = -\frac{2RT\sigma_e^{\text{eff}}}{F} \left(0.601 – 0.24c_e^{0.5} + 0.982(1 – 0.0052(T-294))c_e^{1.5} \right)$ |
| Reaction Rate Constant | $k(T) = k_{\text{ref}} \, \exp\left[ -\frac{E_k}{R} \left( \frac{1}{T} – \frac{1}{T_{\text{ref}}} \right) \right]$ |
| Open-Circuit Potential | $U(x, y, T) = U_{\text{oc,ref}}(x, y) + \frac{\Delta S(x, y)}{nF} (T – T_{\text{ref}})$ where $U_{\text{oc,ref}}$ for anode and cathode are empirical functions of stoichiometry $x$ and $y$. |
Results and Discussion
Model Validation
The developed explicit electrochemical-thermal model for the lithium-ion battery was validated against experimental data for both charge and discharge cycles at rates ranging from 1C to 5C under forced convection cooling (h = 60 W m⁻² K⁻¹). The simulated terminal voltage and surface temperature evolution show excellent agreement with measurements. As the C-rate increases, the terminal voltage decreases during discharge (and increases during charge) due to heightened polarization. The temperature rise accelerates with higher currents. During charging, the temperature rise rate gradually decreases. During discharge, a characteristic fast-slow-fast temperature rise pattern is observed, which will be explained later by analyzing heat generation components. The minor discrepancies at higher rates, particularly in temperature, likely stem from the model simplification that neglects inhomogeneous distributions within cell components, an effect that becomes more pronounced under strenuous operating conditions.
Analysis of Internal Resistance
The model provides insights into the evolution of different resistance components within the lithium-ion battery. The area-specific resistances (ASR) for diffusion, interfacial charge transfer, and ionic transport are analyzed during 3C operation. The diffusion and charge-transfer resistances for the anode and cathode exhibit roughly symmetrical patterns during charge and discharge, closely linked to the equilibrium potentials of the electrode materials. The anode shows higher charge-transfer resistance than the cathode, attributed to the larger particle size (and thus lower specific surface area) of the positive active material. The ionic resistance in the electrolyte displays a characteristic pattern: it initially increases due to the growing concentration gradient as reaction fronts propagate, then decreases in the later stages as the rising cell temperature enhances ion mobility and electrolyte conductivity. Overall, the ionic resistance is the dominant component, followed by charge-transfer and solid-diffusion resistances. This hierarchy and the evolutionary trends align well with established understanding, demonstrating the model’s capability to correctly capture internal state dynamics beyond just voltage and temperature.
Thermal Behavior and Heat Generation Mechanisms
A detailed breakdown of heat generation sources—reversible (entropic) heat, activation heat, and ohmic heat—is performed at different C-rates. At a low rate of 1C, the total heat generation profile closely follows the reversible heat, which is dictated by the entropy coefficient ($\Delta S$) of the electrode materials. Both activation and ohmic heat contributions are relatively small and comparable. As the discharge rate increases to 3C and 5C, a significant shift occurs: the ohmic heat in the electrolyte becomes the dominant source, surpassing the activation heat. The ohmic heat exhibits a peak during the mid-discharge period. This is because the initial rapid reaction creates steep concentration gradients, increasing ionic resistance. Subsequently, the self-heating of the lithium-ion battery elevates temperature, which improves ionic conductivity, thereby reducing the ohmic heat generation rate towards the end of discharge. This analysis clarifies that for high-power applications, thermal management strategies must primarily address ohmic heating.
The three-dimensional temperature distribution within a single cell during 3C operation was examined. The cell is cooled on all sides by convection. The results show the highest temperature at the core, decreasing towards the edges. The primary temperature gradient exists through the cell’s thickness (x-direction), a consequence of the lower effective through-plane thermal conductivity. A secondary gradient is observed from the top to the bottom, likely due to differences in heat dissipation through the cell casing. The maximum temperature difference within the cell increases with state-of-discharge (SOD), reaching about 1.01 K during charge and 1.17 K during discharge at 80% SOD. The discharge process shows a slightly larger temperature gradient, correlating with its different heat generation profile.
Impact of Cell-to-Cell Inconsistency on Module Thermal Distribution
The model’s efficiency allows for scaling up to module-level analysis. A module consisting of eight serially connected lithium-ion battery cells is simulated. A common issue in battery packs is cell inconsistency, arising from manufacturing variations or uneven aging. This study investigates the thermal impact of having one cell at a lower initial State of Charge (SOC) than its peers during a 3C module discharge under adiabatic conditions (simulating a poorly cooled scenario). Four cases were analyzed, where the inconsistent cell (initial SOC = 0.8, others at 1.0) was placed at different positions: Cell 1 (outermost), Cell 2, Cell 3, and Cell 4 (inner).
The results demonstrate that cell inconsistency significantly affects the maximum temperature difference ($\Delta T_{\text{max}}$) within the module. The impact is most severe when the inconsistent cell is located at the outermost position (Cell 1), yielding a final $\Delta T_{\text{max}}$ of 2.70 K. As the inconsistent cell’s position moves inward, the final $\Delta T_{\text{max}}$ decreases to 2.12 K, 2.02 K, and 1.95 K for positions 2, 3, and 4, respectively. This is because an internally located inconsistent cell is thermally “buffered” by surrounding cells, which helps equalize temperatures. The evolution of $\Delta T_{\text{max}}$ during discharge follows a complex non-monotonic trend, initially increasing, then plateauing or decreasing slightly, before rising sharply at the end. This trajectory is directly linked to the heat generation rate profile of a lithium-ion battery: the inconsistent cell, starting at a lower SOC, reaches the high-heat-generation end-of-discharge region earlier than the healthy cells, creating a large thermal mismatch.
The temperature distribution snapshots reveal the dynamic nature of hot-spot formation. When Cell 1 is inconsistent, it starts as the coolest cell as it operates in a lower heat generation regime initially. Heat flows into it from neighbors. Later, it becomes the hottest cell as it enters its high-heat generation phase while others are still in a moderate phase, reversing the heat flow direction. This analysis underscores the importance of considering cell inconsistency and its spatial location within the pack when designing thermal management systems for lithium-ion battery modules, as it can critically influence temperature uniformity and hotspot risks.
Conclusion
This work presents the development and application of a computationally efficient explicit electrochemical-thermal coupling model for lithium-ion batteries. Implemented within the OpenFOAM framework, the model innovatively couples a one-dimensional electrochemical sub-model with a three-dimensional thermal sub-model using an explicit numerical scheme, with the coupling executed at every grid of the thermal domain. This refined lumped approach enables the simulation of large-scale systems while capturing local temperature-dependent electrochemical effects, a limitation of conventional averaged lumped models.
The model demonstrates good accuracy in predicting the voltage and surface temperature evolution of a lithium-ion battery across a wide range of charge and discharge rates (1C to 5C). Its explicit formulation provides a significant computational advantage, making it suitable for integration into large-scale battery pack or system-level thermal management simulations as a robust heat source model.
Leveraging the model’s capabilities, an in-depth analysis was conducted. The study revealed the shifting dominance of heat sources: ohmic heat becomes the primary contributor at high C-rates, providing critical guidance for thermal management design. The internal resistance analysis confirmed the model’s ability to capture correct physicochemical trends. Furthermore, the module-scale simulation highlighted the significant impact of cell inconsistency on thermal uniformity. The severity of the maximum temperature difference depends on the spatial location of the inconsistent cell, with outermost cells causing the largest thermal gradients. These findings emphasize the need for advanced thermal management strategies that account for both spatial configuration and state heterogeneity within lithium-ion battery packs to ensure safety, performance, and longevity.