
Solar panels are among the most promising renewable-energy technologies because solar irradiation is abundant, widely distributed, and environmentally clean. However, the conversion efficiency of commercial crystalline-silicon solar panels is still limited, typically between 15% and 18%. A large portion of the incident solar energy is converted into heat, causing the operating temperature of solar panels to become significantly higher than the ambient temperature. This temperature rise is harmful because the electrical output of solar panels decreases as the cell temperature increases. It is generally accepted that the efficiency of crystalline-silicon solar panels drops by approximately 0.4% to 0.65% for every 1°C rise above the standard test condition of 25°C. This temperature-related loss is often the largest among all practical losses, including shading losses and dust accumulation losses.
In my work, I focused on the passive cooling of solar panels using phase change materials. The proposed system is often called a PV-PCM system. The phase change material is attached to the rear surface of solar panels. When solar panels absorb solar radiation and become hot, the phase change material melts and absorbs a large amount of latent heat. This process suppresses the temperature rise of solar panels and keeps their operating temperature closer to the phase-change temperature. A PV-PCM cooling system has several advantages over active cooling systems: it has no moving parts, consumes no electricity, requires almost no maintenance, and does not produce noise. These characteristics make phase change materials particularly attractive for improving the performance of solar panels in real-world conditions.
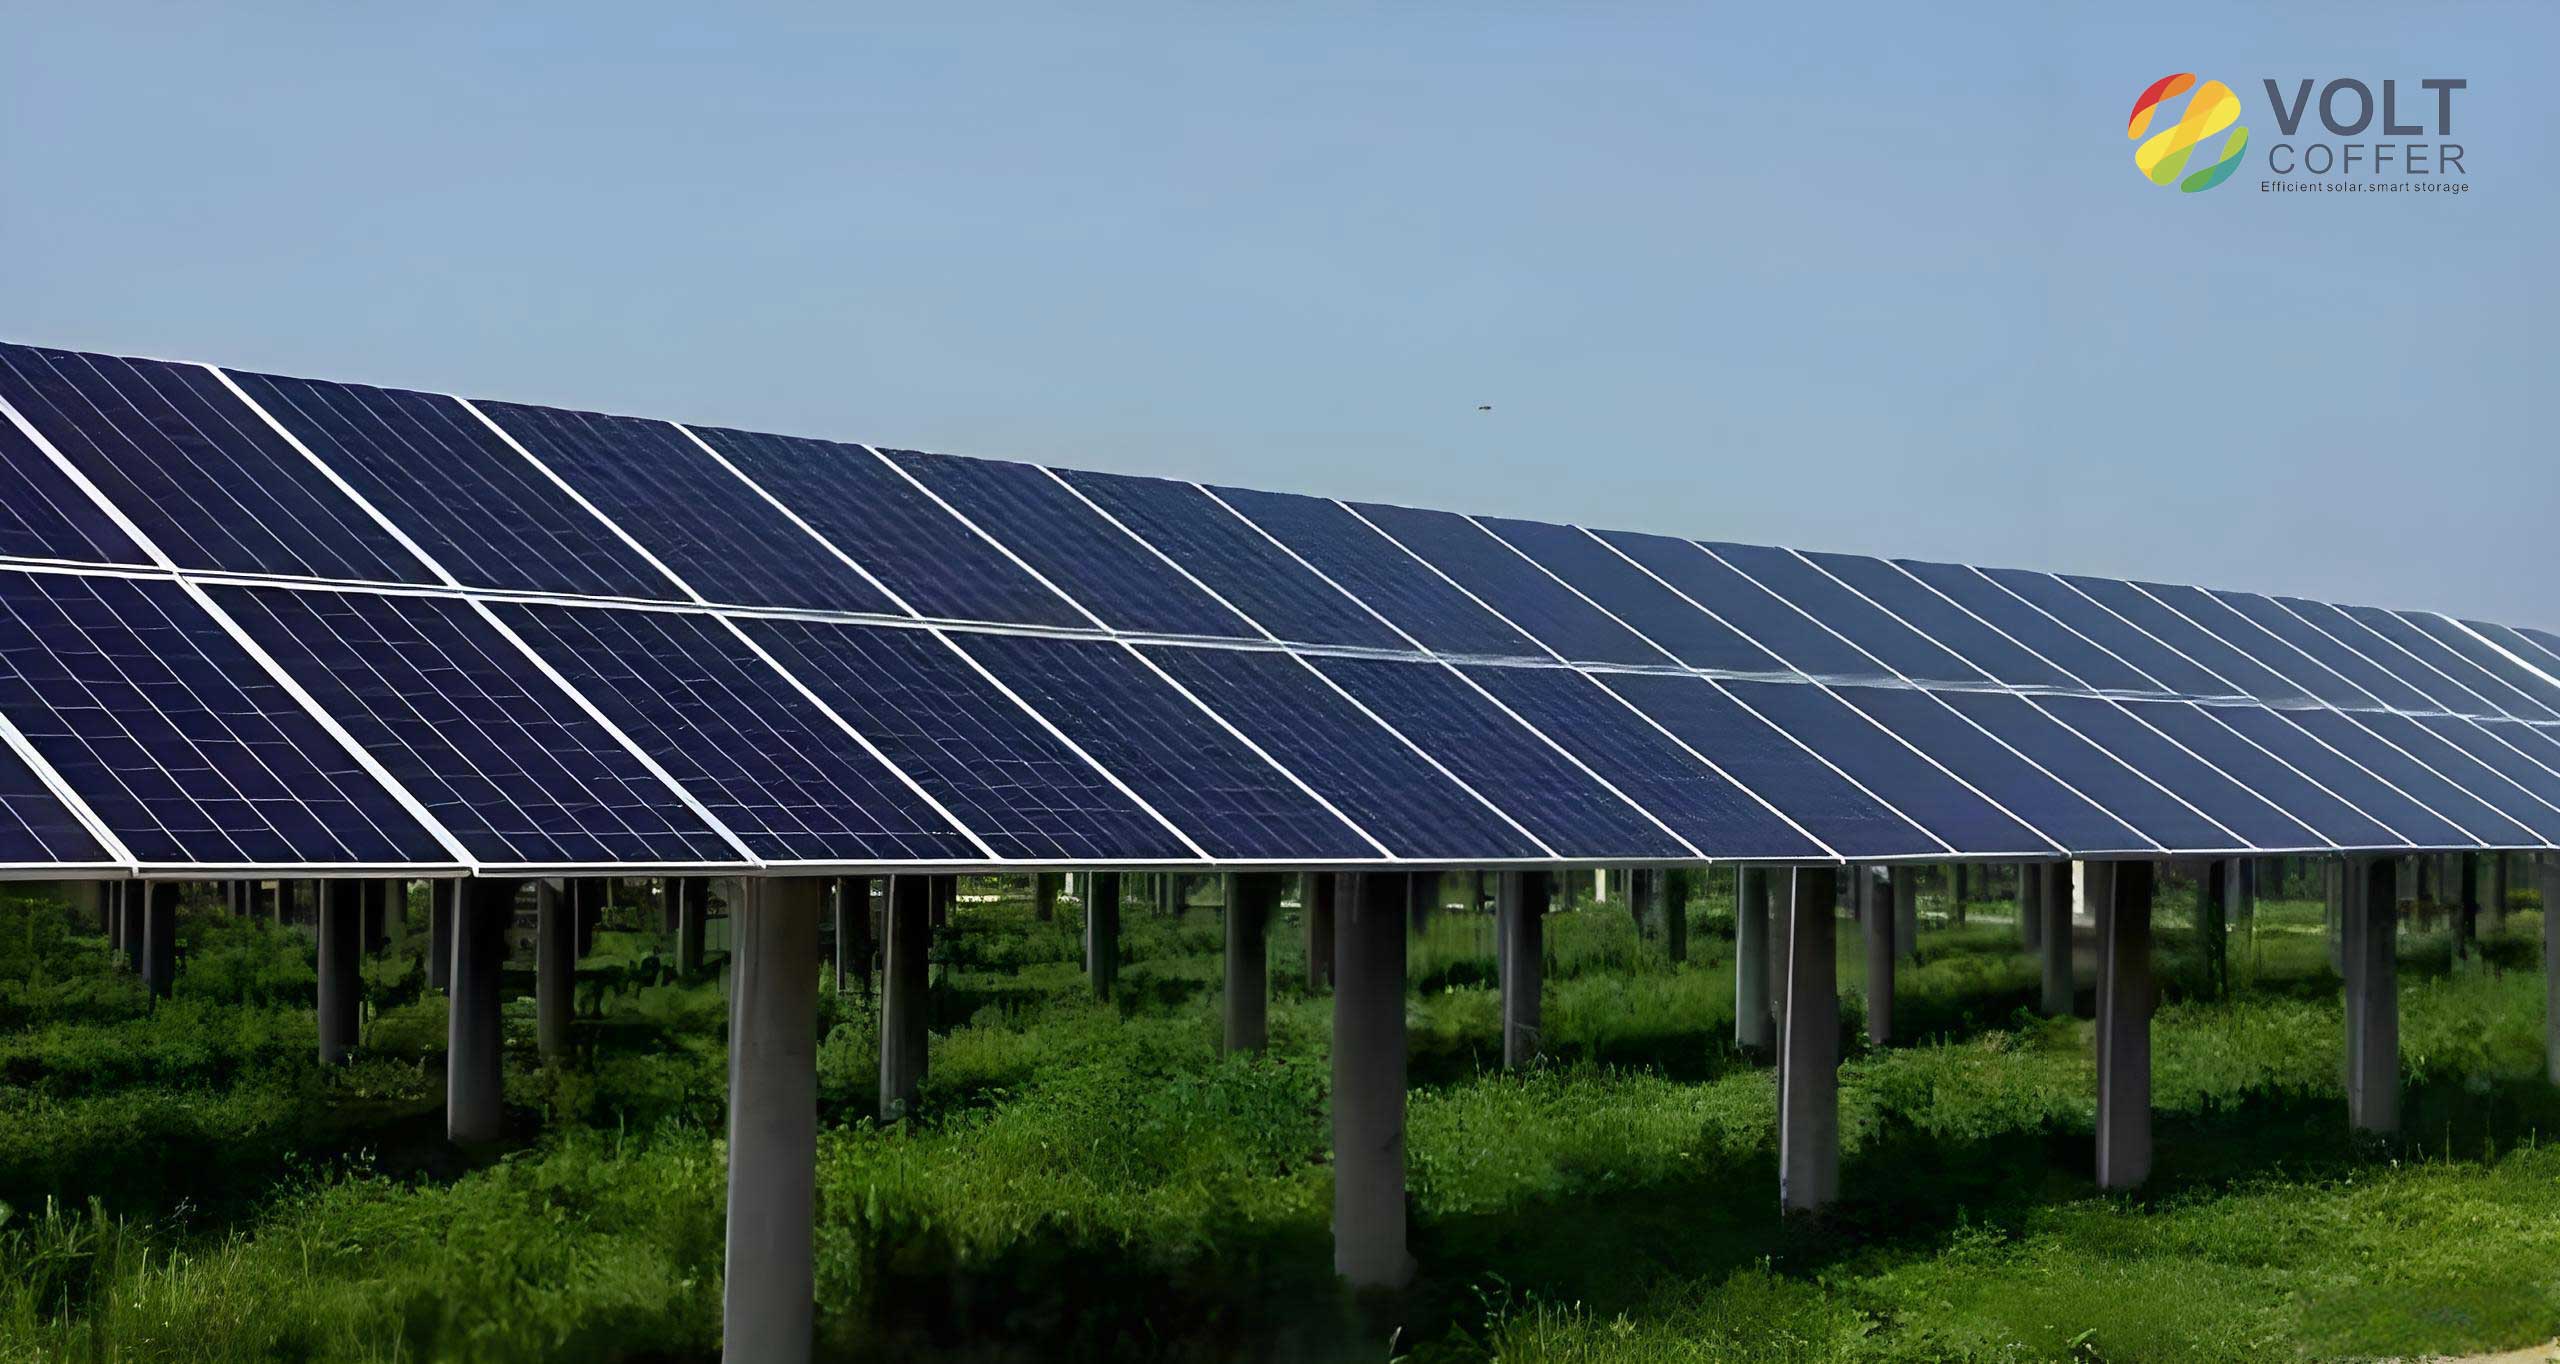
In this study, I combined experiments and numerical simulations to investigate the cooling performance of solar panels integrated with a phase change material. I measured the temperature and electrical output of solar panels with and without the PCM layer under different irradiation intensities and ambient temperatures. I also examined the reverse solidification process of the phase change material after the light source was turned off, which affects the cooling behaviour of solar panels during the night. Finally, I used actual weather data from Jilin City to simulate the annual maximum irradiation day and evaluated the practical cooling benefit for solar panels.
Experimental Arrangement and Materials
I built an experimental platform that consisted of a solar simulator, two identical solar panels, a phase change material container, a temperature acquisition system, and a solar-cell analyser. The solar simulator was a matrix of xenon lamps designed to provide a spectrum close to that of sunlight. The simulator had an effective illuminated area of 2 m by 2 m, with non-uniformity and instability lower than 5%. The irradiance intensity was adjustable, and the photovoltaic panel support was inclined at 36° to match the local installation geometry.
Two identical solar panels with a maximum output power of 12 W were used. One panel was kept as a reference PV panel, and the other was integrated with a 30 mm thick phase change material layer on its rear side. The phase change material was a commercial paraffin with a melting temperature range of 37.5–42.5°C and a latent heat of 170 kJ/kg. This material was chosen because of its suitable melting temperature, high latent heat, chemical stability, low corrosiveness, and moderate cost. The properties of the phase change material are listed in Table 1.
| Parameter | Value |
|---|---|
| Maximum power of solar panels | 12 W |
| Open-circuit voltage of solar panels | 19.2 V |
| Short-circuit current of solar panels | 0.825 A |
| Panel dimensions | 350 mm × 235 mm |
| Phase change material | Paraffin |
| Melting temperature range | 37.5–42.5°C |
| Latent heat | 170 kJ/kg |
| PCM thickness | 30 mm |
| Temperature sensor accuracy | ±0.1°C |
| Solar analyser uncertainty | ±1% |
Thermal and Electrical Principles
The thermal behaviour of solar panels is closely related to their electrical performance. If solar panels are assumed to be in a quasi-steady state, the cell temperature can be estimated from the nominal operating cell temperature, written as:
$$T = T_{amb} + \left(NOCT – 20\right)\frac{G}{800}$$
where \(T_{amb}\) is the ambient temperature in degrees Celsius, \(NOCT\) is the nominal operating cell temperature at 800 W/m2, and \(G\) is the solar irradiation intensity in W/m2. In reality, solar panels are not in perfect thermal equilibrium, but this expression provides a useful starting point for understanding the influence of irradiation and ambient temperature.
The electrical output of solar panels can be described using the single-diode equivalent circuit. The current generated by a solar cell under illumination is:
$$I = I_{ph} – I_D = I_{ph} – I_0 \left[ \exp\left(\frac{qV}{nKT}\right) – 1 \right]$$
where \(I_{ph}\) is the photogenerated current, \(I_0\) is the reverse saturation current, \(q\) is the electron charge, \(V\) is the terminal voltage, \(n\) is the diode ideality factor, \(K\) is Boltzmann’s constant, and \(T\) is the absolute temperature. If parasitic resistances are included, the expression becomes:
$$I = I_{ph} – I_0 \left[ \exp\left(\frac{q(V + I R_s)}{nKT}\right) – 1 \right] – \frac{V + I R_s}{R_{sh}}$$
The open-circuit voltage \(V_{oc}\) is obtained when the current is zero. The short-circuit current \(I_{sc}\) is obtained when the voltage is zero, and in most cases \(I_{sc} \approx I_{ph}\). The maximum output power of solar panels is related to the open-circuit voltage, short-circuit current, and fill factor \(FF\):
$$P_{max} = V_{max} I_{max} = FF \, V_{oc} I_{sc}$$
As the temperature of solar panels increases, the open-circuit voltage decreases, the fill factor decreases, and the short-circuit current increases slightly. The net effect is a reduction in maximum power. Therefore, reducing the operating temperature is an effective way to improve the electrical performance of solar panels.
Experimental Cases and Procedure
I performed experiments in an indoor environment using the solar simulator. Before each test, I placed an irradiance meter on the support frame and adjusted the simulator output to the target irradiance. The experiments were carried out under five different conditions, as listed in Table 2. Two parameters were varied: solar irradiation intensity and ambient temperature. The wind speed was zero in all indoor experiments.
| Case | Irradiance (W/m2) | Ambient temperature (°C) | Purpose |
|---|---|---|---|
| 1 | 600 | 20.7 | Effect of irradiation |
| 2 | 800 | 20.7 | Effect of irradiation |
| 3 | 1000 | 20.7 | Effect of irradiation |
| 4 | 1000 | 7.3 | Effect of ambient temperature |
| 5 | 1000 | 14.1 | Effect of ambient temperature |
I attached K-type thermocouples to the upper and lower centre points of both solar panels. The temperature data were recorded every 20 minutes. The solar-cell analyser measured the open-circuit voltage, short-circuit current, maximum power, maximum voltage, maximum current, fill factor, and I-V characteristics. The light source was kept on for 300 minutes, and then turned off to observe the natural cooling behaviour. The PV-PCM system was monitored for another 480 minutes after the light source was switched off, because the phase change material releases stored latent heat during solidification and therefore takes much longer to cool down than the plain PV panel.
I used the maximum-power-based efficiency to evaluate the electrical performance of solar panels:
$$EFF_{max} = \frac{P_{max}}{G A}$$
where \(A\) is the active area of solar panels. I also calculated the uncertainty of the measured efficiency using the root-sum-square method. The resulting absolute uncertainty was 1.4%, which is acceptable for this study.
Cooling Effect of the Phase Change Material
The temperature comparison between the reference PV panel and the PV-PCM system showed that the phase change material was able to absorb a significant amount of heat from solar panels and delay the temperature rise. In all five cases, the PV-PCM system had a much lower surface temperature than the plain PV panel. A summary of the average temperature reductions is presented in Table 3.
| Case | Upper-surface temperature reduction (°C) | Lower-surface temperature reduction (°C) |
|---|---|---|
| 1: 600 W/m2, 20.7°C | 19.61 | 20.71 |
| 2: 800 W/m2, 20.7°C | 22.39 | 24.16 |
| 3: 1000 W/m2, 20.7°C | 26.77 | 28.15 |
| 4: 1000 W/m2, 7.3°C | 33.94 | 36.51 |
| 5: 1000 W/m2, 14.1°C | 30.34 | 32.46 |
For example, when the irradiation intensity was 1000 W/m2 and the ambient temperature was 20.7°C, the plain PV panel reached about 118°C after the initial rapid heating stage, whereas the PV-PCM system reached a much lower quasi-steady temperature. The average upper-surface temperature of the plain solar panel was 111.44°C, while the average upper-surface temperature of the PV-PCM system was 84.67°C. The phase change material produced a 26.77°C reduction in average temperature. The lower-surface temperature was reduced by 28.15°C.
The largest temperature reduction occurred in the case with 1000 W/m2 irradiation and 7.3°C ambient temperature. In that case, the average upper-surface temperature was reduced by 33.94°C, and the average lower-surface temperature was reduced by 36.51°C. The large temperature difference between the panel and the ambient air allowed the phase change material to reject heat more effectively at night, and during the heating period the PCM could store more heat while still remaining below the panel temperature of the reference case.
Another important observation was the cooling time after the light source was turned off. The plain PV panel cooled to room temperature in about 80 minutes. The PV-PCM system required about 480 minutes to cool to room temperature. This behaviour was caused by the reverse solidification process. When the temperature of solar panels falls below the melting point of the phase change material, the material begins to release its latent heat. This heat release slows down the cooling of solar panels. The extended cooling period reduces thermal stress on the solar panels because the temperature changes more gradually.
Electrical Performance Improvement
I also investigated the electrical output of solar panels with and without the phase change material. The measured results show that the phase change material reduced the rate at which the open-circuit voltage decreased with temperature. In all cases, the PV-PCM system had a higher average open-circuit voltage than the reference PV panel. The improvement in open-circuit voltage ranged from 1.08 V to 1.96 V, as shown in Table 4.
| Case | \(V_{oc}\) improvement (V) | \(I_{sc}\) reduction (mA) | Fill factor improvement |
|---|---|---|---|
| 600 W/m2, 20.7°C | 1.08 | 2.25 | 0.02 |
| 800 W/m2, 20.7°C | 1.28 | 2.31 | 0.03 |
| 1000 W/m2, 20.7°C | 1.47 | 3.38 | 0.04 |
| 1000 W/m2, 7.3°C | 1.96 | 13.08 | 0.05 |
| 1000 W/m2, 14.1°C | 1.53 | 8.31 | 0.04 |
The short-circuit current of solar panels increased slightly with temperature. Because the phase change material reduced the panel temperature, the short-circuit current of the PV-PCM system was slightly lower than that of the reference PV panel. This reduction was small in comparison with the benefit gained from the higher open-circuit voltage. In the case with the largest temperature reduction, the short-circuit current reduction was 13.08 mA. In the other cases, the short-circuit current difference was less than 10 mA. Therefore, the phase change material had a positive net effect on the power output of solar panels.
The fill factor of solar panels also improved when the phase change material was used. The improvement ranged from 0.02 to 0.05. This improvement occurred because the lower operating temperature reduced the internal resistive losses and non-radiative recombination in the solar cells. As a result, the fill factor of the PV-PCM system was consistently higher than that of the plain PV panel.
The maximum output power improvement is the most important metric for practical applications. For the 12 W solar panels used in my experiments, the phase change material increased the average maximum output power by 0.55 W to 1.35 W and increased the average maximum efficiency by 1.11% to 1.63%, as shown in Table 5.
| Case | \(P_{max}\) improvement (W) | \(EFF_{max}\) improvement (%) |
|---|---|---|
| 600 W/m2, 20.7°C | 0.55 | 1.11 |
| 800 W/m2, 20.7°C | 0.86 | 1.30 |
| 1000 W/m2, 20.7°C | 1.28 | 1.55 |
| 1000 W/m2, 7.3°C | 1.35 | 1.63 |
| 1000 W/m2, 14.1°C | 1.32 | 1.59 |
The highest improvement in maximum power and maximum efficiency was observed in the case with an ambient temperature of 7.3°C and an irradiance of 1000 W/m2. This result indicates that the phase change material is more effective when the ambient temperature is low, because the temperature difference between solar panels and the phase change material is larger, and the heat rejection to the environment is more efficient.
Influence of Irradiation Intensity
The first environmental parameter I investigated was the solar irradiation intensity. I kept the ambient temperature at 20.7°C and changed the irradiation intensity from 600 to 800 to 1000 W/m2. I found that the cooling effect of the phase change material increased as the irradiation intensity increased. The temperature reductions are shown in Table 6.
| Irradiance (W/m2) | Upper-surface temperature reduction (°C) | Lower-surface temperature reduction (°C) |
|---|---|---|
| 600 | 19.61 | 20.71 |
| 800 | 22.39 | 24.16 |
| 1000 | 26.77 | 28.15 |
This trend can be explained by the fact that higher irradiation intensity produces a higher heat flux on solar panels. The phase change material is able to absorb a larger amount of heat because the temperature difference between solar panels and the PCM layer is larger. As the irradiation intensity increases, the plain PV panel becomes hotter, while the PCM layer delays the temperature rise and maintains a lower panel temperature. Thus, the temperature difference between the two systems becomes larger at higher irradiation levels.
The electrical performance of solar panels also followed a similar trend. As the irradiation intensity increased from 600 to 1000 W/m2, the open-circuit voltage improvement increased from 1.08 V to 1.47 V. The fill factor improvement increased from 0.02 to 0.04. The maximum output power improvement increased from 0.55 W to 1.28 W, and the maximum efficiency improvement increased from 1.11% to 1.55%.
These results show that the PV-PCM system is particularly suitable for solar panels operating under strong sunlight. In high-irradiation regions, the cooling benefit of the phase change material becomes more significant, and the additional power output can be considerable.
Influence of Ambient Temperature
The second environmental parameter I investigated was the ambient temperature. I kept the irradiation intensity at 1000 W/m2 and compared cases with ambient temperatures of 7.3°C, 14.1°C, and 20.7°C. I found that the cooling effect of the phase change material decreased as the ambient temperature increased. Table 7 summarizes the results.
| Ambient temperature (°C) | Upper-surface temperature reduction (°C) | Lower-surface temperature reduction (°C) |
|---|---|---|
| 7.3 | 33.94 | 36.51 |
| 14.1 | 30.34 | 32.46 |
| 20.7 | 26.77 | 28.15 |
At a low ambient temperature, the heat from solar panels can be transferred more easily to the phase change material and then rejected to the environment. When the ambient temperature is high, the temperature difference between the panel surface and the surrounding air is smaller, and the ability of the phase change material to dissipate heat at night is reduced. Consequently, the phase change material reaches a higher steady-state temperature and the cooling benefit becomes smaller.
The electrical results were consistent with the thermal results. The open-circuit voltage improvement was 1.96 V at 7.3°C, 1.53 V at 14.1°C, and 1.47 V at 20.7°C. The maximum output power improvement was 1.35 W at 7.3°C, 1.32 W at 14.1°C, and 1.28 W at 20.7°C. Therefore, I conclude that the PV-PCM system is more effective in cool climates than in hot climates. In hot climates, the phase change material can still reduce the peak temperature of solar panels, but the improvement in efficiency is smaller.
Numerical Simulation under Real Weather Conditions
To test the practical performance of the PV-PCM system, I developed a three-dimensional numerical model using ANSYS Fluent. The model included the multi-layer structure of solar panels: glass, EVA, silicon cell, EVA, and backsheet. The phase change material was attached to the rear side of solar panels. The physical properties of each layer are listed in Table 8.
| Layer | Thickness (mm) | Density (kg/m3) | Specific heat (J/(kg K)) | Thermal conductivity (W/(m K)) |
|---|---|---|---|---|
| Glass | 3.0 | 3000 | 500 | 1.8 |
| EVA | 0.5 | 960 | 2090 | 0.35 |
| Silicon cell | 0.225 | 2330 | 677 | 148 |
| EVA | 0.5 | 960 | 2090 | 0.35 |
| Backsheet | 0.25 | 1200 | 1250 | 0.2 |
| Phase change material | 30 | 800 | 2600 solid / 3600 liquid | 0.21 solid / 0.19 liquid |
I used the enthalpy-porosity method to model the phase change process. The energy equation for the phase change material can be written as:
$$\rho \frac{\partial H}{\partial t} = \lambda \nabla^2 T$$
where \(\rho\) is the density, \(\lambda\) is the thermal conductivity, and \(H\) is the total enthalpy. The total enthalpy is the sum of sensible enthalpy \(h\) and latent enthalpy \(\Delta H\):
$$H = h + \Delta H$$
The liquid fraction \(\beta\) is defined as:
$$\beta = \left\{ \begin{array}{ll} 0 & T < T_s \\ \frac{T – T_s}{T_l – T_s} & T_s \le T \le T_l \\ 1 & T > T_l \end{array} \right.$$
In the liquid phase, natural convection inside the phase change material was modelled using the Boussinesq approximation. The continuity and momentum equations are:
$$\nabla \cdot \mathbf{v} = 0$$
$$\rho \frac{\partial \mathbf{v}}{\partial t} + \rho \left( \mathbf{v} \cdot \nabla \right) \mathbf{v} = -\nabla p + \mu \nabla^2 \mathbf{v} + \mathbf{S}$$
The source term includes the buoyancy force caused by density differences. The heat exchange between solar panels and the environment includes both convection and radiation. The convective heat transfer coefficient depends on wind speed \(u\):
$$h = 5.70 + 3.80 u$$
The sky temperature was estimated from the ambient temperature using:
$$T_{sky} = 0.0552 \, T_{amb}^{1.5}$$
I first validated the model by comparing its predictions with my indoor experimental data. The maximum error between the simulated and measured temperatures was about 10.95% for the PV-PCM system, and the average error was about 6%. This level of agreement was acceptable. I also performed a grid independence test to ensure that the numerical results were not affected by the mesh density.
After validation, I applied the model to simulate the cooling performance of solar panels under actual weather conditions in Jilin City. I selected June 2, 2020, which was the day with the highest solar irradiation in that year. The maximum irradiance reached about 992 W/m2 at 11:00. The average irradiance during sunlight hours was about 528 W/m2. The ambient temperature ranged from about 11.7°C to 23.8°C. The average soil temperature was approximately 9.0°C, and the sky temperature varied with the ambient temperature.
The simulation results showed that the PV-PCM system maintained solar panels at a lower temperature for most of the day. The plain PV panel reached a peak surface temperature of about 51.4°C, while the PV-PCM system reached only about 40°C during the noon period. The maximum temperature difference between the two systems was 10.56°C, which occurred at 11:00 in the morning. During the daytime, the cooling effect of the phase change material increased as the irradiation intensity increased. The phase change material kept the surface temperature of solar panels below 40°C for the entire day in this simulation.
I also estimated the electrical benefit from the simulated temperature difference. If the temperature coefficient of solar panels is taken as 0.4% per °C, then a temperature reduction of 10.56°C corresponds to an efficiency improvement of about 4.2%. Using the more detailed temperature coefficient of 0.45% per °C, the efficiency improvement is about 4.75%. The corresponding power output improvement was 3.76 W for the 12 W solar panel at the peak solar noon. The daily net output improvement from the phase change material was estimated to be about 12.50 W for one 12 W module, which is an important gain for a single day.
It is also interesting to note that in the late afternoon, after the phase change material began to solidify, the PV-PCM system became slightly warmer than the plain PV panel for a short period. This happened because the solidifying phase change material released its latent heat. This reverse process is actually beneficial for solar panels because it slows down the evening temperature drop and reduces thermal cycling stresses. However, the negative effect on power output is small because the irradiation intensity is low at that time of day.
Concluding Remarks
In this study, I investigated the cooling performance of solar panels integrated with a phase change material. The main findings are as follows.
First, phase change materials effectively reduce the operating temperature of solar panels. In the five experimental conditions, the average upper-surface temperature reduction ranged from 19.61°C to 33.94°C, while the lower-surface temperature reduction ranged from 20.71°C to 36.51°C. The phase change material also delayed the temperature rise and prolonged the cooling process after sunset. The PV-PCM system required about 480 minutes to cool to room temperature, whereas the plain PV panel required only about 80 minutes.
Second, the phase change material improved the electrical performance of solar panels. The average maximum output power was increased by 0.55 W to 1.35 W, and the average maximum efficiency was increased by 1.11% to 1.63%. The open-circuit voltage improvement ranged from 1.08 V to 1.96 V, and the fill factor improvement ranged from 0.02 to 0.05.
Third, the environmental conditions strongly influence the cooling performance of the PV-PCM system. The cooling effect improved with increasing irradiation intensity, because more heat is available for the phase change material to absorb. The cooling effect worsened with increasing ambient temperature. Therefore, the PV-PCM system is more suitable for solar panels installed in high-irradiation and low-to-moderate temperature climates.
Finally, the numerical simulation based on real weather data confirmed that phase change materials can keep solar panels below 40°C on the maximum irradiation day in Jilin City. The maximum temperature difference between the PV-PCM system and the plain PV panel was 10.56°C, which translates into an efficiency improvement of up to 4.2%. These findings suggest that phase change materials can significantly improve the performance and reliability of solar panels in practical applications.
One limitation of my work is that I did not consider different thicknesses of the phase change material or different melting temperatures. In future work, I plan to optimize the phase change material properties and container design to further improve the cooling performance of solar panels. I also intend to study methods for increasing the thermal conductivity of the phase change material, such as adding metal foams or nanoparticles. Economic analysis will also be necessary to evaluate the cost-effectiveness of PV-PCM systems for large-scale solar panels.