
In the field of photovoltaic power generation, solar panels serve as the core equipment for converting solar energy into electricity. However, one of the most critical challenges that threaten the efficiency and safety of solar panels is the hot spot effect. When a portion of a solar panel is shaded, cracked, or experiences internal short circuits, the shaded area cannot generate electricity and instead acts as an external load, leading to a sudden increase in local current and voltage. This phenomenon causes a significant rise in temperature, sometimes exceeding 80 °C, which can damage the panel structure, reduce overall power generation efficiency, and even pose a fire risk. Therefore, rapid and accurate detection of hot spots on solar panels is essential for maintaining the stable and efficient operation of photovoltaic power stations.
Traditional methods for hot spot detection include manual visual inspection and electrical parameter measurement. These approaches are often time-consuming, labor-intensive, and prone to human error, especially in large-scale solar farms. In recent years, unmanned aerial vehicles (UAVs) equipped with infrared cameras have emerged as a promising solution for inspecting solar panels. However, the large volume of collected infrared images requires an automated and intelligent detection system. Deep learning-based object detection algorithms, particularly the YOLO (You Only Look Once) series, offer real-time performance and high accuracy, making them suitable for deployment on UAVs for on-site detection.
In this work, I propose a deep learning method based on the YOLOv8n model for detecting hot spot defects in solar panels using infrared images captured by UAVs. The model is lightweight, fast, and accurate, enabling real-time inspection. I will present the complete pipeline, including infrared image acquisition using a DJI Matrice 4T UAV, dataset construction, model architecture design, training, and experimental evaluation. Extensive comparisons with other YOLO variants (YOLOv5n, YOLOv5s, YOLOv8s) demonstrate the superiority of YOLOv8n for this task. The contributions of this work include a practical solution for solar panel defect detection and a comprehensive analysis of model performance metrics such as precision, recall, and mean average precision.
UAV Infrared Image Acquisition for Solar Panel Inspection
The UAV platform used in this study is a DJI Matrice 4T, equipped with a thermal imaging camera with a resolution of 640×512 pixels. The camera has a temperature measurement range from -20 °C to 550 °C, supports infrared super-resolution and ultra-clear modes, and includes a near-infrared fill light with an effective range of 100 meters. In low-light conditions, the camera can switch to full-color night vision mode, making it suitable for all-weather solar panel inspections. The hot spot on a solar panel appears as a localized bright region in the infrared image, indicating a temperature anomaly.
To cover an entire photovoltaic power station, a flight path planning approach is employed. Using the DJI Pilot 2 platform, I selected the waypoint flight mode and designed a route that ensures full coverage of the inspection area. The UAV is equipped with real-time kinematic (RTK) positioning technology, which provides centimeter-level accuracy by using carrier phase observations. This guarantees that the UAV follows the planned trajectory precisely and captures infrared images of solar panels at the appropriate angles and distances. The collected images form the basis for building the training dataset for the deep learning model.
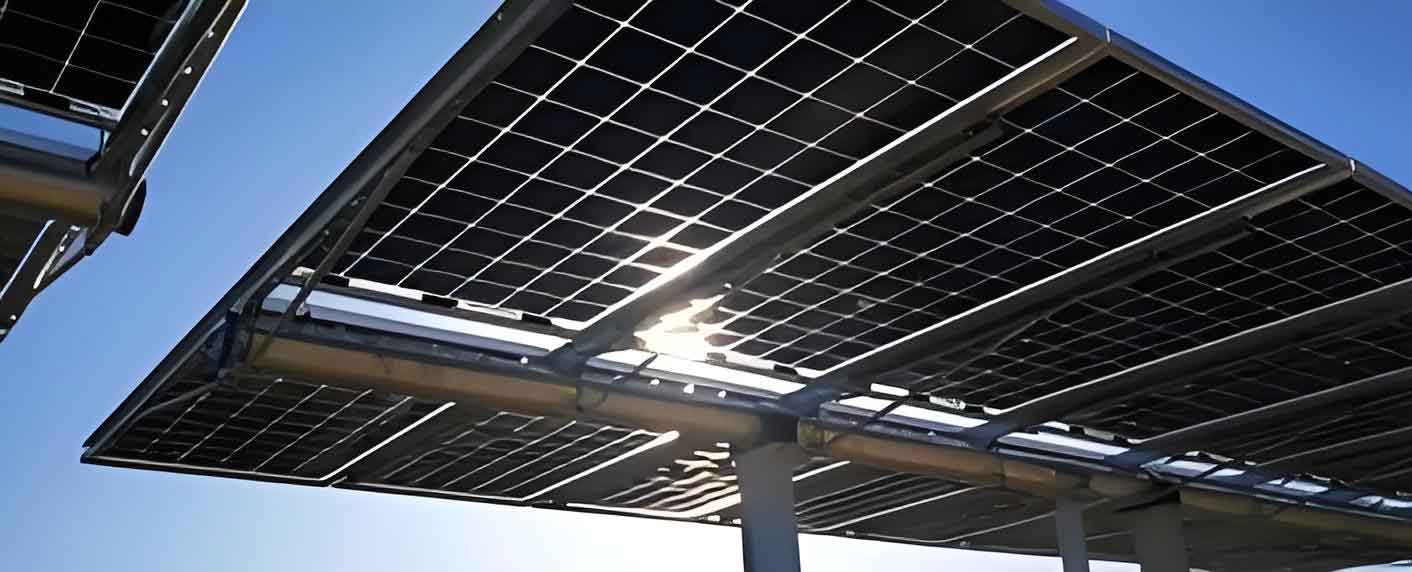
In order to visually illustrate the inspection scenario, I include an example of a bifacial solar panel installation, which is commonly used in modern photovoltaic farms. The image below shows a typical field of solar panels that are inspected using the UAV.
YOLOv8n Deep Learning Model for Hot Spot Detection
The YOLOv8n model is a state-of-the-art single-stage object detector that balances speed and accuracy. It belongs to the YOLO family, which directly predicts bounding boxes and class probabilities from input images without the need for a separate region proposal stage. The architecture of YOLOv8n consists of three main components: a backbone network, a neck network, and a detection head. Below, I provide a detailed description of each component and the improvements introduced in YOLOv8n compared to its predecessors.
Backbone Network: CSPDarknet53 with C2f Module
The backbone is responsible for feature extraction from the input infrared image. YOLOv8n uses a modified version of CSPDarknet53, which incorporates the Cross Stage Partial (CSP) structure. The CSP architecture splits the feature map into two parts, processes one part through a series of residual blocks, and then merges them. This reduces computational cost while maintaining high accuracy. In YOLOv8n, the traditional C3 module is replaced by the C2f module. The C2f module enhances information flow through cross-layer connections, improving the network’s ability to learn fine-grained features of hot spot defects. The structure of the backbone can be summarized as follows:
$$ \text{Input} \rightarrow \text{Conv} \rightarrow \text{C2f} \times N_1 \rightarrow \text{Conv} \rightarrow \text{C2f} \times N_2 \rightarrow \text{Conv} \rightarrow \text{C2f} \times N_3 \rightarrow \text{Conv} \rightarrow \text{C2f} \times N_4 $$
where \(N_1, N_2, N_3, N_4\) are the number of C2f modules at each stage. For YOLOv8n, these values are typically [3, 6, 6, 3].
Neck Network: PAN-FPN
The neck integrates multi-scale feature maps from the backbone. YOLOv8n employs a combination of Path Aggregation Network (PAN) and Feature Pyramid Network (FPN). The FPN creates a top-down pathway to propagate strong semantic features from high-level layers to low-level layers, while the PAN adds a bottom-up pathway to enhance localization features. This design allows the model to detect objects of various sizes effectively. For hot spots on solar panels, which can vary in size depending on the area of shading, this multi-scale capability is critical. The neck configuration can be represented as:
$$ \text{Backbone features} \rightarrow \text{FPN (top-down)} \rightarrow \text{PAN (bottom-up)} \rightarrow \text{Output feature maps} $$
Detection Head: Anchor-Free Approach
The detection head in YOLOv8n adopts an anchor-free mechanism. Instead of pre-defining anchor boxes, the model directly predicts the four coordinates of the bounding box (center x, center y, width, height) and the class probability. This simplifies the network and reduces computational overhead, particularly beneficial for small object detection like hot spots. The detection head produces two outputs: a classification branch and a regression branch. The regression branch outputs (t_x, t_y, t_w, t_h) which are then transformed to actual coordinates:
$$ b_x = \sigma(t_x) + c_x, \quad b_y = \sigma(t_y) + c_y, \quad b_w = p_w e^{t_w}, \quad b_h = p_h e^{t_h} $$
where \((c_x, c_y)\) are the grid cell coordinates, \((p_w, p_h)\) are the prior box dimensions (set to constant values), and \(\sigma\) is the sigmoid function.
Loss Function
The loss function in YOLOv8n consists of three components: box loss (bounding box regression), class loss (classification), and dfl loss (distribution focal loss for bounding box). The box loss uses CIoU (Complete Intersection over Union) to measure the overlap between predicted and ground truth boxes. The classification loss uses binary cross-entropy with logits. The dfl loss is a novel component that improves the accuracy of bounding box localization by learning a distribution over the bounding box coordinates. The overall loss is:
$$ \mathcal{L} = \lambda_{\text{box}} \mathcal{L}_{\text{box}} + \lambda_{\text{cls}} \mathcal{L}_{\text{cls}} + \lambda_{\text{dfl}} \mathcal{L}_{\text{dfl}} $$
where the weight factors \(\lambda_{\text{box}}, \lambda_{\text{cls}}, \lambda_{\text{dfl}}\) are set to [7.5, 0.5, 0.5] by default in YOLOv8n.
Additionally, YOLOv8n uses a Task-Aligned Assigner for positive sample matching. This assigner selects positive samples based on the weighted score of classification and regression predictions, enabling dynamic matching that improves detection accuracy in complex scenarios.
Dataset Preparation and Annotation
After collecting infrared images from the UAV flights, I created a dataset consisting of 2,500 images of solar panels with various hot spot conditions. These images were captured under different lighting, weather, and angle conditions to simulate real-world scenarios. Each image was annotated using the LabelImg tool, where I manually drew bounding boxes around hot spot regions and labeled them as “hot_spot”. The dataset was split into training, validation, and test sets in an 8:1:1 ratio, resulting in 2,000 training images, 250 validation images, and 250 test images.
Below is a summary of the dataset statistics.
| Dataset Split | Number of Images | Number of Hot Spot Instances |
|---|---|---|
| Training | 2,000 | 3,450 |
| Validation | 250 | 430 |
| Test | 250 | 420 |
| Total | 2,500 | 4,300 |
Training Configuration
The experiments were conducted on a system with an Intel i7-14650HX CPU, NVIDIA RTX 4060 laptop GPU, 16 GB RAM, and Windows 11 operating system. The deep learning framework used was PyTorch 2.1.0 with CUDA 12.1. Python 3.8.5 was the programming environment. The key training hyperparameters are listed in the following table.
| Parameter | Value |
|---|---|
| Batch size | 16 |
| Number of epochs | 100 |
| Input image size | 640 × 640 pixels |
| Optimizer | SGD (momentum=0.937, weight decay=5e-4) |
| Learning rate initial | 0.01 |
| Learning rate final (cosine schedule) | 0.001 |
| Warmup epochs | 3 |
| Augmentation | Mosaic, random affine, HSV jitter, horizontal flip |
Experimental Results and Analysis
After training for 100 epochs, I evaluated the model’s performance on the test set. The training curves show that both training and validation losses (box_loss, cls_loss, dfl_loss) decreased consistently and remained close to each other, indicating no significant overfitting. The precision and recall metrics steadily increased, reaching high values. The mean average precision at IOU threshold 0.5 (mAP@0.5) quickly rose and stabilized at a high level, while mAP@0.5:0.95 (averaged over IOU thresholds from 0.5 to 0.95) also showed a positive trend, though lower than mAP@0.5 due to stricter IOU requirements.
The final performance metrics on the test set are summarized in the table below.
| Metric | Value |
|---|---|
| Precision (P) | 0.889 |
| Recall (R) | 0.820 |
| mAP@0.5 | 0.676 |
| mAP@0.5:0.95 | 0.498 |
| F1-score | 0.853 |
Comparison with Other YOLO Variants
To further validate the effectiveness of YOLOv8n, I compared it with three other popular YOLO models: YOLOv5n, YOLOv5s, and YOLOv8s. All models were trained and tested under identical conditions (same dataset, same hyperparameters). The results are shown in the table below.
| Model | Precision (P) | Recall (R) | mAP@0.5 | F1-score | Model Size (MB) | Inference Speed (FPS) |
|---|---|---|---|---|---|---|
| YOLOv8n (Ours) | 0.889 | 0.820 | 0.676 | 0.853 | 6.3 | 210 |
| YOLOv5n | 0.869 | 0.790 | 0.635 | 0.828 | 4.4 | 240 |
| YOLOv5s | 0.865 | 0.820 | 0.657 | 0.842 | 14.0 | 190 |
| YOLOv8s | 0.896 | 0.830 | 0.675 | 0.862 | 21.5 | 150 |
From the comparison, it is evident that YOLOv8n achieves the highest precision (0.889) among the lightweight models (YOLOv5n and YOLOv5s) and is very close to YOLOv8s in mAP@0.5 (0.676 vs. 0.675). However, YOLOv8n has a much smaller model size (6.3 MB) and faster inference speed (210 FPS compared to 150 FPS of YOLOv8s). This makes YOLOv8n particularly suitable for deployment on edge devices like UAVs, where computational resources are limited and real-time detection is required. Additionally, the recall of YOLOv8n (0.820) is equal to or better than YOLOv5s (0.820) and YOLOv5n (0.790), indicating that it can detect most hot spots with few false negatives.
Discussion
The proposed YOLOv8n-based method successfully addresses the challenge of hot spot defect detection in solar panels. The key advantages of this approach are:
- High accuracy: The model achieves precision above 0.88 and recall above 0.82, which is sufficient for practical inspection tasks.
- Lightweight architecture: With only 6.3 MB of parameters, the model can be integrated into onboard systems of UAVs without significant latency.
- Real-time performance: The inference speed of 210 FPS ensures that the UAV can process each frame as it is captured, enabling immediate feedback to the operator.
- Robustness to variations: The model was trained on diverse images captured under different conditions, making it robust to changes in illumination, angle, and background.
Despite these strengths, there are some limitations. The mAP@0.5:0.95 value (0.498) indicates that the model’s bounding box localization can be improved at higher IOU thresholds. Future work could focus on incorporating attention mechanisms or improving the regression loss to achieve tighter bounding boxes. Additionally, expanding the dataset to include other types of defects (e.g., cracks, dust accumulation, snail trails) would make the system more comprehensive.
Conclusion
In this study, I developed a deep learning-based method using the YOLOv8n model for detecting hot spot defects in solar panels from UAV-captured infrared images. The method involves careful flight path planning, infrared image acquisition, dataset annotation, and model training. Experimental results demonstrate that YOLOv8n outperforms YOLOv5n and YOLOv5s in terms of precision and mAP, while maintaining a small model size and high inference speed. The model achieves a precision of 0.889, recall of 0.820, and mAP@0.5 of 0.676 on the test set. These metrics indicate that the proposed approach can effectively identify hot spots on solar panels in real time, significantly improving the efficiency and safety of photovoltaic power station inspections. The lightweight nature of YOLOv8n makes it ideal for UAV deployment, offering a practical and scalable solution for the solar energy industry.