
In the context of modern power systems, the accurate modeling of photovoltaic generation systems is critical for stability studies, planning, and operation. The solar inverter, as the core interface between the photovoltaic array and the grid, employs a dual-loop control structure consisting of an outer voltage loop and an inner current loop. The parameters of these controllers directly influence the dynamic performance of the solar inverter. However, due to the cascaded nature of the control loops, traditional parameter identification methods that rely on single-side disturbances (e.g., voltage sags or step changes in reference values) suffer from poor identifiability — multiple parameter sets can yield similar output responses, leading to non-unique identification results. To address this issue, we propose a novel excitation technique termed Virtual Measurement Excitation (VME) and develop a stepwise identification strategy for the solar inverter controller parameters.
The key idea of VME is to inject disturbance signals directly into the secondary-side measurement signals (voltage, current) that are fed into the solar inverter controller, rather than perturbing the primary-side circuit. This approach allows us to selectively excite specific control loops while shielding others, thereby decoupling the outer-loop and inner-loop dynamics. By applying different types of VME signals (e.g., square wave, sinusoidal wave) to different measured quantities, we can sequentially estimate the parameters of the voltage outer-loop PI controller, the current inner-loop PI controller, and the coupling inductance. The entire procedure can be performed without requiring any optimization algorithm if the inductance value is measurable, which significantly simplifies the identification process.
1. Solar Inverter Model and Control Structure
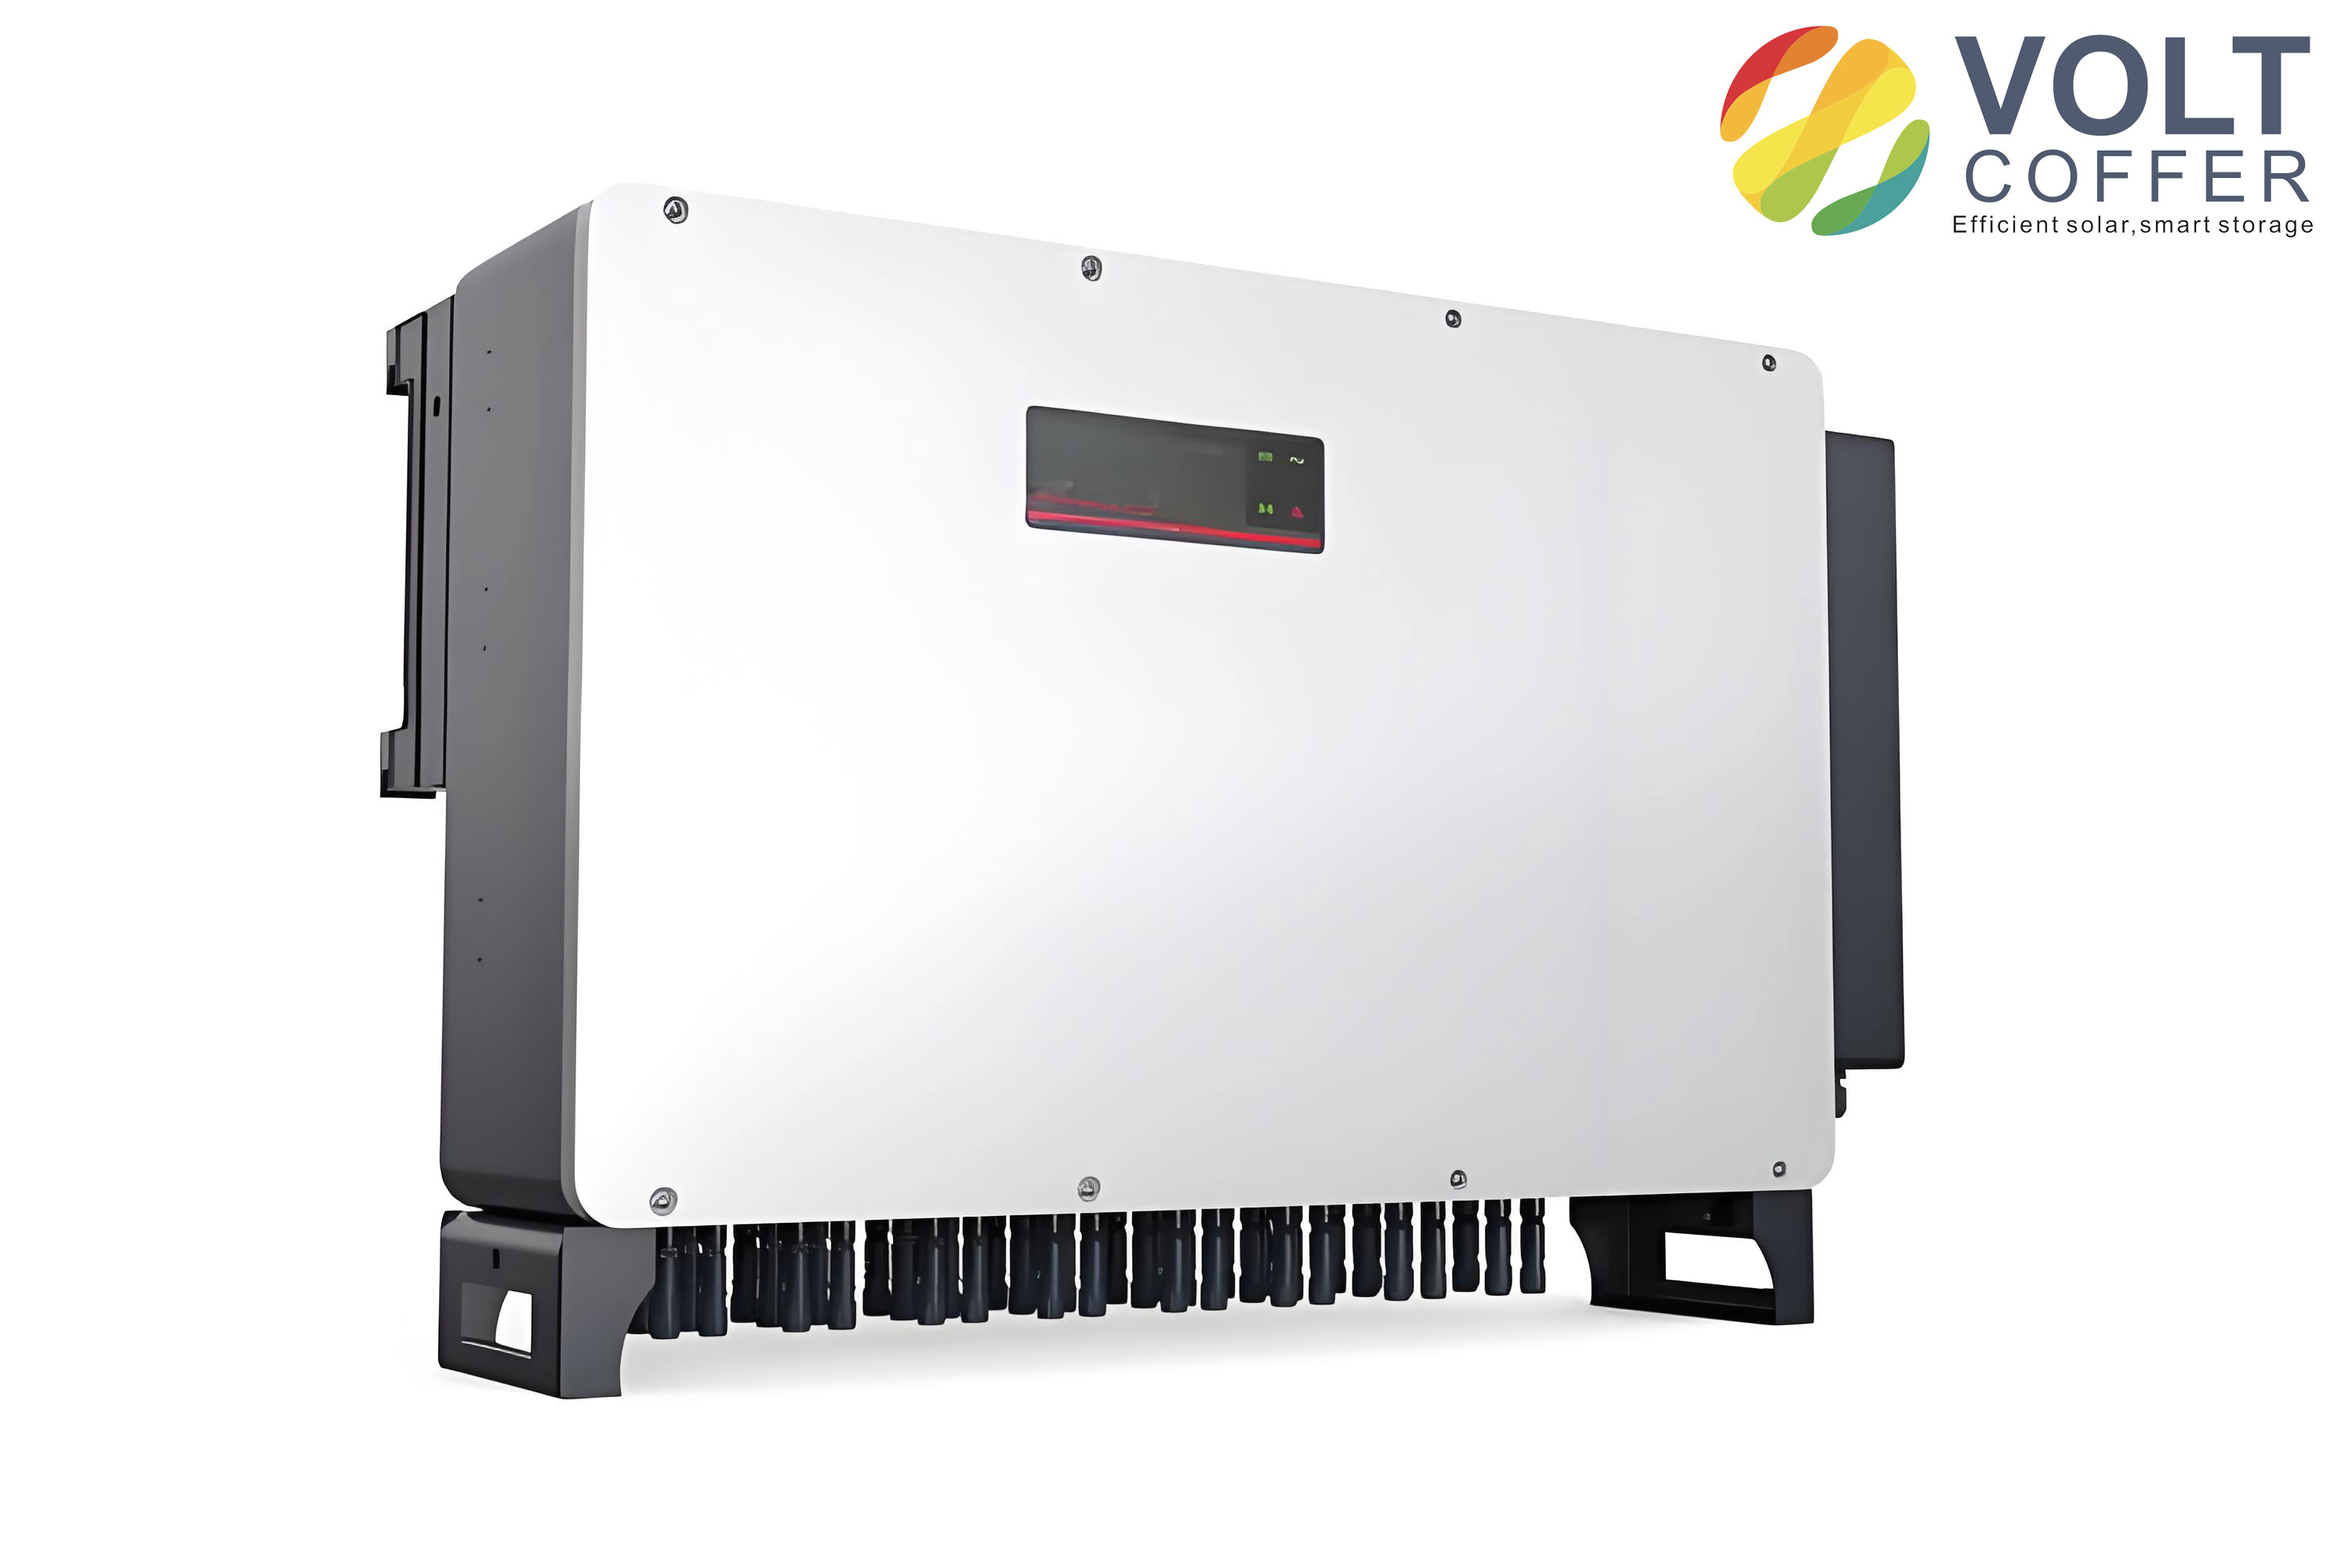
The typical three-phase voltage-source solar inverter with an L-type filter and step-up transformer is illustrated conceptually. The mathematical model in the dq synchronous reference frame is given by:
$$ \begin{cases} L\frac{di_d}{dt} = u_d – e_d + \omega L i_q \\ L\frac{di_q}{dt} = u_q – e_q – \omega L i_d \\ C\frac{du_{DC}}{dt} = i_{PV} – i_{DC} \end{cases} $$
where $e_d, e_q$ are the grid voltage components, $u_d, u_q$ are the inverter output voltage components, $i_d, i_q$ are the output current components, $\omega$ is the grid angular frequency, $L$ is the total coupling inductance (filter inductor plus transformer leakage), $C$ is the DC-link capacitance, $u_{DC}$ is the capacitor voltage, and $i_{PV}$ is the PV current. The dual-loop controller is modeled as follows:
Voltage outer loop:
$$ \begin{cases} \frac{dx_1}{dt} = u_{DC,ref} – u_{DC} \\ i_{d,ref} = K_{pU}(u_{DC,ref} – u_{DC}) + K_{iU}x_1 \end{cases} $$
where $K_{pU}$ and $K_{iU}$ are the proportional and integral gains of the voltage PI controller, $u_{DC,ref}$ is the reference DC voltage, and $i_{d,ref}$ is the d-axis current reference (the q-axis reference is typically set to zero for unity power factor).
Current inner loop:
$$ \begin{cases} \frac{dx_2}{dt} = i_{d,ref} – i_d \\ u_d = e_d – \omega L i_q – K_{pI}(i_{d,ref} – i_d) – K_{iI} x_2 \\ \frac{dx_3}{dt} = i_{q,ref} – i_q \\ u_q = e_q + \omega L i_d – K_{pI}(i_{q,ref} – i_q) – K_{iI} x_3 \end{cases} $$
In total, five parameters need to be identified: $K_{pU}$, $K_{iU}$, $K_{pI}$, $K_{iI}$, and $L$.
2. Virtual Measurement Excitation (VME) Implementation
To implement VME, we design auxiliary circuits that can replace the actual sensor signals with artificially generated signals without disrupting the normal operation of the solar inverter. For voltage measurements (grid voltage $e_{abc}$ or DC voltage $u_{DC}$), we use the circuit shown conceptually in Figure 1a: a DSP unit acquires the steady-state amplitude and phase of the actual signal via A/D converters, then generates the desired VME signal via D/A and amplifier, and switches the controller’s measurement input to the virtual signal using analog switches. For current measurements, we perform a Park transformation of the three-phase current to obtain $i_d$, $i_q$, $i_0$, modify the d- or q-component as required, and then reconstruct the three-phase signals back to the controller’s measurement input (Figure 1b).
By using VME, we can:
- Apply a disturbance to $u_{DC}$ while keeping grid voltage and grid current measurements unchanged, thus exciting only the outer voltage loop.
- Shield $u_{DC}$ and grid voltage measurements while perturbing the q-axis current measurement $i_q$, thus isolating the inner current loop dynamics.
- Inject a virtual voltage sag into the grid voltage measurement to identify the coupling inductance $L$ without physically short-circuiting the grid.
3. Stepwise Identification Procedure
Our method proceeds in three main stages, each using specific VME signals to ensure parameter identifiability.
3.1 Identification of Outer-Loop Parameters $K_{pU}$, $K_{iU}$
Step 1.1: Determination of $K_{iU}$ using a square-wave VME on $u_{DC}$
We first set the virtual measurement of $u_{DC}$ equal to the reference $u_{DC,ref}$ (e.g., 500 V). The solar inverter is started and operates at steady state with zero active power output. Then we apply a square-wave disturbance to the virtual $u_{DC}$ signal: a pulse of amplitude $\Delta u_{DC1}$ (e.g., 0.01 pu) and duration $T$ (0.05 s). According to the controller model, after the pulse ends, the d-axis current $i_d$ settles to a steady value $i_{d0}$ given by:
$$ i_{d0} = K_{iU} \int \Delta u_{DC1} \, dt = K_{iU} \cdot \Delta u_{DC1} \cdot T $$
From the measured $i_d$ response, we extract the average value over a window after the disturbance (e.g., 0.2–0.3 s) to obtain $i_{d0}$. Then:
$$ K_{iU} = \frac{i_{d0}}{\Delta u_{DC1} \cdot T} $$
Step 1.2: Determination of $K_{pU}$ using a sinusoidal VME on $u_{DC}$
Next, we superimpose a sinusoidal component onto the virtual $u_{DC}$ signal: $u_{DC} = u_{DC,ref} + \Delta u_{DC2} \sin(4\pi t)$, where $\Delta u_{DC2}$ = 0.002 pu and frequency = 2 Hz. The resulting $i_d$ response is:
$$ i_d(t) = i_{d0} + K_{pU} \Delta u_{DC2} \sin(4\pi t) + K_{iU}\Delta u_{DC2} \int_0^t \sin(4\pi \tau) d\tau = i_{d0} + K_{pU} \Delta u_{DC2} \sin(4\pi t) – \frac{K_{iU}\Delta u_{DC2}}{4\pi} (\cos(4\pi t) – 1) $$
Rearranging gives:
$$ K_{pU} \sin(4\pi t) = \frac{i_d(t) – i_{d0}}{\Delta u_{DC2}} + \frac{K_{iU}}{4\pi} (\cos(4\pi t) – 1) $$
Since $K_{iU}$ is already known, the term $K_{pU} \sin(4\pi t)$ can be reconstructed from the measured $i_d$ waveform. Performing an FFT on this reconstructed signal yields the amplitude of the 2 Hz component, which is exactly $K_{pU}$. Simulation results (shown in Table 1) confirm high accuracy.
3.2 Identification of Inner-Loop Ratios $\frac{K_{pI}}{L}$ and $\frac{K_{iI}}{L}$
To isolate the inner current loop, we use VME to shield the $u_{DC}$ measurement (fix it to $u_{DC,ref}$) and the grid voltage measurement (fix it to steady-state values). Then we apply a sinusoidal VME to the q-axis current measurement: $i_q^* = i_{q0} + \Delta i_q$, with $i_{q0}=0$ (due to unity power factor) and $\Delta i_q = -A \sin(4\pi t)$, $A=0.01$ pu. The q-axis current reference $i_{q,ref}$ remains zero. Under the assumption that the disturbance amplitude is small and frequency low enough to neglect $L \frac{di_q}{dt}$, the d-axis current deviation $(i_{d0} – i_d)$ can be derived from the q-axis controller equation:
$$ i_{d0} – i_d = \frac{K_{pI}}{L} A \sin(4\pi t) – \frac{K_{iI}}{L} \cdot \frac{A}{4\pi} (\cos(4\pi t) – 1) $$
Thus, the measured $(i_{d0} – i_d)$ curve contains both a DC component and a 2 Hz sinusoidal component. Performing FFT on the measured data (Table 2) gives:
- DC component = $\frac{K_{iI} A}{4\pi L}$ → ratio $\frac{K_{iI}}{L}$
- 2 Hz component amplitude = $\frac{K_{pI} A}{L}$ → ratio $\frac{K_{pI}}{L}$
The phase of the 2 Hz component also provides a consistency check: at $t=0.125$ s, $\sin(4\pi t)=1$, $\cos(4\pi t)=0$, so the value of $(i_{d0} – i_d)$ at that instant equals $\frac{K_{pI} A}{L}$.
3.3 Determination of Coupling Inductance $L$
We have two options to obtain $L$: direct measurement (if the physical inductor is accessible) or identification via VME. For the identification approach, we apply a virtual three-phase voltage sag on the grid voltage measurement (e.g., 5% depth, 50 ms duration) while keeping all other measured signals real. The active and reactive power responses ($P$, $Q$) of the solar inverter are recorded. Since $K_{pU}$ and $K_{iU}$ are already known, we only need to estimate $L$; $K_{pI}$ and $K_{iI}$ are then computed from the ratios. A standard particle swarm optimization (PSO) with 20 particles and 50 iterations is used to minimize the weighted error between simulated and measured $P$ and $Q$ waveforms. The optimization converges quickly due to the single-parameter search space.
4. Simulation Verification
We conducted simulations in MATLAB/Simulink using the detailed photovoltaic generation system model from SimPowerSystems. The true values of the solar inverter controller parameters are listed in Table 1.
Table 1. True values of solar inverter controller parameters
| Parameter | $K_{pU}$ | $K_{iU}$ | $K_{pI}$ | $K_{iI}$ | $L$ (pu) |
|---|---|---|---|---|---|
| True value | 6.9 | 800 | 0.3 | 20 | 0.21 |
Following the stepwise procedure:
- Outer loop: Applying square-wave VME ($\Delta u_{DC1}=0.01$ pu, $T=0.05$ s) gave $i_{d0}=0.3999$ → $K_{iU}=799.8$. Sinusoidal VME ($\Delta u_{DC2}=0.002$ pu, 2 Hz) and FFT of $K_{pU}\sin(4\pi t)$ yielded $K_{pU}=6.914$. Errors are negligible.
- Inner loop ratios: With $A=0.01$ pu sinusoidal VME on $i_q^*$, FFT of $(i_{d0}-i_d)$ gave DC component = 0.0775 → $\frac{K_{iI}}{L}=97.389$, and 2 Hz amplitude = 1.425 → $\frac{K_{pI}}{L}=1.425$.
- Inductance: Using virtual voltage sag VME and PSO, the identified $L$ was 0.208 pu. Then $K_{pI}=1.425 \times 0.208 = 0.296$ and $K_{iI}=97.389 \times 0.208 = 20.24$.
Table 2. Identified vs. true solar inverter parameters
| Parameter | $K_{pU}$ | $K_{iU}$ | $K_{pI}$ | $K_{iI}$ | $L$ (pu) |
|---|---|---|---|---|---|
| True | 6.9 | 800 | 0.3 | 20 | 0.21 |
| Identified | 6.914 | 799.8 | 0.296 | 20.24 | 0.208 |
| Error | 0.20% | 0.03% | 1.33% | 1.20% | 0.95% |
The identification errors are well within acceptable ranges, demonstrating the feasibility of the stepwise VME-based method for solar inverter controllers.
5. Advantages and Discussion
The proposed method offers several distinct advantages over conventional identification approaches:
- Decoupling of loops: By selectively shielding measurement signals, we can excite the outer loop without interference from the inner loop, and vice versa. This resolves the identifiability problem inherent to cascaded controllers.
- No need for optimization (in most cases): If the inductance $L$ can be directly measured (e.g., using an LCR meter or nameplate data), all parameters are obtained analytically without any iterative algorithm. Even when $L$ must be identified, only a single-parameter optimization is required.
- Safe and repeatable: VME is applied at the secondary side, eliminating the need to create short circuits or large disturbances on the primary side. The tests can be performed during commissioning or routine maintenance without affecting the grid.
- Flexible excitation forms: Square-wave and sinusoidal VME signals are easy to generate and analyze, and they produce clear, quantifiable relationships between measured outputs and unknown parameters.
Potential practical considerations include the need for additional signal conditioning hardware (DSP, D/A, analog switches) and the requirement that the solar inverter’s controller accepts external measurement inputs. However, most modern digital controllers have accessible A/D input ports, making VME implementation straightforward. The method is also extensible to other converter topologies, such as those using proportional-resonant controllers or multi-level inverters.
6. Conclusion
We have presented a stepwise parameter identification method for solar inverter controllers based on Virtual Measurement Excitation. By decoupling the outer voltage loop and inner current loop through selective VME, we ensure identifiability of all five controller parameters ($K_{pU}$, $K_{iU}$, $K_{pI}$, $K_{iI}$, $L$). The procedure involves simple analytical calculations from the measured responses, with only a single-parameter search needed if $L$ is not directly measurable. Simulation results on a detailed photovoltaic system model confirm high accuracy, with errors below 1.5%. The VME technique provides a safe, repeatable, and efficient way to characterize solar inverter dynamics, which is essential for accurate power system modeling and grid integration studies.
Future work will focus on developing a compact VME hardware prototype and validating the method on commercial solar inverters in laboratory and field environments. Additionally, we plan to extend the approach to identify parameters of more advanced control schemes, such as grid-supporting inverters with virtual synchronous generator emulation.