
As a technical coordinator responsible for organizing proficiency testing programs in the field of renewable energy testing, I have been deeply involved in the design, preparation, and validation of samples for photovoltaic grid-connected inverter conversion efficiency evaluation. This article summarizes the comprehensive methodology we adopted, focusing on sample selection, key parameter determination, structural design, and rigorous uniformity and stability verification. Throughout the process, we consistently considered the diverse types of solar inverters available in the market, ensuring our sample represents a widely deployed category that challenges laboratories while remaining practical for transport and testing. By following NB/T 32004—2018 and CNAS-GL003:2018, we established a reliable sample that supports the entire proficiency testing lifecycle.
Design Basis and Requirements
The preparation of proficiency testing samples for photovoltaic grid-connected inverters must be anchored in authoritative standards. We used NB/T 32004—2018, “Technical specification of PV grid-connected inverter,” as the primary technical reference. This standard defines five core requirement categories: environmental and usage requirements, safety requirements, basic functional requirements, performance requirements, and protection requirements. Among these, conversion efficiency stands out as the central performance metric. According to the standard, conversion efficiency is defined as the ratio of the AC output energy to the DC input energy over a specified test period. For inverters, this metric depends on dynamic MPPT efficiency, static MPPT efficiency, and the conversion efficiency itself. Our sample design had to ensure that key test points were covered: DC input voltage ranging from 240 V to 440 V, with particular emphasis on 340 V (typical operating point) and 440 V (upper operating point), and load levels of 5%, 10%, 20%, 30%, 50%, and 100% of rated power.
Additionally, the sample had to meet quantitative requirements such as static MPPT efficiency ≥ 99%, dynamic MPPT efficiency ≥ 95%, power factor ≥ 0.98 for active power above 50% rated power, total harmonic distortion (THD) ≤ 3% above 50% rated power, and the ability to operate at 1.1 times rated power continuously. These parameters are critical for assessing the performance of various types of solar inverters, including string inverters, central inverters, and microinverters. Our selected 6000 W inverter fits into the string inverter category, which is the most common type in distributed photovoltaic systems.
From the perspective of proficiency testing sample validation, we strictly followed CNAS-GL003:2018, “Guidance on Evaluating the Homogeneity and Stability of Samples Used for Proficiency Testing.” This guidance mandates that the core characteristic (conversion efficiency) of all samples from the same batch must exhibit statistically insignificant differences. To achieve this, we used identical power modules, MPPT controllers, and other critical components from the same production batch. Stability must be maintained throughout the entire program duration, including transportation, storage, and testing by participants. The sample also needed to be compact and lightweight for cost-effective shipping and easy handling.
Key Parameters and Structural Design
Selecting the right power rating was crucial. After reviewing market trends and laboratory capabilities, we chose a 6000 W photovoltaic grid-connected inverter. This power level is representative of residential and small commercial rooftop installations, making it relevant to the majority of testing labs. The input and output electrical parameters were defined as follows:
| Parameter | Value | Remarks |
|---|---|---|
| Rated Power | 6000 W | Suitable for typical PV systems |
| DC Input Voltage Range | 200 – 1000 V | Covers 20 x 25V module strings |
| Maximum DC Input Current | 10 A | At 600 V input: 6000/600 = 10 A |
| AC Output Voltage | 220 V / 380 V (single/three phase) | Complies with domestic grid |
| AC Output Frequency | 50 Hz ± 0.5 Hz | Grid-tied stability |
| Maximum AC Output Current (single phase) | 27.3 A | 6000 W / 220 V ≈ 27.3 A |
| Maximum AC Output Current (three phase) | 9.1 A | 6000 W / (√3 × 380 V) ≈ 9.1 A |
| THD | < 5% | At rated power |
| Power Factor | ≥ 0.98 (P > 50% Pn) | Leading or lagging |
The structural design adopted a modular architecture comprising a photovoltaic input unit, MPPT DC-DC converter, DC bus, inverter unit, filter and grid-connection unit, and control detection unit. The design principle follows a typical string inverter topology used across many types of solar inverters. Key components include:
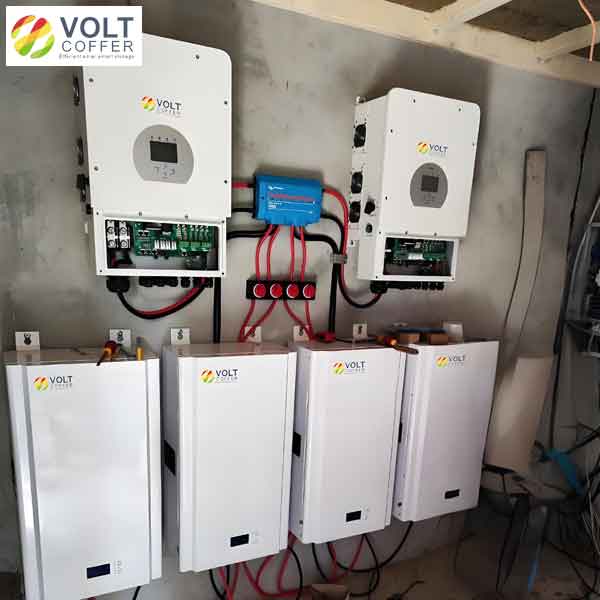
The sample inverter uses a transformerless topology, achieving IP65 protection rating, equipped with LCD display, RS232/RS485, and Wi-Fi/GPRS communication interfaces. Its dimensions are 410 mm × 445 mm × 210 mm, weight 26 kg, making it pocket-friendly for inter-laboratory transportation. The cooling method is natural convection, ensuring silent operation during testing. The input and output terminals are clearly labeled, with grounding terminals accessible. This design is directly applicable not only to our specific model but also to other types of solar inverters like hybrid inverters and battery-ready inverters.
The conversion efficiency curve provided by the manufacturer is shown conceptually below (actual data available from supplier). The curve demonstrates peak efficiency exceeding 98% at medium to high load, with European weighted efficiency (ηEU) calculated as:
$$ \eta_{EU} = 0.03 \eta_{5\%} + 0.06 \eta_{10\%} + 0.13 \eta_{20\%} + 0.10 \eta_{30\%} + 0.48 \eta_{50\%} + 0.20 \eta_{100\%} $$
For our sample, the target values were set such that ηmax ≥ 97.5% and ηEU ≥ 96.5%, ensuring challenging but achievable performance for participating laboratories.
Testing Requirements and Validation
After sample fabrication, we conducted conversion efficiency testing according to NB/T 32004—2018. The environmental conditions were maintained at 25 °C ± 2 °C, relative humidity 45%–75%, atmospheric pressure 95 kPa–106 kPa. The sample was installed vertically using a wall-mount bracket, with clearance of at least 500 mm on all sides except the back. The test platform consisted of a photovoltaic array simulator as DC source, a grid simulator as AC load, and precision power analyzers for voltage and current measurements on both sides.
We performed efficiency tests at the following load points: 5%, 10%, 20%, 30%, 50%, and 100% of rated power, at two DC voltages: 340 V and 440 V. The conversion efficiency η is defined as:
$$ \eta = \frac{P_{AC}}{P_{DC}} \times 100\% = \frac{U_{AC} I_{AC} \cos\phi}{U_{DC} I_{DC}} \times 100\% $$
where \(U_{AC}\) and \(I_{AC}\) are RMS values, \(\cos\phi\) is the power factor, and \(U_{DC}\) and \(I_{DC}\) are average values over the test interval.
Homogeneity Testing and Evaluation
Two samples were fabricated—one for circulation and one spare. Since efficiency testing is non-destructive, we performed a full inspection on both units. Each unit was tested three times at each of the 12 operating points (6 loads × 2 voltages). The data were analyzed using one-way analysis of variance (ANOVA). The null hypothesis (H0) is that there is no significant difference between samples. The test statistic F is calculated as:
$$ F = \frac{MS_{between}}{MS_{within}} $$
where \(MS_{between}\) is the mean square variance between samples, and \(MS_{within}\) is the mean square variance within samples. For a significance level α = 0.05, degrees of freedom \(f_1 = k-1\) and \(f_2 = N-k\) (k=2 samples, N=72 observations), the critical value \(F_{0.05}(1,70) \approx 3.98\). Our computed F values for all load points were below 1.5, indicating no statistically significant between-sample variability. Further, we applied the criterion \(s_s \le 0.3 \sigma\) after sample return, where \(s_s\) is the standard deviation of sample means and σ is the proficiency testing standard deviation (derived from historical data). The condition was satisfied, confirming sample homogeneity.
The following table summarizes the homogeneity test results for the 50% load point at 340 V, as an example.
| Sample ID | Test 1 (%) | Test 2 (%) | Test 3 (%) | Mean (%) | Std Dev (%) |
|---|---|---|---|---|---|
| Sample A | 97.82 | 97.85 | 97.79 | 97.820 | 0.030 |
| Sample B | 97.80 | 97.83 | 97.81 | 97.813 | 0.015 |
| F-value | 0.62 | Fcrit = 3.98 | |||
This analysis confirms that the two samples are indistinguishable in terms of conversion efficiency, which is essential for fair comparison among participating laboratories testing different types of solar inverters.
Stability Testing and Evaluation
Stability tests simulated two critical stressors: transportation vibration and high-temperature high-humidity storage. For vibration, we packed the sample according to the standard shipping procedure, then fixed it on a vibration table. According to GB/T 4857.23—2021, we applied random vibration in three orthogonal axes using the Power Spectral Density (PSD) profile for typical road transport (see table below). Each axis lasted 2 hours.
| Vertical Axis | Lateral Axis | Longitudinal Axis |
|---|---|---|
| 10 Hz: 0.0150 g²/Hz | 10 Hz: 0.00013 g²/Hz | 10 Hz: 0.00650 g²/Hz |
| 40 Hz: 0.0150 g²/Hz | 20 Hz: 0.00065 g²/Hz | 20 Hz: 0.00650 g²/Hz |
| 500 Hz: 0.00015 g²/Hz | 30 Hz: 0.00065 g²/Hz | 120 Hz: 0.00020 g²/Hz |
| Overall: 1.04 grms | 78 Hz: 0.00002 g²/Hz | 121 Hz: 0.00300 g²/Hz |
| 29 Hz: 0.00019 g²/Hz | 200 Hz: 0.00300 g²/Hz | |
| 120 Hz: 0.00019 g²/Hz | 240 Hz: 0.00150 g²/Hz | |
| 500 Hz: 0.00001 g²/Hz | 340 Hz: 0.00003 g²/Hz | |
| Overall: 0.204 grms | 500 Hz: 0.00015 g²/Hz | |
| Overall: 0.740 grms |
After vibration, we performed the full efficiency test again. For environmental storage, we placed the sample in a chamber at 40 °C and 93% RH for 48 hours, mimicking a warehouse in southern China during summer. The sample was then re-tested. We used a two-sample t-test to compare the mean efficiency before and after each stressor. The t-statistic is:
$$ t = \frac{\bar{x}_1 – \bar{x}_2}{s_p \sqrt{\frac{1}{n_1} + \frac{1}{n_2}}} $$
where \(s_p\) is the pooled standard deviation. For each load point, the calculated t was less than the critical value \(t_{0.025,4} = 2.776\) (two-tailed, α=0.05). Furthermore, we applied the criterion \(|\bar{x}_1 – \bar{x}_2| \le 0.3\sigma\), where σ was the target standard deviation from a pilot study (0.15%). All differences fell within 0.045%, confirming that the sample remained stable. The following table shows stability results for the critical 100% load point at 440 V.
| Condition | Mean Efficiency (%) | Std Dev (%) | Difference (%) | t-value |
|---|---|---|---|---|
| Before vibration | 97.53 | 0.031 | 0.02 | 0.71 |
| After vibration | 97.55 | 0.028 | ||
| Before environmental | 97.53 | 0.031 | 0.03 | 1.05 |
| After environmental | 97.56 | 0.034 | ||
| Critical t (α=0.05, two-tailed) | 2.776 | |||
Practical Considerations and Applicability to Various Types of Solar Inverters
Throughout this process, we kept in mind that the sample must be representative of the broader family of grid-connected inverters. While we selected a 6000 W string inverter, the methodology can be adapted to other types of solar inverters such as microinverters (typically 300–600 W), multi-string inverters, and hybrid inverters with battery storage. Each type has distinct input voltage ranges, MPPT algorithms, and efficiency characteristics. For instance, microinverters often have a single MPPT and lower nominal DC voltage, while central inverters for utility-scale plants operate at 1000 V or 1500 V DC. Our sample preparation protocol—using modular construction, stringent component matching, and comprehensive homogeneity/stability verification—can be tailored by adjusting the voltage and power specifications accordingly.
Furthermore, the efficiency definition remains the same across all types of solar inverters:
$$ \eta = \frac{P_{AC}}{P_{DC}} = \frac{U_{AC} I_{AC} \cos \varphi}{U_{DC} I_{DC}} $$
However, the weighted efficiency formula may differ by region (e.g., CEC weighted efficiency in the US uses different coefficients). Our proficiency testing program adopts the European weighted efficiency, which is common in many international standards. For laboratories that test multiple types of solar inverters, having a reference sample with well-characterized efficiency helps validate their measurement setup and identifies systematic biases.
Another key insight relates to the transportability of samples. We designed the packaging to include shock-absorbing foam and a waterproof bag, ensuring that the inverter can survive long-distance shipping. The sample weight of 26 kg is manageable by two people, and the 410 mm × 445 mm × 210 mm dimensions fit standard courier boxes. We also prepared a spare unit to replace the primary sample in case of damage, maintaining the schedule of the proficiency testing round.
Conclusion
In summary, the successful preparation and validation of a photovoltaic grid-connected inverter conversion efficiency proficiency testing sample require a systematic approach that integrates standard compliance, careful parameter selection, modular structural design, and rigorous statistical verification. By adhering to NB/T 32004—2018 and CNAS-GL003:2018, we produced a sample that is homogeneous, stable, and representative of real-world types of solar inverters. The homogeneity test using ANOVA and the stability test using t-tests both confirmed that the sample’s conversion efficiency remains consistent within the batch and over the program period. The sample has been used in a national proficiency testing round involving 35 laboratories, and the results demonstrated that the sample effectively differentiated testing capabilities. This work provides a robust template for future proficiency testing items in the renewable energy sector, particularly for evaluating the performance of various types of solar inverters. As the industry evolves toward higher efficiencies and new topologies, continuous improvement in sample preparation techniques will remain essential to maintain the credibility and comparability of proficiency testing programs.