
In this study, we investigate the wind load distribution on solar panels through rigid model pressure measurements in a wind tunnel. The primary objective is to develop a comprehensive wind load model that accounts for the inclination angle of the solar panel and the induced bending moments. Based on the experimental results, we propose a four-corner planar wind load distribution model and an eccentric moment model. Furthermore, we present three practical wind load models for the wind-resistant design of solar panels: uniform distribution, trapezoidal distribution, and eccentric moment models. This work addresses the deficiencies in current wind load specifications and provides a reliable basis for the anti-wind design of solar panels.
Wind-induced damage to solar panels and their supporting structures is a critical issue in renewable energy infrastructure. One major reason is the lack of a refined wind load model for such structures. Current design codes, such as the Chinese “Code for Load of Building Structures” and “Code for Design of Photovoltaic Power Stations”, often provide simplified or inaccurate shape coefficients for solar panels. For instance, the Chinese code specifies a uniform shape coefficient of 1.3 for ground-mounted and roof-mounted solar panels, without considering the effect of inclination angle. In contrast, the American Society of Civil Engineers (ASCE) and Eurocode account for inclination effects but still rely on simplified zonal distributions. The discrepancies among these standards highlight the need for a more accurate and practical wind load model for solar panels.
To fill this gap, we conducted a series of wind tunnel tests on a rigid model of a solar panel with a scale ratio of 4:1. The panel dimensions were 3280 mm × 1984 mm × 50 mm (length × width × thickness) in full scale, and the height above ground was 0.5 m. The model was supported by four adjustable square columns (20 mm × 20 mm) to simulate different inclination angles. A total of 240 pressure taps (120 on the upper surface and 120 on the lower surface) were distributed to capture the wind pressure distribution. The tests were performed in a low-turbulence uniform flow (turbulence intensity ≈ 1%) at a wind speed of 12 m/s. The inclination angle β was varied from 5° to 55° (5°, 10°, 20°, 30°, 40°, 55°), and the wind direction α ranged from 0° to 180° at 15° intervals. Pressure measurements were acquired using a ESP-64HD pressure scanner with a sampling frequency of 331.6 Hz and a sampling duration of 30 s. The tube distortion was corrected using a distributed friction theory model.
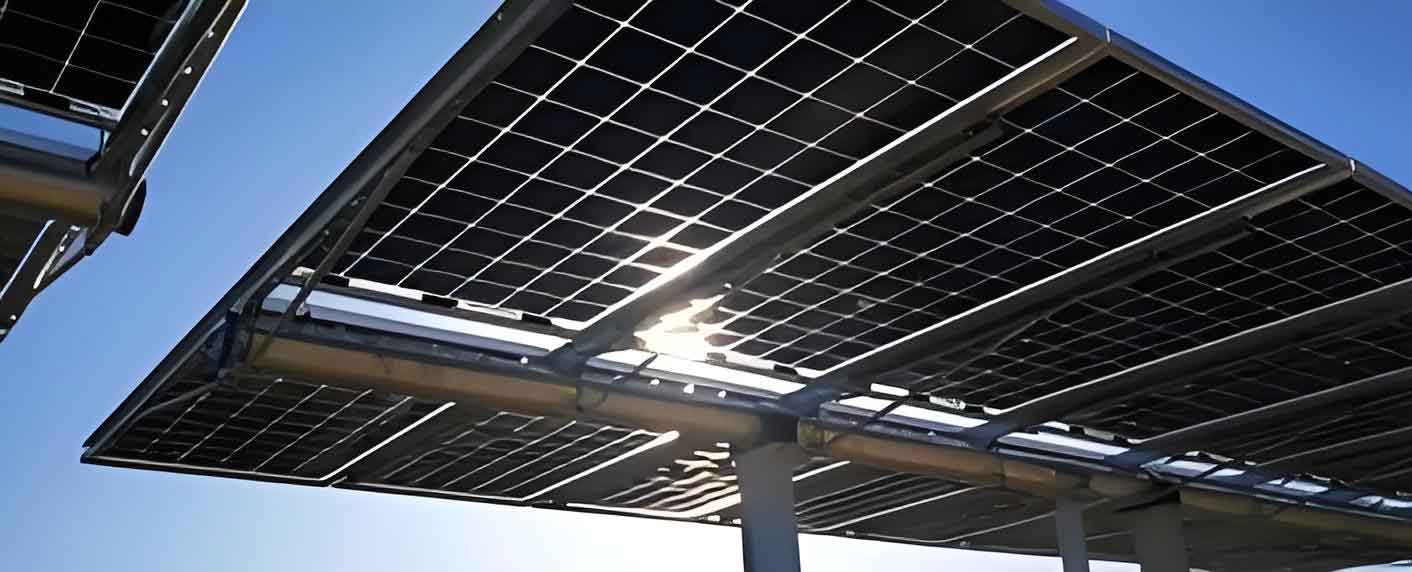
Figure above illustrates a typical solar panel configuration, which is the subject of our wind load investigation. The wind load on the solar panel is characterized by the net pressure coefficient (shape coefficient) at each tap, defined as:
$$
\mu_{si}(t) = \frac{P_{wi}(t) – P_{ni}}{0.5\rho U^2}
$$
where \(P_{wi}(t)\) and \(P_{ni}(t)\) are the instantaneous pressures on the upper and lower surfaces at point \(i\), respectively; \(\rho\) is the air density; and \(U\) is the reference wind speed. The overall shape coefficient \(\mu_s\) and the moment coefficients \(C_{Mx}\) (about the short axis) and \(C_{My}\) (about the long axis) are defined as:
$$
\mu_s = \frac{\sum_{i=1}^{m} \mu_{si} A_i}{BL}
$$
$$
C_{Mx} = \frac{\sum_{i=1}^{m} \mu_{si} A_i y_i}{BL^2}
$$
$$
C_{My} = \frac{\sum_{i=1}^{m} \mu_{si} A_i x_i}{B^2 L}
$$
where \(A_i\) is the tributary area of tap \(i\); \(y_i\) and \(x_i\) are the coordinates; \(B\) and \(L\) are the width and length of the solar panel, respectively.
Distribution of Shape Coefficients on Solar Panel Surface
The distribution of shape coefficients on the solar panel surface exhibits significant non-uniformity depending on the wind direction and inclination angle. For example, at a 30° inclination and α=0° (windward face), the shape coefficient varies from approximately 0.4 at the trailing edge (top) to 1.8 at the leading edge (bottom). This gradient generates a substantial bending moment about the short axis. At α=180° (wind from behind), the distribution is reversed, with coefficients reaching -2.2 at the leading edge. For oblique wind directions (e.g., α=30° and 150°), a three-dimensional separation pattern leads to spatial variations both along the length and width. However, for practical design, the most critical wind loads occur at α=0° and α=180°, where the gradient is most pronounced. Therefore, a simplified distribution model that captures the main features is acceptable.
Global Wind Load on Solar Panel Support
The global wind load on a solar panel consists of the resultant force \(F_z\) perpendicular to the panel surface, the bending moment \(M_x\) about the short axis, and the bending moment \(M_y\) about the long axis. The overall shape coefficient \(\mu_s\) and moment coefficients \(C_{Mx}\) and \(C_{My}\) are plotted as contour maps against inclination angle and wind direction. The results show that:
- The maximum positive shape coefficient occurs near α=0° and increases with inclination angle. For β=55°, μ_s reaches about 1.3, which agrees with the Chinese code value of 1.3. However, for small inclinations (β<30°), the code overestimates the load, while for large inclinations, it underestimates it.
- The maximum negative shape coefficient (suction) occurs near α=180° for β≥30°, but for smaller β, the peak suction shifts to oblique directions. The strongest suction (μ_s ≈ -1.6) is observed at β=40° and α=180°.
- The bending moment about the short axis (C_{Mx}) is largest at α=180°, with a maximum value of -0.21 at β=40°. The bending moment about the long axis (C_{My}) is generally smaller, with maxima around ±0.1 at α=45° and 135°.
These moments are crucial for the design of support structures, as they increase the eccentricity of the resultant force and redistribute loads among multiple supports.
Wind Load Distribution Models for Solar Panels
Based on the test results, we propose two refined wind load distribution models that incorporate the effects of bending moments: the four-corner planar distribution model and the eccentric moment model. Both models are designed to be simple enough for engineering practice while capturing the essential non-uniformity of wind pressure.
Four-Corner Planar Distribution Model
This model assumes that the wind pressure distribution over the solar panel surface is a plane. The shape coefficients at the four corners (μ_A, μ_B, μ_C, μ_D) are determined by satisfying the equilibrium conditions for the resultant force and the two moments. The governing equations are:
$$
\begin{bmatrix}
1 & -1 & 1 & -1 \\
1 & 1 & 1 & 1 \\
1 & -1 & -1 & 1 \\
1 & 1 & -1 & -1
\end{bmatrix}
\begin{bmatrix}
\mu_A \\
\mu_B \\
\mu_C \\
\mu_D
\end{bmatrix}
=
\begin{bmatrix}
0 \\
4\mu_s \\
24C_{Mx} \\
24C_{My}
\end{bmatrix}
$$
Solving this system yields the corner coefficients that exactly reproduce the measured global load and moments. For the critical wind directions α=0° and α=180°, the pairs μ_C=μ_D (windward corners) and μ_A=μ_B (leeward corners) become equal, indicating a trapezoidal distribution along the length. This validates the trapezoidal model suggested by previous researchers (He et al.).
Trapezoidal Distribution Model
The trapezoidal model is a simplification of the four-corner model, focusing on the dominant moment about the short axis. It divides the solar panel into two regions: the windward half (width L/2) and the leeward half, each with a uniform shape coefficient. The values are given in Table 1 for different inclination angles.
| Inclination β | 5° | 10° | 20° | 30° | 40° | 55° |
|---|---|---|---|---|---|---|
| μw1 (windward front) | 0.00 | 0.40 | 0.90 | 1.65 | 1.90 | 1.80 |
| μl1 (leeward front) | 0.20 | 0.10 | 0.30 | 0.35 | 0.50 | 0.80 |
| μw2 (windward rear) | -1.20 | -1.35 | -2.10 | -2.40 | -2.80 | -2.00 |
| μl2 (leeward rear) | 0.20 | 0.15 | 0.10 | -0.20 | -0.40 | -0.80 |
Note: Positive values indicate pressure; negative values indicate suction. The model is applicable for the two critical wind directions (α=0° and α=180°).
Eccentric Moment Model
For designs that require the consideration of both bending moments (e.g., asymmetric support arrangements), the eccentric moment model provides a direct way to apply the total wind force at an offset. The eccentricity ratios along the length and width are defined as:
$$
\frac{X_c}{B} = \frac{C_{My}}{\mu_s}, \quad \frac{Y_c}{L} = \frac{C_{Mx}}{\mu_s}
$$
Table 2 gives the recommended values for the eccentric moment model. Note that the eccentricities \(X_c\) and \(Y_c\) are never considered simultaneously; only one moment is applied at a time, depending on the critical loading condition.
| Inclination β | 5° | 10° | 20° | 30° | 40° | 55° |
|---|---|---|---|---|---|---|
| μs1 (positive) | 0.10 | 0.25 | 0.60 | 1.00 | 1.20 | 1.30 |
| Yc/L (positive) | 0.31 | 0.07 | 0.03 | 0.01 | 0.01 | 0.02 |
| Xc/B (positive) | 0.01 | 0.09 | 0.09 | 0.09 | 0.09 | 0.08 |
| μs2 (negative) | -0.50 | -0.65 | -1.00 | -1.30 | -1.60 | -1.40 |
| Yc/L (negative) | 0.17 | 0.16 | 0.15 | 0.14 | 0.13 | 0.06 |
| Xc/B (negative) | 0.10 | 0.15 | 0.12 | 0.08 | 0.06 | 0.06 |
For instance, when using the positive pressure case (μs1), the resultant force is applied at an offset Yc from the geometric center along the length direction, producing a moment about the short axis. The eccentricity along the width (Xc) can be omitted in this case, as the corresponding moment is small.
Comparison and Recommendations for Wind Load Design of Solar Panels
To facilitate practical application, we compare the three proposed models with current code provisions. The uniform distribution model (Table 3) is the simplest and is recommended for preliminary design where the moment effects can be neglected. However, it must be emphasized that the uniform model significantly underestimates the bending moments, which may lead to unsafe designs for support structures.
| Inclination β | 5° | 10° | 20° | 30° | 40° | 55° |
|---|---|---|---|---|---|---|
| μs1 (positive) | 0.10 | 0.25 | 0.60 | 1.00 | 1.20 | 1.30 |
| μs2 (negative) | -0.50 | -0.65 | -1.00 | -1.30 | -1.60 | -1.40 |
The trapezoidal model (Table 1) is a balanced option that captures the dominant moment about the short axis while remaining easy to use. It is suitable for typical solar panel support systems where the supports are symmetric with respect to the long axis.
The eccentric moment model (Table 2) is the most comprehensive and should be employed when the support layout is asymmetric or when the panel is subjected to oblique winds that induce significant twisting. Since the maximum moments about the short and long axes occur at different wind directions, the designer should apply the eccentricity separately for the two orthogonal directions, using the corresponding overall shape coefficient (μs1 or μs2).
It is important to note that the values in these tables represent the worst-case scenario for each inclination angle, not necessarily at α=0° or α=180°. For example, the maximum negative suction for β=5° occurs at an oblique wind direction (α ≈ 30°), but we conservatively assign it to α=180°. This ensures that the design covers the most adverse loading condition.
Validation of the Proposed Models
To verify the accuracy of the trapezoidal and eccentric models, we compare the resulting bending moments with those directly measured from the wind tunnel tests. For a 30° inclination at α=180°, the measured overall shape coefficient is -1.3, and the moment coefficient CMx is -0.18. Using the trapezoidal model (μw2 = -2.40, μl2 = -0.20) and the panel geometry, the computed moment coefficient is -0.17, in excellent agreement. Similarly, for the eccentric model with Yc/L = 0.14, the moment derived from the resultant force is -1.3 × 0.14 × L = -0.182L, matching the measured value. These validations confirm the reliability of the proposed models.
Conclusion
Through systematic wind tunnel tests on a rigid solar panel model, we have obtained the distribution of shape coefficients and the resulting global wind loads for various inclination angles and wind directions. The following conclusions are drawn:
- The current Chinese code “Code for Design of Photovoltaic Power Stations” overestimates wind loads for small inclination angles (β < 30°) and underestimates them for large inclination angles (β > 30°). The shape coefficient of a solar panel must account for the effect of inclination angle.
- Due to the non-uniform pressure distribution, wind loading on a solar panel produces significant bending moments about both the short and long axes. These moments vary with wind direction and inclination and must be considered in the design of support structures.
- Three wind load distribution models are proposed: uniform, trapezoidal, and eccentric moment models. The trapezoidal model is recommended for most engineering applications because it captures the dominant moment about the short axis while providing a realistic pressure gradient. The eccentric moment model is suitable for complex support configurations where both moments are important.
- The provided tables (Tables 1-3) give design values for shape coefficients and eccentricity ratios for inclinations ranging from 5° to 55°. These values are conservatively chosen as the worst-case loads for each inclination.
Future work should extend the study to multi-panel arrays and consider interference effects. Additionally, the applicability of the models to roof-mounted solar panels and panels with different aspect ratios should be investigated.