
In the context of the carbon peak and carbon neutrality goals, regions worldwide are vigorously promoting solar power stations. The solar inverter, as a critical component in the photovoltaic (PV) power generation process, converts direct current (DC) into alternating current (AC). During the design and construction of PV systems, the selection and optimization of the solar inverter significantly impact power generation efficiency. Common inverter topologies include centralized, string, micro-inverter, and modular multi-level inverter schemes, each suited for different scenarios. To enhance solar power generation efficiency, engineers must tailor the solar inverter design based on local conditions and power requirements.
1. Project Overview and Initial Inverter Selection
I was involved in a solar power plant project located in a mountainous area aimed at alleviating local electricity shortages. Field surveys indicated an average annual solar radiation of 4704.12 MJ/m²·a, classifying the region as solar-rich. The initial design adopted a multi-module independent generation configuration with grid-connected integration. The entire system comprised 20 units, each with a grid-connected capacity of 1 MWp, equipped with a 1,000 kVA step-up transformer to 35 kV, subsequently fed into a nearby substation. PV modules were 250 W polycrystalline silicon panels installed at a 22° tilt angle. Each 1 MW array consisted of 100 sub-units, each arranged as 20×2 panels, forming two parallel branches, yielding 200 branches per array. The initial solar inverter solution was a centralized design: each 1 MW array included 20 DC combiner boxes with a 10-in-1-out configuration. An inverter room housed two 500 kW centralized solar inverters, with an output voltage of 0.27 kV, connected to a 1,000 kVA transformer. The inverter room was a single-story reinforced concrete structure. However, during early operation, I observed that shading from surrounding mountains significantly reduced power output. To better support local low-carbon development, I proposed upgrading the solar inverter design to a string topology.
2. String Solar Inverter Design Proposal
2.1 Design Configuration and Cost Analysis
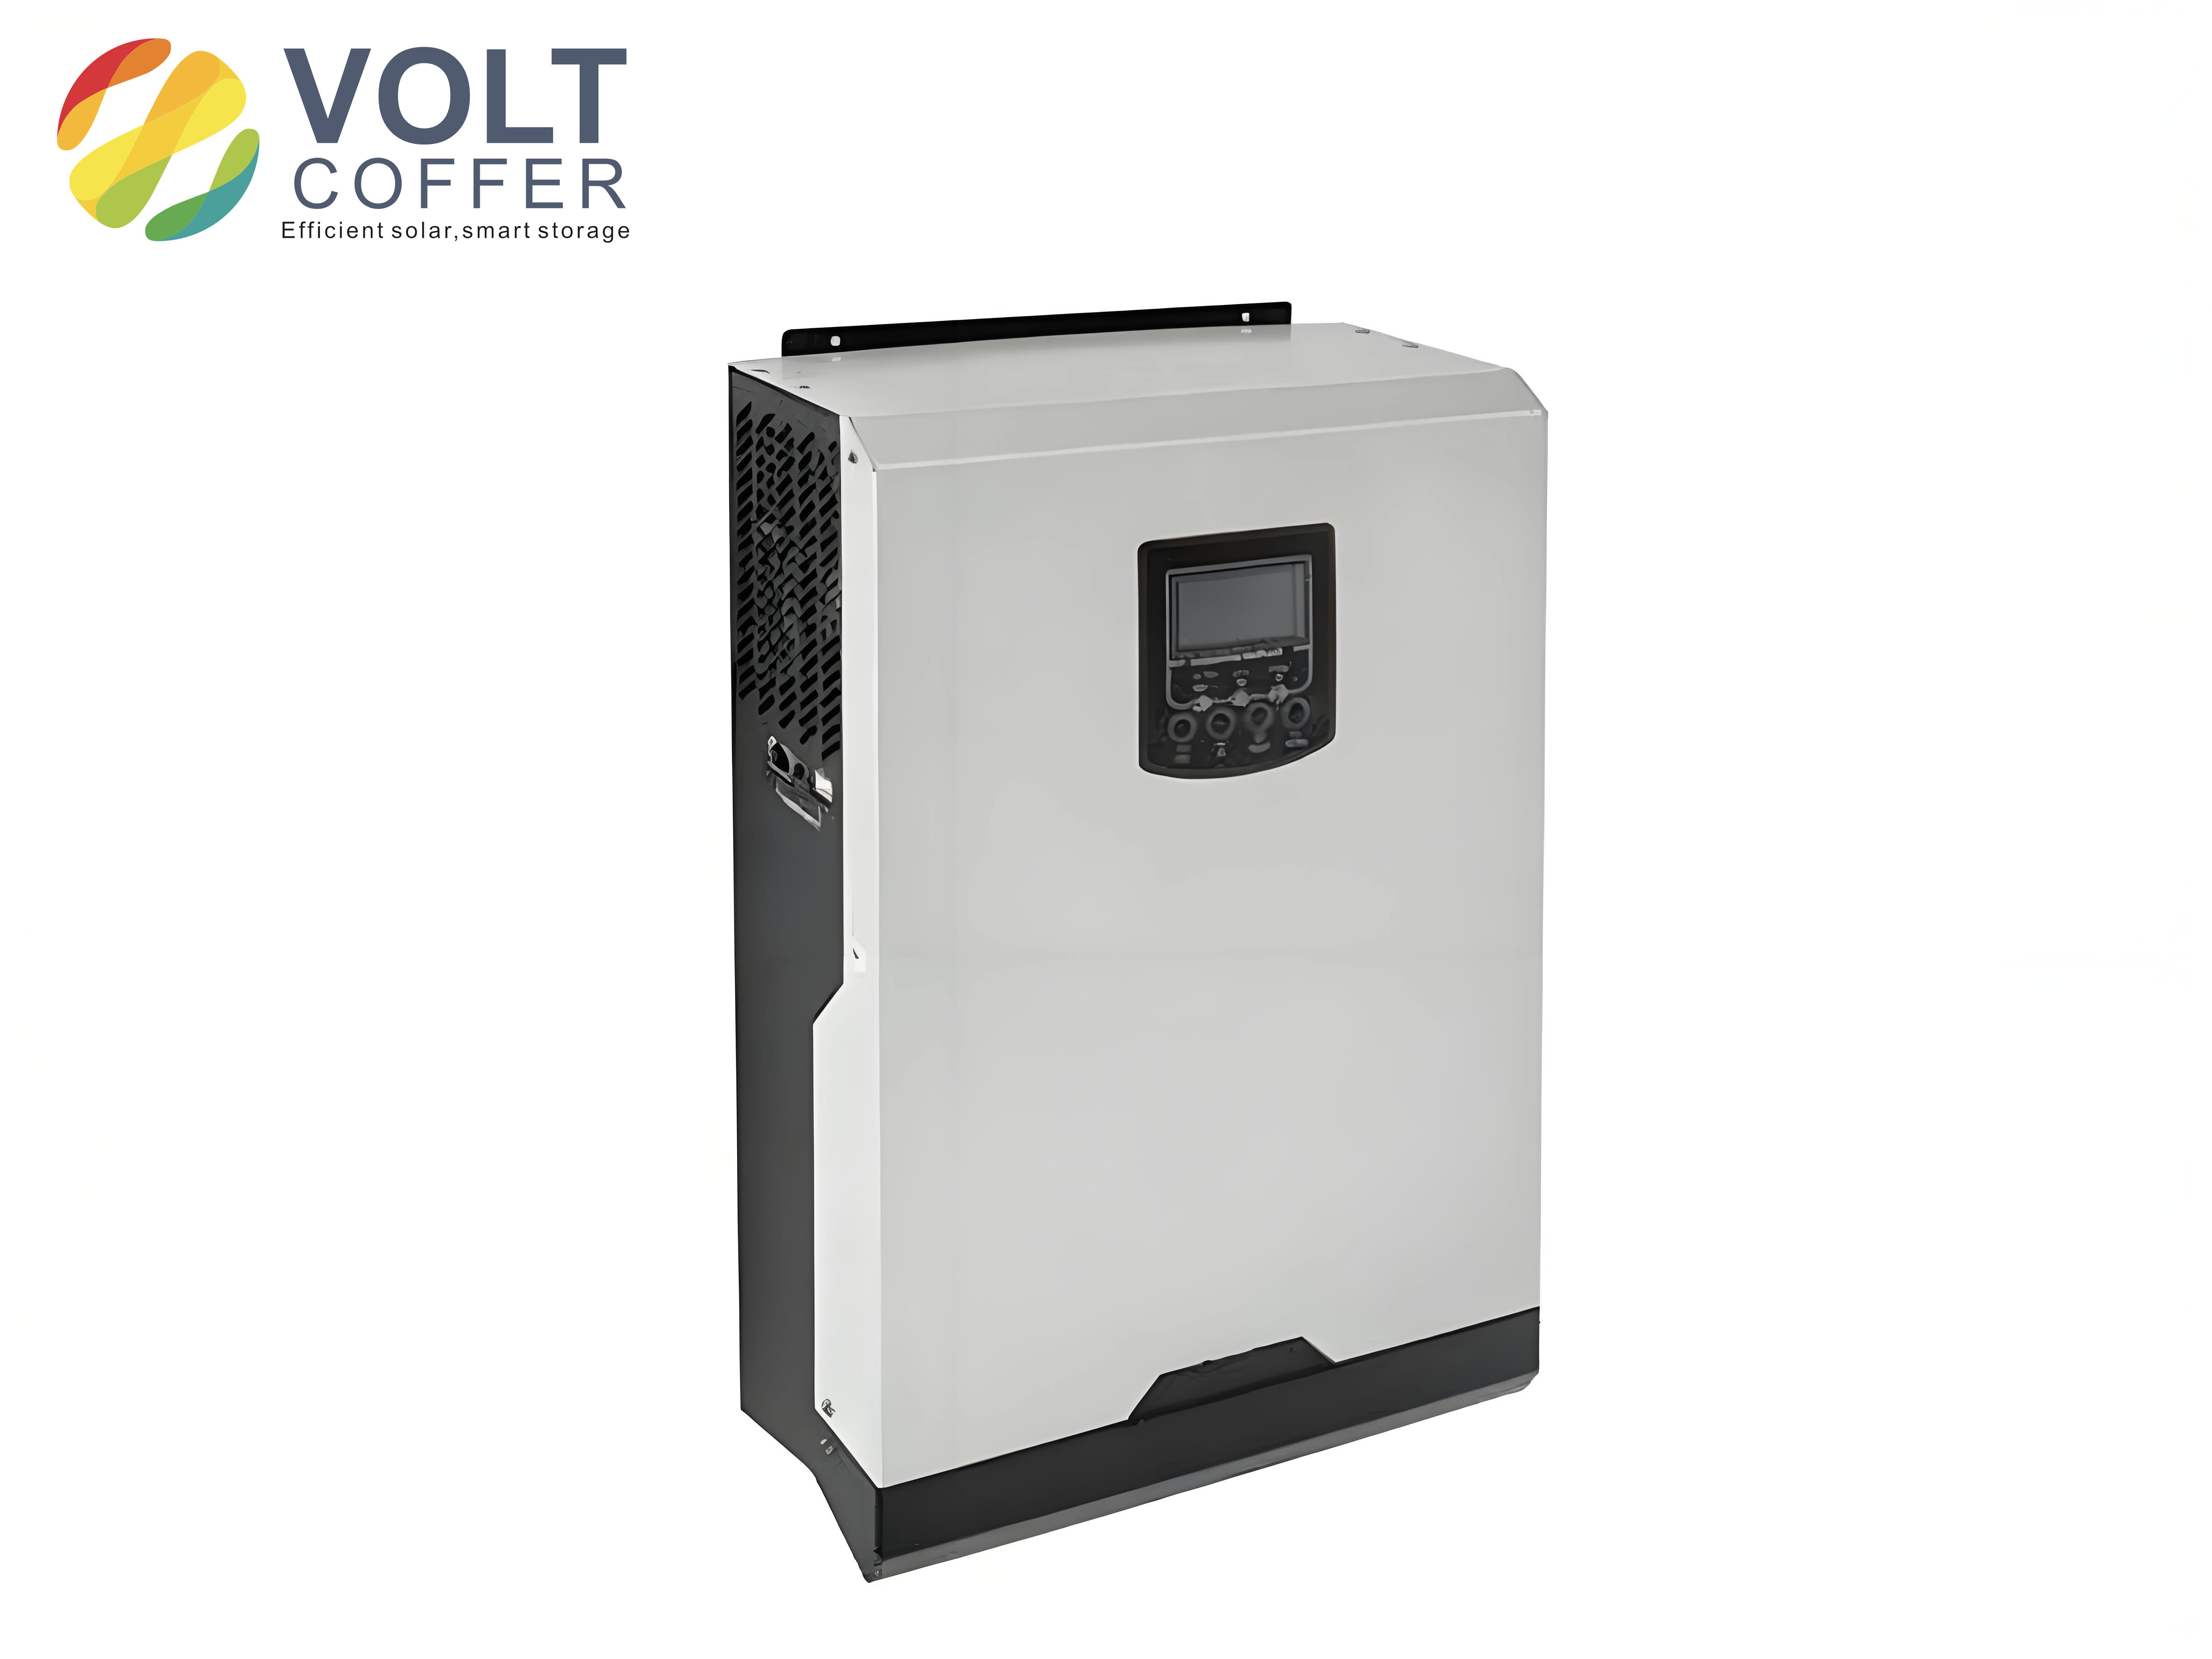
I redesigned the system by replacing the centralized solar inverter with a string configuration. In each 1 MW array, I specified 40 units of 25 kW string solar inverters, five AC combiner boxes, and one box-type transformer. Each string solar inverter feeds its output at 0.48 kV into the AC combiner, which then connects to the 1,000 kVA transformer. The string solar inverters are mounted directly on the PV module support structures, eliminating the need for a dedicated inverter room. The detailed cost breakdown is provided in Table 1.
| Item | Quantity/Value |
|---|---|
| 25 kW string solar inverter | 800 units |
| AC combiner box | 100 units |
| 1,000 kVA transformer (S10-1000/38.5) | 20 units |
| Communication cabinet | 20 units |
| Cables | As required |
| Total cost (million CNY) | 20.294 |
2.2 Simulation Validation Using MATLAB/Simulink
To verify the feasibility and efficiency of the proposed string solar inverter design, I built a grid-connected model in MATLAB/Simulink. The simulation assumed a constant irradiance of 1,000 W/m² and a temperature of 25°C. I analyzed the grid-connected current waveform and harmonic distortion. The total harmonic distortion (THD) of the grid-connected current was 1.68%, well below the 5% threshold, confirming that the design meets grid interconnection standards.
To evaluate dynamic performance, I introduced variations: at t = 1.2 s, irradiance dropped from 1,000 to 700 W/m²; at t = 2.0 s, it returned to 1,000 W/m²; at t = 2.5 s, temperature decreased from 25°C to 5°C. The simulation results (not pictured as per instruction) showed that the PV array output power and grid current responded rapidly to these changes. The string solar inverter successfully tracked the maximum power point (MPPT) under varying conditions, demonstrating superior performance compared to the centralized approach. The MPPT algorithm used in the simulation is based on the perturb-and-observe (P&O) method, whose mathematical formulation is:
$$ P_{pv}(t) = V_{pv}(t) \cdot I_{pv}(t) $$
$$ \Delta P = P_{pv}(t) – P_{pv}(t- \Delta t) $$
$$ \Delta V = V_{pv}(t) – V_{pv}(t- \Delta t) $$
$$ \text{if } \Delta P > 0 \text{ then } V_{ref} = V_{ref} + \text{step} \cdot \text{sign}(\Delta V) $$
$$ \text{else } V_{ref} = V_{ref} – \text{step} \cdot \text{sign}(\Delta V) $$
where \( P_{pv} \) is the PV power, \( V_{pv} \) is the PV voltage, and \( I_{pv} \) is the PV current. The string solar inverter’s ability to perform per-string MPPT yields a significant improvement in energy harvest under partial shading conditions. The theoretical energy gain can be expressed as:
$$ E_{gain} = \int_{0}^{T} \left[ P_{string}(t) – P_{central}(t) \right] dt $$
where \( P_{string} \) and \( P_{central} \) are the instantaneous powers obtained with string and centralized solar inverters, respectively. Simulation results indicated that the string solar inverter consistently maintained operation near the maximum power point, unlike the centralized design which suffers from mismatch losses.
3. Practical Implementation and Green Benefit Analysis
In October 2023, I oversaw the retrofit of the solar inverter system from centralized to string configuration. After one year of trial operation, the system performed reliably with no component failures, and the grid-connected harmonic distortion remained within acceptable limits. I collected monthly energy production data for the year before and after the retrofit, as summarized in Table 2.
| Month | Before Retrofit (Centralized) | After Retrofit (String) |
|---|---|---|
| Jan | 120.3 | 131.5 |
| Feb | 125.6 | 137.2 |
| Mar | 148.9 | 162.8 |
| Apr | 165.2 | 180.1 |
| May | 178.4 | 194.6 |
| Jun | 182.1 | 198.5 |
| Jul | 190.5 | 207.3 |
| Aug | 188.7 | 205.9 |
| Sep | 165.3 | 180.7 |
| Oct | 140.8 | 153.2 |
| Nov | 118.9 | 129.5 |
| Dec | 104.6 | 114.6 |
| Annual Total | 1,729.3 | 1,880.9 |
The annual generation increased by 151.6 × 10⁴ kWh, representing an 8.77% improvement. Assuming a solar inverter lifetime of 25 years, the total additional energy over the lifecycle is:
$$ \Delta E_{life} = 151.6 \times 10^4 \text{ kWh/year} \times 25 \text{ years} = 3,790 \times 10^4 \text{ kWh} $$
With a local electricity price of 0.52 CNY/kWh, the direct revenue increase amounts to:
$$ R_{electricity} = 3,790 \times 10^4 \text{ kWh} \times 0.52 \text{ CNY/kWh} = 1,970.8 \times 10^4 \text{ CNY} $$
The retrofit cost was 2,029.4 × 10⁴ CNY. However, the original 500 kW centralized solar inverters, combiner boxes, and related equipment were sold for approximately 500 × 10⁴ CNY. Hence, the net lifecycle economic benefit is:
$$ B_{net} = 1,970.8 \times 10^4 – 2,029.4 \times 10^4 + 500 \times 10^4 = 441.4 \times 10^4 \text{ CNY} $$
Beyond direct economic returns, the enhanced solar inverter design yields substantial environmental benefits. Using the grid emission factor of 0.581 kg CO₂/kWh, the total CO₂ reduction over 25 years is:
$$ \Delta CO_2 = 3,790 \times 10^4 \text{ kWh} \times 0.581 \text{ kg/kWh} = 2,201,990 \text{ kg} \approx 2.20 \times 10^4 \text{ tons} $$
At a carbon market price of 70 CNY/ton, the carbon trading value is:
$$ V_{CO_2} = 2.20 \times 10^4 \text{ tons} \times 70 \text{ CNY/ton} = 154.1 \times 10^4 \text{ CNY} $$
Additionally, I estimated the reduction in conventional pollutants based on typical coal-fired power plant emission factors: SO₂ = 0.26 g/kWh, NOₓ = 0.29 g/kWh, and dust = 0.08 g/kWh. The lifecycle reductions are:
| Pollutant | Emission Factor (g/kWh) | Total Reduction (tons) | Monetized Value (CNY × 10⁴) |
|---|---|---|---|
| SO₂ | 0.26 | 9.85 | 32.0 |
| NOₓ | 0.29 | 10.99 | |
| Dust | 0.08 | 3.03 |
The total green benefit (carbon + pollutants) amounts to:
$$ G_{total} = 154.1 \times 10^4 + 32.0 \times 10^4 = 186.1 \times 10^4 \text{ CNY} $$
Thus, the overall lifecycle benefit of the solar inverter upgrade is:
$$ B_{total} = 441.4 \times 10^4 + 186.1 \times 10^4 = 627.5 \times 10^4 \text{ CNY} $$
These figures underscore the economic and environmental superiority of the string solar inverter configuration.
4. Further Technical Considerations for Solar Inverter Optimization
4.1 Comparative Analysis of Inverter Topologies
To justify the selection of string solar inverter over alternatives, I compiled a comparative table of key performance indicators.
| Parameter | Centralized | String | Micro-inverter |
|---|---|---|---|
| Power range | >100 kW | 1–100 kW | < 1 kW |
| MPPT granularity | Array-level | String-level | Panel-level |
| Partial shading tolerance | Low | High | Very high |
| Efficiency (peak) | 96–98% | 97–99% | 95–97% |
| Installation complexity | High (requires inverter room) | Low (mount on rack) | Very low |
| Maintenance cost | Moderate | Low | High (per unit replacement) |
| Harmonic distortion (THD) | < 5% | < 3% | < 2% |
| Lifetime (years) | 15–20 | 20–25 | 15–25 |
| Cost per kW (CNY/kW) | 200–300 | 400–600 | 1000–1500 |
From Table 4, the string solar inverter offers a balanced trade-off between cost, efficiency, and shading tolerance, making it the optimal choice for the mountainous site I studied.
4.2 Mathematical Modeling of Inverter Losses
I further developed a loss model for the solar inverter to quantify efficiency improvements. The total power loss in a solar inverter can be expressed as:
$$ P_{loss} = P_{switching} + P_{conduction} + P_{core} + P_{aux} $$
where:
- \( P_{switching} = f_{sw} \cdot (E_{on} + E_{off}) \cdot \frac{V_{dc}}{V_{ref}} \cdot \frac{I_{c}}{I_{ref}} \)
- \( P_{conduction} = I_{c}^{2} \cdot R_{ds(on)} \cdot D \)
- \( P_{core} = k \cdot f_{sw}^{\alpha} \cdot B^{\beta} \cdot V_{core} \)
- \( P_{aux} \) includes control, cooling, and standby losses.
For the 25 kW string solar inverter, typical switching frequency is 16 kHz, and IGBT modules are used. The efficiency curve can be approximated by:
$$ \eta = \frac{P_{out}}{P_{out} + P_{loss}} = \frac{P_{dc} \cdot (1 – s)}{P_{dc} \cdot (1 – s) + P_{loss}} $$
where \( s \) is the slip factor for transformerless topologies (negligible). Simulation indicated that the string solar inverter maintains >98% efficiency across a wide load range (30%–100%).
4.3 MPPT Algorithm Enhancement
To further optimize the string solar inverter performance, I implemented an adaptive P&O MPPT algorithm with variable step size. The step size is adjusted based on the derivative of power:
$$ \text{step}(k) = \text{step}_{max} \cdot \frac{|\Delta P / \Delta V|}{|\Delta P / \Delta V|_{max}} $$
This approach reduces oscillations at steady state while maintaining fast tracking during transients. The algorithm’s performance was validated in simulation, showing a 0.3% improvement in energy capture compared to fixed-step P&O.
5. Long-Term Performance Monitoring and Economic Indicators
After the first year of operation, I continued monitoring the string solar inverter system for an additional year to confirm stability. Key performance indicators are summarized in Table 5.
| Year | Annual Generation (10⁴ kWh) | Capacity Factor (%) | Inverter Availability (%) | THD (%) |
|---|---|---|---|---|
| Year 1 (post-retrofit) | 1,880.9 | 21.5 | 99.2 | 1.7 |
| Year 2 | 1,892.3 | 21.6 | 99.5 | 1.6 |
The slight increase in Year 2 can be attributed to normal irradiance variation. The high availability demonstrates the reliability of the string solar inverter.
5.1 Sensitivity Analysis of Economic Benefits
I performed sensitivity analysis on key parameters affecting lifecycle benefit. The net present value (NPV) of the solar inverter upgrade is calculated as:
$$ NPV = -C_0 + \sum_{t=1}^{25} \frac{(R_t – O_t)}{(1 + r)^t} $$
where \( C_0 \) is the net retrofit cost (2,029.4 – 500 = 1,529.4 × 10⁴ CNY), \( R_t \) is annual revenue from extra generation (1970.8/25 ≈ 78.83 × 10⁴ CNY), \( O_t \) is additional O&M cost (assumed negligible), and \( r \) is the discount rate (8%). Table 6 shows NPV under different scenarios.
| Discount Rate | Electricity Price 0.48 CNY/kWh | 0.52 CNY/kWh | 0.56 CNY/kWh |
|---|---|---|---|
| 6% | 702.3 | 851.6 | 1,000.9 |
| 8% | 511.5 | 627.5 | 743.5 |
| 10% | 359.4 | 445.8 | 532.2 |
The NPV remains positive across all reasonable scenarios, confirming the robustness of the string solar inverter investment.
5.2 Carbon Footprint Reduction Calculation
I also computed the levelized cost of carbon abatement (LCCA) for the solar inverter upgrade:
$$ LCCA = \frac{\text{Incremental cost}}{\text{Incremental CO}_2 \text{ reduction}} = \frac{1,529.4 \times 10^4 \text{ CNY}}{2.20 \times 10^4 \text{ tons}} \approx 69.5 \text{ CNY/ton} $$
This is comparable to current carbon market prices, indicating the project’s cost-effectiveness for emission reduction.
6. Conclusion and Recommendations
My study demonstrates that replacing a centralized solar inverter with a string solar inverter in a mountainous PV plant yields significant economic and environmental benefits. The key findings are:
- The string solar inverter design improves annual energy yield by 8.77% due to better MPPT and reduced mismatch losses.
- Over a 25-year lifecycle, the net economic benefit (including equipment resale) is 441.4 × 10⁴ CNY.
- Green benefits, including carbon emission reduction and pollutant avoidance, amount to 186.1 × 10⁴ CNY, leading to a total benefit of 627.5 × 10⁴ CNY.
- The string solar inverter also reduces CO₂ by 2.20 × 10⁴ tons, SO₂ by 9.85 tons, NOₓ by 10.99 tons, and dust by 3.03 tons.
- Simulation and field operation confirm that the string solar inverter meets grid requirements with THD below 2% and high reliability.
I recommend that future solar power plant designs in similar terrains prioritize string solar inverters to maximize both profitability and environmental sustainability. Furthermore, continued research into advanced MPPT algorithms and wide-bandgap semiconductors can further enhance string solar inverter performance. The successful implementation of this project provides a replicable model for achieving carbon neutrality in the power sector.