
As urban rail transit networks expand rapidly, the energy consumption of metro systems has become a significant concern. To promote green transformation and reduce electricity costs, the utilization of regenerative braking energy and the integration of renewable energy sources such as photovoltaic (PV) systems have drawn considerable attention. In this study, we investigate the challenges arising from the connection of a PV system to a metro traction power supply system, particularly the voltage fluctuations on the DC traction bus and the risk of overcharging or over-discharging of energy storage devices. To address these issues, we propose an innovative “onboard-ground” energy storage system (ESS) combined with a dynamic voltage threshold control strategy based on a fuzzy inference system. The membership functions of the fuzzy system are optimized using a genetic algorithm to enhance energy utilization efficiency. Extensive simulations are conducted to validate the effectiveness of the proposed strategy. Our results demonstrate that the proposed approach can effectively maintain the state of charge (SOC) of the energy storage devices within a safe range, increase the amount of energy recovered and released, and stabilize the DC traction bus voltage. Compared with fixed-threshold control and other optimization algorithms, our method yields superior performance in energy management.
In the following sections, we first describe the system architecture including the PV integration scheme for different operational periods. Then we present the dynamic voltage threshold control strategy based on fuzzy logic and genetic algorithm optimization. Simulation results and comparisons are provided afterwards, followed by a conclusion.
1. System Architecture of the Metro Onboard-Ground Energy Storage System with PV Integration
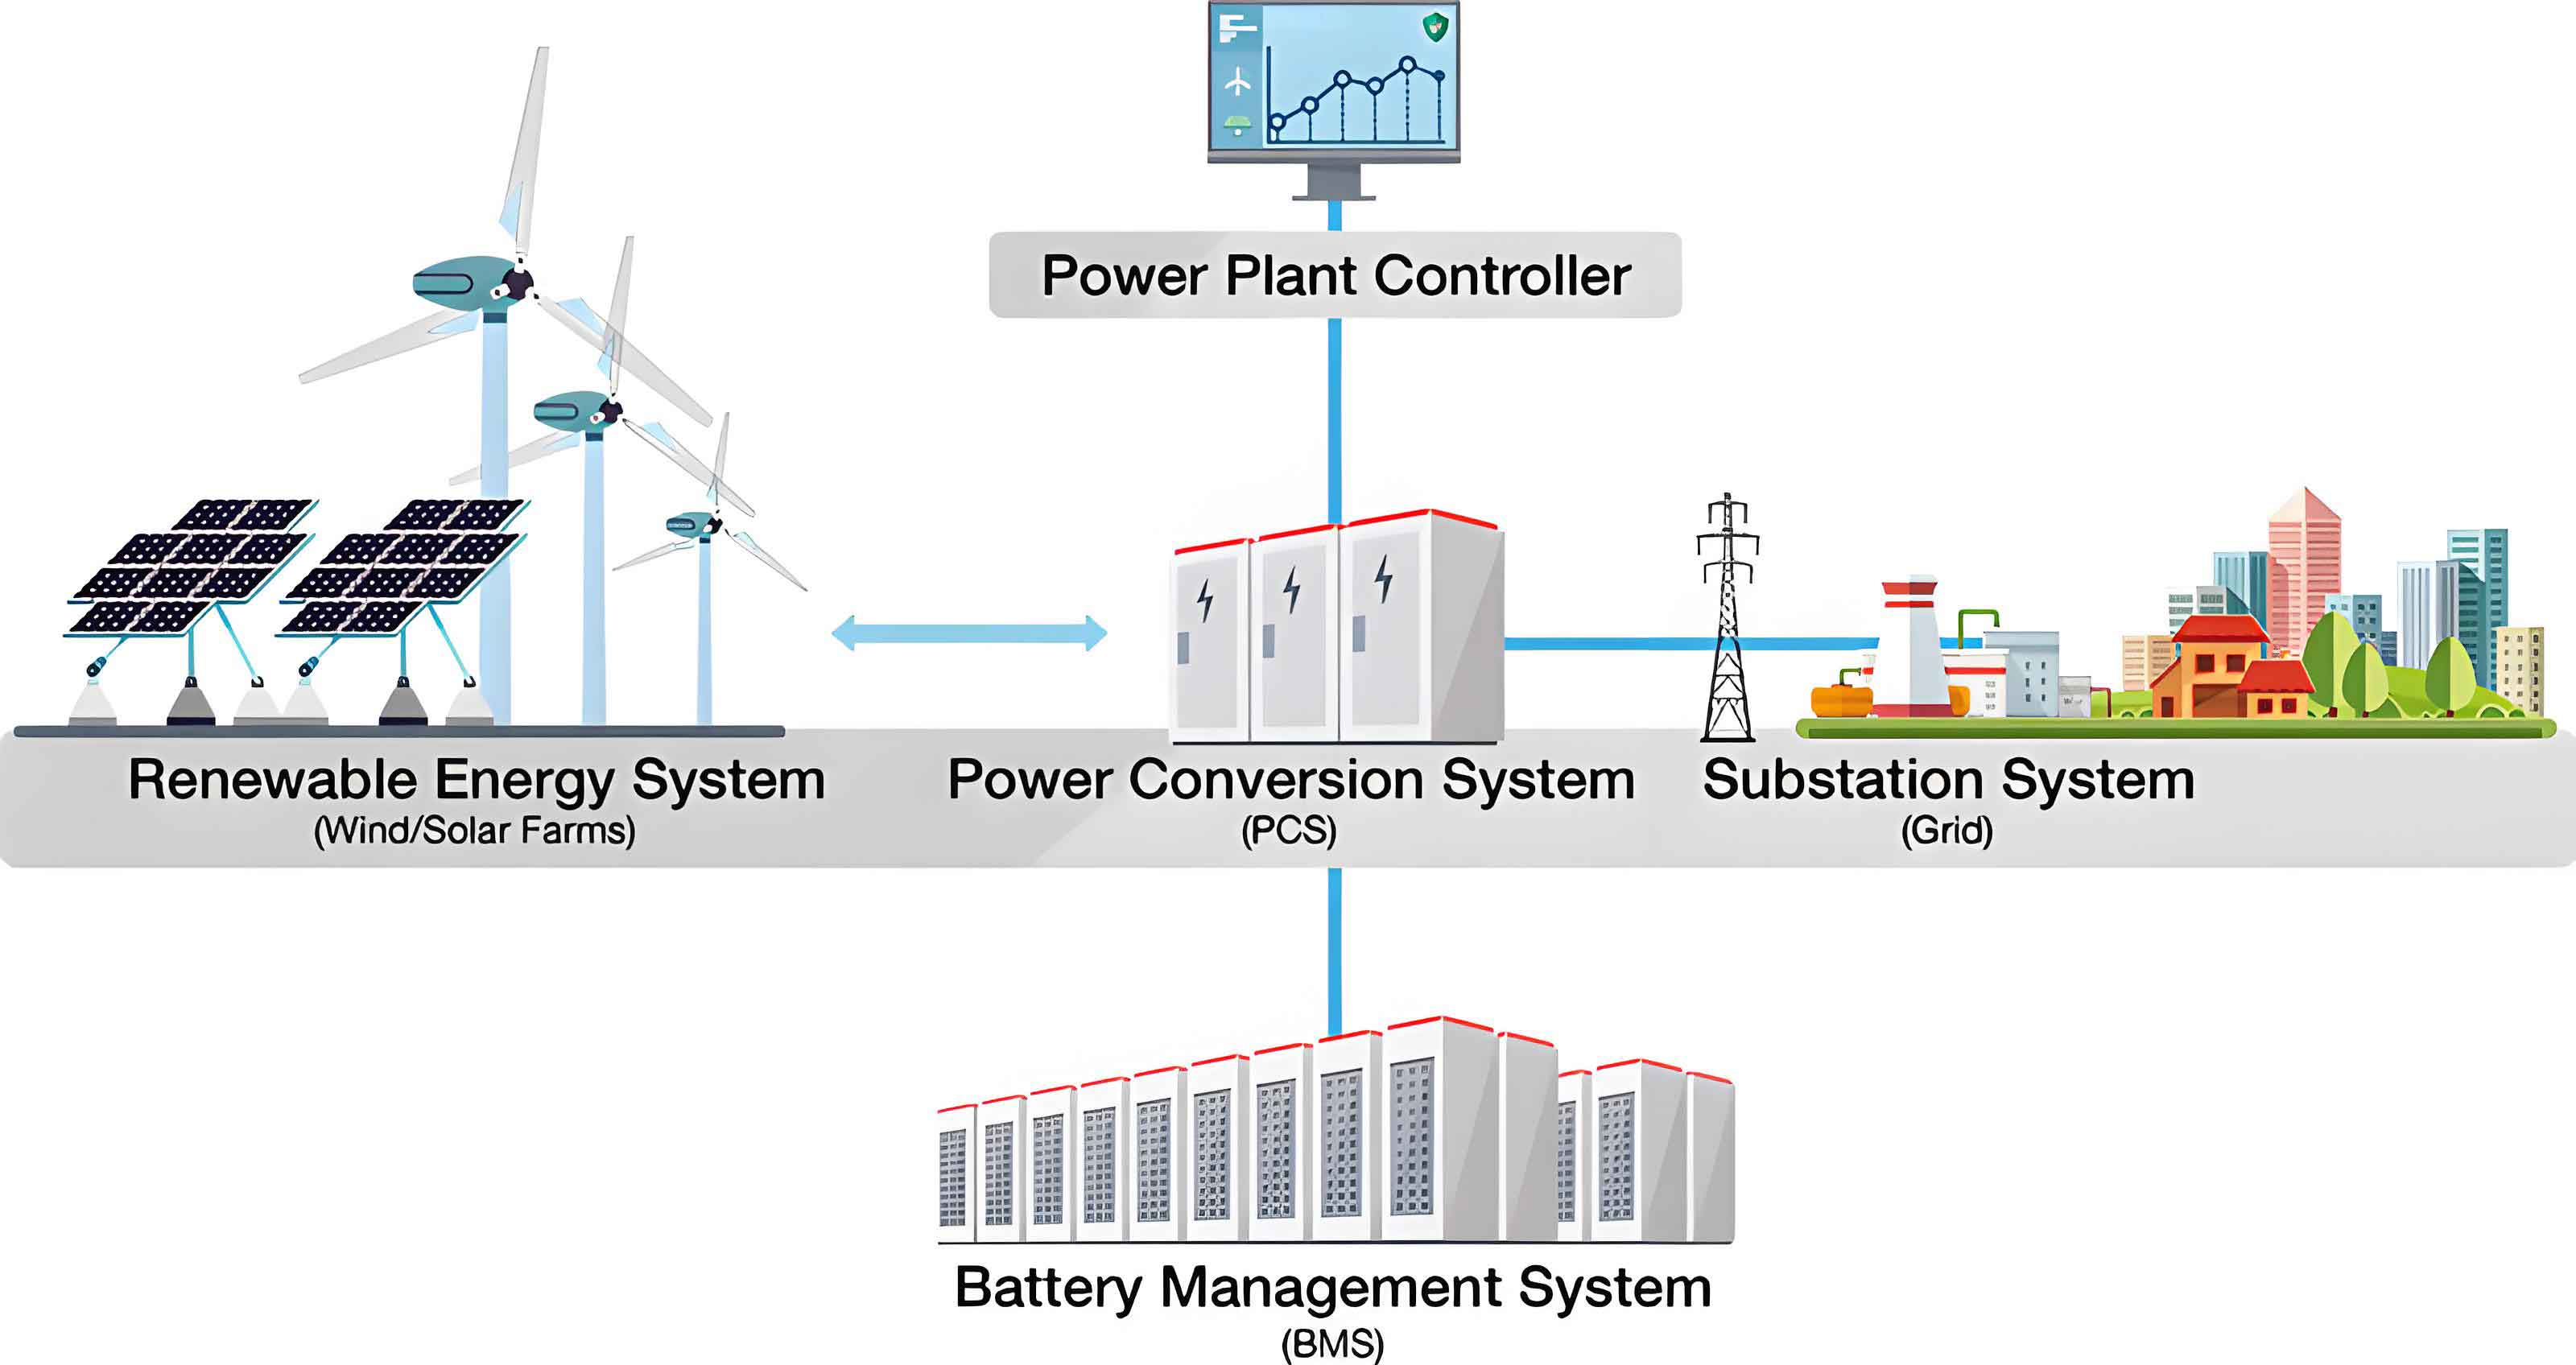
The structure of the proposed system is illustrated conceptually. The system consists of a traction power supply system, metro trains, an onboard energy storage system (ESS), a ground ESS, and a PV generation system. The 35 kV medium-voltage distribution network is stepped down and rectified by a 24-pulse rectifier to provide 1500 V DC power. Trains draw power from the DC traction bus during traction and feed regenerative braking energy back to the bus. The onboard ESS employs supercapacitors as the storage medium due to their high power density, making them suitable for frequent charge/discharge cycles and limited installation space. The ground ESS uses lithium-ion batteries for high energy density to store a larger amount of energy, including both regenerative braking energy and PV generation. The PV system is connected via a boost converter with maximum power point tracking (MPPT) control.
To mitigate voltage fluctuations caused by the PV system, we design a time-dependent connection scheme for the PV array based on metro operation intervals. The operation time is divided into peak hours (6:00-9:00 and 17:00-19:00) and off-peak hours (9:00-17:00). During peak hours, the number of trains on the same line is large, leading to frequent voltage oscillations. The PV system output is also more variable due to changing sunlight and temperature. Therefore, we connect the PV system to the ground ESS (point ①) rather than directly to the DC bus, so that the PV energy is stored in the ground batteries and released when demanded by trains. During off-peak hours, fewer trains operate, the DC bus voltage fluctuations are less frequent but the magnitude increases, and the PV output is relatively stable. In this period, we connect the PV system directly to the DC traction bus (point ②) to reduce transmission losses and lower the energy supplied by the substation.
The energy balance equations for different periods are as follows. For peak hours:
\[
E_{tr} = E_{sub} + E_{ess\_out} + E_{from\_train}
\]
\[
E_{re} = E_{use\_train} + E_{ess\_in} + E_{f\_DC}
\]
where \(E_{tr}\) is the energy demand during train traction, \(E_{re}\) is the regenerative braking energy generated, \(E_{sub}\) is the energy from the substation, \(E_{f\_DC}\) is the energy fed back to the DC bus, \(E_{ess\_out}\) and \(E_{ess\_in}\) are the energy released and absorbed by the ESS, and \(E_{from\_train}\) and \(E_{use\_train}\) represent the energy exchanged among trains on the same line:
\[
E_{use\_train} = n \times E_{use\_singletrain}
\]
\[
E_{from\_train} = n \times E_{from\_singletrain}
\]
with \(n\) being the number of trains in the same section.
The energy variation of the onboard ESS (\(\Delta E_t\)) and ground ESS (\(\Delta E_g\)) during peak hours is given by:
\[
\Delta E_t =
\begin{cases}
0, & \text{if } SOC_t > SOC_{t\_max} \text{ or } SOC_t < SOC_{t\_min} \\
-(E_{tr} – E_t), & E_{tr} > 0 \\
-E_{tr} – E_t, & E_{tr} < 0
\end{cases}
\]
\[
\Delta E_g =
\begin{cases}
0, & \text{if } SOC_g > SOC_{g\_max} \text{ or } SOC_g < SOC_{g\_min} \text{ or } (E_{tr} > 0 \text{ and } \Delta E_t < 0) \\
-(E_{tr} – E_g), & E_{tr} > 0 \text{ or } \Delta E_t = 0 \\
-E_{tr} – E_g + E_{PV}, & E_{tr} < 0 \text{ and } \Delta E_t = 0
\end{cases}
\]
For off-peak hours:
\[
\Delta E_t =
\begin{cases}
0, & \text{if } SOC_t > SOC_{t\_max} \text{ or } SOC_t < SOC_{t\_min} \\
-(E_{tr} – E_t), & E_{tr} > 0 \\
-E_{tr} + E_{PV} – E_t, & E_{tr} < 0
\end{cases}
\]
\[
\Delta E_g =
\begin{cases}
0, & \text{if } SOC_g > SOC_{g\_max} \text{ or } SOC_g < SOC_{g\_min} \text{ or } (E_{tr} > 0 \text{ and } \Delta E_t < 0) \text{ or } (E_{tr} < 0 \text{ and } \Delta E_t > 0) \\
-(E_{tr} – E_g), & E_{tr} > 0 \text{ and } \Delta E_t = 0 \\
-E_{tr} – E_g, & E_{tr} < 0 \text{ and } \Delta E_t = 0
\end{cases}
\]
Here \(SOC_t\) and \(SOC_g\) denote the SOC of onboard and ground ESS, respectively, with upper and lower limits \(SOC_{t\_max}, SOC_{t\_min}, SOC_{g\_max}, SOC_{g\_min}\). The signs of \(\Delta E\) indicate charging (positive) or discharging (negative). This analysis supports the priority rules: during peak hours, the ground ESS discharges first while the onboard ESS charges first; during off-peak hours, the onboard ESS discharges first and the ground ESS charges first.
2. Dynamic Voltage Threshold Control Strategy Based on Fuzzy Inference
The relationship between the SOC of an energy storage device and its charge/discharge voltage thresholds is complex and nonlinear. Traditional fixed-threshold control often leads to inefficient energy utilization or SOC violations. To overcome this, we design a Mamdani-type fuzzy inference system (FIS) that dynamically adjusts the voltage thresholds based on real-time SOC of both onboard and ground ESS. The inputs are \(SOC_t\) and \(SOC_g\), each defined over the interval \([0.2, 0.8]\) with three fuzzy subsets: {S (Small), M (Medium), B (Big)}. The outputs are the discharge voltage thresholds \(U_{dis\_t}, U_{dis\_g}\) and charge voltage thresholds \(U_{char\_t}, U_{char\_g}\). The discharge threshold universe is \([1.0, 1.5]\) kV (representing 1000–1500 V) with fuzzy subsets {SS, S, M, B}. The charge threshold universe is \([1.5, 2.0]\) kV (1500–2000 V) with subsets {S, M, B, O}, where “O” denotes “no charging”.
The fuzzy rules are established according to the priority schemes derived earlier. For peak hours:
| Input SOC_t | Input SOC_g | Udis_t | Udis_g | Uchar_t | Uchar_g |
|---|---|---|---|---|---|
| S | S | SS | S | S | M |
| S | M | SS | M | S | B |
| S | B | SS | B | S | O |
| M | S | M | S | M | S |
| M | M | S | B | M | B |
| M | B | M | B | M | O |
| B | S | B | S | O | S |
| B | M | B | M | B | M |
| B | B | M | B | B | O |
For off-peak hours:
| Input SOC_t | Input SOC_g | Udis_t | Udis_g | Uchar_t | Uchar_g |
|---|---|---|---|---|---|
| S | S | S | SS | S | M |
| S | M | M | S | S | B |
| S | B | S | B | S | O |
| M | S | B | S | M | S |
| M | M | B | M | B | M |
| M | B | M | B | M | B |
| B | S | B | SS | O | S |
| B | M | B | S | O | M |
| B | B | B | M | O | B |
To improve the performance, we optimize the membership function parameters using a genetic algorithm (GA). Gaussian membership functions are employed for both inputs and outputs. The center parameters of these functions significantly affect the FIS output. The objective function for GA is to minimize the difference between the fuzzy system output and the no-load voltage of the DC traction bus, i.e.,
\[
f = U_{DC} – U_{out}
\]
where \(U_{DC}\) is the no-load voltage (1500 V) and \(U_{out}\) is the output voltage threshold. We consider 36 typical input combinations derived from the middle values of each SOC fuzzy subset (low=0.3, medium=0.5, high=0.7) for both \(SOC_t\) and \(SOC_g\). For each combination, the GA searches for the optimal centers of the membership functions. The GA parameters are set as: population size 100, maximum generations 100, crossover probability 0.8, mutation probability 0.8.
The resulting optimized membership functions are then implemented in the dynamic voltage threshold control scheme. The real-time control flow is as follows: sample \(SOC_t\) and \(SOC_g\), determine the current operation period (peak/off-peak), compare the SOC values with the predefined categories, activate the corresponding FIS, and output the voltage thresholds. These thresholds are then fed into a voltage-current dual-loop controller that generates switching signals for the bidirectional DC/DC converters of both onboard and ground ESS.
3. Simulation and Verification
We develop a comprehensive simulation model in Matlab/Simulink to validate the proposed control strategy. The main simulation parameters are listed in Table 3.
| Component | Parameter | Value |
|---|---|---|
| Traction supply | Nominal DC voltage | 1500 V |
| Voltage lower limit | 1000 V | |
| Voltage upper limit | 1800 V | |
| Train | Traction-braking cycle | 4 s |
| Traction period | 0–1.2 s | |
| Regenerative braking period | 2–3.2 s | |
| ESS | SOC upper limit | 80% |
| SOC lower limit | 20% | |
| PV system | Maximum power | 500 kW |
| Peak hour irradiance | 500 W/m² | |
| Off-peak hour irradiance | 1000 W/m² | |
| Peak hour temperature | 20 °C | |
| Off-peak hour temperature | 30 °C |
The onboard supercapacitor capacity is calculated using the energy constraint method. The maximum regenerative braking energy from a single train is about 80.13 MJ over 20.8 s. With a maximum voltage of 1800 V and minimum of 600 V (boost ratio ≤3), the required capacitance is:
\[
C_{SC} = \frac{2E}{U_{max}^2 – U_{min}^2} = \frac{2 \times 80.13 \times 10^6}{1800^2 – 600^2} \approx 49.46 \text{ F} \approx 50 \text{ F}
\]
The ground lithium-ion battery capacity is sized for storing PV energy. With a maximum PV output of 500 kW producing about 4 MJ in the simulation period and a nominal battery voltage of 14 V, the capacity is:
\[
C_{bat} = \frac{E_{bat}}{U_{bat}} = \frac{4 \times 10^6}{14} \approx 79.3 \text{ Ah} \approx 80 \text{ Ah}
\]
3.1 DC Bus Voltage Characteristics With and Without PV
We simulate two trains operating in the same section with headways of 2 s (peak) and 4 s (off-peak). The DC bus voltages are compared in Figure 1 (not shown). Without PV, during peak hours the regenerative braking energy from one train is consumed by the other train starting, resulting in less voltage drop but frequent fluctuations. During off-peak hours, no energy exchange occurs between trains; therefore the bus voltage rises higher during braking. After connecting the PV system, the bus voltage during traction drops less (substations supply less energy). However, during braking the voltage can exceed 1800 V, especially in off-peak hours reaching up to 2000 V, which is beyond the safe limit. This highlights the necessity of an effective energy storage system to absorb the excess energy and stabilize the voltage.
3.2 SOC Control Performance
We compare our dynamic voltage threshold control (DVTC) with a fixed-threshold control (FTC). For FTC, the onboard discharge threshold is 1300 V and charge threshold is 1650 V; the ground discharge threshold is 1200 V and charge threshold is 1700 V. For DVTC, we set the discharge SOC lower limit to 22% and charge SOC upper limit to 79% to avoid deep discharge and overcharge. The simulation results for discharge and charge processes are summarized.
3.2.1 Discharge SOC Control
During peak hours, the ground ESS discharges first. With initial SOC values, the DVTC yields a ground discharge threshold of 1253 V and onboard threshold of 1087 V. The SOC trajectories show that with FTC, the ground SOC drops below 20% (to 19.7%) and the onboard SOC falls to 19.6%, indicating slight over-discharge. With DVTC, both SOCs remain above 20% (20.2% for ground, 21.6% for onboard) and the bus voltage stays above 1050 V. During off-peak hours, the onboard ESS discharges first. DVTC gives onboard threshold 1205 V and ground threshold 1154 V. Again, FTC causes SOC values to drop below 20% (19.7%), while DVTC maintains them at 20.7% (ground) and 20.7% (onboard). The bus voltage is slightly higher under DVTC (above 1100 V compared to 1050 V). The results are compared in Table 4.
| Period | Control | Ground SOC (%) | Onboard SOC (%) | Bus voltage lower bound (V) |
|---|---|---|---|---|
| Peak | FTC | 19.7 | 19.6 | 1050 |
| DVTC | 20.2 | 21.6 | 1050 | |
| Off-peak | FTC | 19.7 | 19.6 | 1050 |
| DVTC | 20.7 | 20.7 | 1100 |
3.2.2 Charge SOC Control
During peak hours, the onboard ESS charges first. With initial SOC near 21%, DVTC outputs onboard charge threshold 1706 V and ground threshold set to “no charge” (O). FTC leads to onboard SOC exceeding 80% (80.2%), while DVTC keeps it at 79.8%. The bus voltage under DVTC remains below 1720 V, whereas FTC reaches near 1700 V but with overcharge. During off-peak hours, the ground ESS charges first. DVTC gives ground threshold 1755 V and onboard threshold 1783 V. FTC causes ground SOC to exceed 80% (81.3%), while DVTC restricts it to 79.6%. The bus voltage with DVTC is lower (below 1750 V) compared to FTC (below 1700 V but with overcharge). Table 5 summarizes the charge SOC control results.
| Period | Control | Ground SOC (%) | Onboard SOC (%) | Bus voltage upper bound (V) |
|---|---|---|---|---|
| Peak | FTC | 79.9 | 80.2 | <1700 |
| DVTC | 79.9 | 79.8 | <1720 | |
| Off-peak | FTC | 79.0 | 81.3 | <1700 |
| DVTC | 79.0 | 79.6 | <1750 |
These results confirm that the dynamic voltage threshold control effectively maintains the SOC within the safe range [20%, 80%] and prevents both over-discharge and overcharge, unlike the fixed-threshold method.
3.3 Energy Utilization Performance
We also evaluate the amount of energy released and absorbed by the ESS under different control strategies. For the energy release test, we set the initial SOC of both ESS to 79% (high). For FTC, onboard discharge threshold 1300 V, ground 1200 V. For DVTC, during peak hours the calculated thresholds are: ground discharge 1317 V, onboard 1265 V; during off-peak: onboard 1306 V, ground 1285 V. The results in Table 6 show that DVTC releases 35 kJ (peak) and 38 kJ (off-peak), compared to 31 kJ for FTC in both periods. The bus voltage during discharge is also higher with DVTC (above 1250 V vs. above 1200 V), indicating better voltage support.
| Period | Control | Released energy (kJ) | Bus voltage min (V) |
|---|---|---|---|
| Peak | FTC | 31 | >1200 |
| DVTC | 35 | >1250 | |
| Off-peak | FTC | 31 | >1200 |
| DVTC | 38 | >1280 |
For the energy absorption test, we set initial SOC to 21% (low). FTC thresholds: onboard charge 1650 V, ground 1700 V. DVTC thresholds: during peak, onboard 1586 V, ground 1682 V; during off-peak, onboard 1592 V, ground 1664 V. Table 7 shows that DVTC absorbs 76 kJ (peak) and 52 kJ (off-peak), while FTC absorbs only 45 kJ and 25 kJ, respectively. The bus voltage peak is also better suppressed with DVTC (below 1650 V vs. below 1700 V).
| Period | Control | Absorbed energy (kJ) | Bus voltage max (V) |
|---|---|---|---|
| Peak | FTC | 45 | <1700 |
| DVTC | 76 | <1650 | |
| Off-peak | FTC | 25 | <1700 |
| DVTC | 52 | <1650 |
These results clearly show that the dynamic voltage threshold control significantly improves the energy utilization of the energy storage system. When the SOC is high, the proposed strategy releases more energy to support the bus voltage; when the SOC is low, it captures more braking and PV energy, reducing voltage rise.
3.4 Comparison of Optimization Algorithms
To further validate the effectiveness of the genetic algorithm (GA) optimization used in the fuzzy inference system, we compare it with particle swarm optimization (PSO) and grey wolf optimization (GWO). All three algorithms are used to optimize the membership function centers under the same conditions. The energy release and absorption performances are evaluated as before, with initial SOC = 79% for release and 21% for absorption. The results are shown in Table 8.
| Period | Control type | Released energy (kJ) | Absorbed energy (kJ) |
|---|---|---|---|
| Peak | PSO-optimized | 26 | 71 |
| GWO-optimized | 29 | 70 | |
| GA-optimized | 35 | 75 | |
| Off-peak | PSO-optimized | 35 | 50 |
| GWO-optimized | 31 | 49 | |
| GA-optimized | 37 | 52 |
The genetic algorithm yields the highest energy release and absorption in both peak and off-peak periods, outperforming the other two algorithms. This demonstrates that GA is more suitable for optimizing the membership functions in our fuzzy inference system, leading to better overall performance of the energy storage system.
4. Conclusion
In this paper, we have addressed the voltage fluctuation and energy storage overcharge/overdischarge issues caused by integrating a photovoltaic system into a metro traction power supply system. We proposed an “onboard-ground” energy storage system configuration with a time-dependent PV connection scheme, along with a dynamic voltage threshold control strategy based on a fuzzy inference system whose membership functions are optimized using a genetic algorithm. The major findings are summarized as follows:
- The proposed onboard-ground energy storage system effectively mitigates DC traction bus voltage variations induced by train traction and braking, keeping the voltage within the safe range (1000–1800 V).
- Compared with fixed-threshold control, the dynamic voltage threshold control maintains the state of charge of both onboard and ground energy storage devices within the normal operating interval (20%–80%), preventing overcharge and overdischarge while enhancing energy recovery and release.
- The genetic algorithm optimization of fuzzy membership functions yields superior energy utilization performance compared to particle swarm optimization and grey wolf optimization, demonstrating higher released and absorbed energy during both peak and off-peak periods.
Our research provides a practical reference for improving the stability and energy efficiency of metro traction power systems with high penetration of renewable energy. Future work will focus on real-time implementation and experimental validation of the proposed control strategy.