
With the rapid expansion of renewable energy sources and the widespread adoption of electric vehicles, the role of energy storage cells in photovoltaic charging stations has become increasingly critical. These systems not only enhance charging efficiency but also stabilize the power grid and facilitate energy balance. In this work, I present a comprehensive evaluation framework specifically designed for energy storage cells within electric vehicle photovoltaic charging stations. The proposed method integrates solar cell modeling, battery performance testing, and fuzzy logic-based assessment to provide a robust decision-making tool for operators and engineers.
The core objective is to address the challenges of assessing the state of charge, state of health, and remaining useful life of energy storage cells. By combining a tandem solar cell model with advanced battery detection techniques and a fuzzy evaluation system, I aim to deliver accurate and reliable evaluations that support optimal charging strategies and system maintenance.
Tandem Solar Cell Model
To improve the efficiency of photovoltaic generation, I first establish a tandem solar cell structure composed of multiple sub-cells with different bandgaps. This configuration allows the top sub-cell to absorb short-wavelength photons while the bottom sub-cell captures the remaining long-wavelength spectrum. The key challenge in such a tandem design is current matching between sub-cells, which directly affects energy conversion efficiency.
Single Solar Cell Configuration
Each individual sub-cell in the tandem structure consists of several layers: a transparent conducting oxide layer (FTO), an electron transport layer (CdS), an absorber layer of Sb₂(S,Se)₃, a hole transport layer, and a metal electrode (Au). The absorber material’s composition, represented by the Se/(S+Se) ratio, determines the bandgap and absorption coefficient. The absorption coefficient α(λ) is given by:
$$
\alpha(E) = A_\alpha \sqrt{h\nu – E_g}
$$
where \(E_g\) is the bandgap energy, \(h\) is Planck’s constant, and \(\nu\) is frequency. Table 1 summarizes the absorption coefficients at key wavelengths for various selenium contents, derived from experimental measurements.
| Wavelength (nm) | Sb₂S₃ | Sb₂(S₀.₈,Se₀.₂)₃ | Sb₂(S₀.₅,Se₀.₅)₃ | Sb₂(S₀.₂,Se₀.₈)₃ | Sb₂Se₃ |
|---|---|---|---|---|---|
| 400 | 2.2×10⁴ | 2.0×10⁴ | 1.7×10⁴ | 1.4×10⁴ | 1.2×10⁴ |
| 600 | 1.5×10⁴ | 1.3×10⁴ | 1.0×10⁴ | 0.8×10⁴ | 0.6×10⁴ |
| 800 | 0.8×10⁴ | 0.6×10⁴ | 0.4×10⁴ | 0.3×10⁴ | 0.2×10⁴ |
| 1000 | 0.3×10⁴ | 0.2×10⁴ | 0.1×10⁴ | 0.05×10⁴ | 0.02×10⁴ |
Tandem Structure Modeling
For the tandem device, the top sub-cell is illuminated by the standard AM 1.5G spectrum, while the bottom sub-cell receives only the filtered light transmitted through the top. The transmission spectrum T(λ) reaching the bottom cell is expressed as:
$$
T(\lambda) = T_0(\lambda) \exp\left( -\sum_{k=1}^{n} \alpha_k(\lambda) t_k \right)
$$
where \(n\) is the total number of layers in the top sub-cell (TCO, ETL, AL, HTL), \(t_k\) is the thickness of layer \(k\), and \(\alpha_k(\lambda)\) is its absorption coefficient. The bandgap of Sb₂(S₁₋ₓ,Seₓ)₃ varies linearly with selenium concentration x, decreasing from 1.7 eV (x=0) to 1.2 eV (x=1). Table 2 illustrates the relationship between the Se/(S+Se) ratio and the resulting conduction band minimum (CBM) and valence band maximum (VBM) energy levels.
| Se/(S+Se) Ratio | Bandgap (eV) | CBM (eV) | VBM (eV) |
|---|---|---|---|
| 0.0 | 1.70 | -4.0 | -5.7 |
| 0.2 | 1.65 | -3.95 | -5.6 |
| 0.4 | 1.55 | -3.85 | -5.4 |
| 0.6 | 1.45 | -3.75 | -5.2 |
| 0.8 | 1.30 | -3.60 | -4.9 |
| 1.0 | 1.20 | -3.50 | -4.7 |
This model forms the foundation for estimating the energy input to the energy storage cells from the photovoltaic array. Accurate solar generation prediction is essential for evaluating the charging and discharging behavior of energy storage cells in the system.
Performance Testing of Energy Storage Cells in Charging Stations
The evaluation of energy storage cells requires a thorough analysis of three critical parameters: state of charge (SOC), state of health (SOH), and remaining useful life (RUL). I have developed systematic approaches for each of these metrics, leveraging both model-based and data-driven techniques.
State of Charge Estimation
SOC represents the remaining capacity relative to the rated capacity of the energy storage cell:
$$
\text{SOC} = \frac{Q_{\text{remain}}}{Q_{\text{rated}}} \times 100\%
$$
Traditional current integration methods suffer from cumulative errors due to internal resistance and aging effects. To overcome this, I employ a Kalman filter algorithm that uses the error between the actual SOC value and the estimated value as feedback to correct the estimation in real time. Figure 3 in the original study (now represented as the relationship in Table 3) shows the daily capacity loss of energy storage cells as a function of SOC at different temperatures.
| SOC (%) | 10 °C | 20 °C | 30 °C | 40 °C |
|---|---|---|---|---|
| 20 | 0.05 | 0.10 | 0.20 | 0.35 |
| 40 | 0.08 | 0.16 | 0.30 | 0.50 |
| 60 | 0.12 | 0.22 | 0.40 | 0.65 |
| 80 | 0.15 | 0.28 | 0.50 | 0.80 |
| 100 | 0.18 | 0.32 | 0.55 | 0.85 |
The data clearly indicate that higher temperatures accelerate capacity loss for energy storage cells, particularly at high SOC levels. This insight is crucial for thermal management strategies in the charging station.
State of Health Estimation
SOH quantifies the degradation of the energy storage cell relative to its initial state. It is defined as:
$$
\text{SOH} = \frac{C – C_{\text{EOL}}}{C_{\text{BOL}} – C_{\text{EOL}}} \times 100\%
$$
where \(C_{\text{BOL}}\) is the capacity of a new energy storage cell, \(C_{\text{EOL}}\) is the capacity at end-of-life, and \(C\) is the current measured capacity. I adopt a voltage curve fitting method to estimate SOH, which does not require intrinsic battery parameters. Table 4 presents the degradation of energy storage cells over a five-year period, considering both cycle degradation and calendar aging.
| Time (years) | Cycle Degradation (%) | Calendar Aging (%) | Total Aging (%) |
|---|---|---|---|
| 0 | 100 | 100 | 100 |
| 0.5 | 98 | 97 | 95 |
| 1.0 | 95 | 94 | 89 |
| 1.5 | 92 | 91 | 84 |
| 2.0 | 88 | 87 | 77 |
| 2.5 | 84 | 83 | 70 |
| 3.0 | 79 | 78 | 62 |
| 3.5 | 73 | 72 | 53 |
| 4.0 | 66 | 65 | 43 |
| 4.5 | 58 | 57 | 33 |
| 5.0 | 50 | 49 | 24 |
It is evident that the health of energy storage cells declines faster during summer months due to higher ambient temperatures. This finding emphasizes the need for adaptive charging protocols that consider seasonal variations.
Remaining Useful Life Prediction
Predicting the RUL of energy storage cells is essential for proactive maintenance. I employ a data-driven approach that uses historical operational data—such as cycle count, charge/discharge capacity, temperature, and time—to train a predictive model. The model does not require detailed knowledge of internal electrochemical processes but depends heavily on data quality. The RUL prediction is a long-term estimation that combines degradation state recognition and performance forecasting. Table 5 lists typical input features used in the prediction model.
| Feature | Unit | Description |
|---|---|---|
| Cycle Number | – | Number of completed charge-discharge cycles |
| Charge Capacity | Ah | Measured charge capacity per cycle |
| Discharge Capacity | Ah | Measured discharge capacity per cycle |
| Temperature | °C | Average cell temperature during operation |
| Average SOC | % | Average state of charge over the cycle |
| Depth of Discharge | % | Maximum DOD in the cycle |
The predicted RUL should be treated as a reference only, as actual lifespan can be influenced by unforeseen factors such as extreme weather events or grid disturbances.
Data Monitoring for Energy Storage Cells
In a networked electric vehicle system, energy storage cells undergo frequent charge/discharge cycles, which can lead to anomalies such as temperature exceeding thresholds, electrolyte failure, or SOC calculation errors. To mitigate these risks, I implement a battery monitoring module that continuously tracks key indicators. A median-expectation-based prediction method estimates internal changes and current variations in the battery pack, allowing the battery management system controller to adjust charging current in real time. The monitoring process is illustrated in Figure 6 (represented here as a conceptual flowchart).
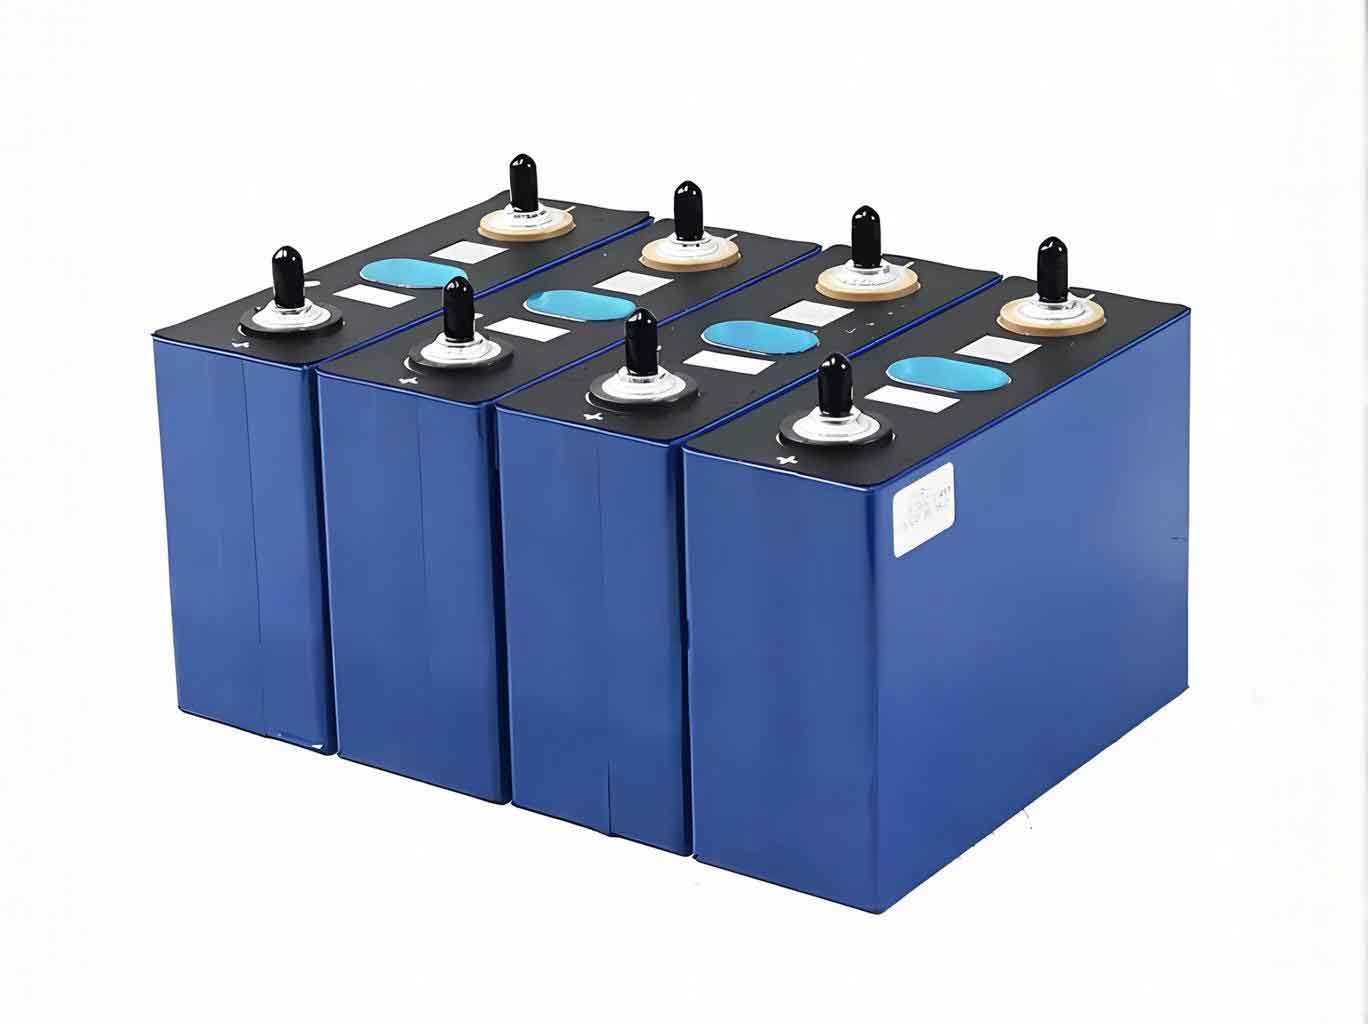
This monitoring system, integrated with big data analytics, enables online estimation of the cycle life of energy storage cells and generates warnings when critical thresholds are approached. The data flow includes acquisition of basic parameters from terminals, loading them into a data-driven model, and issuing alerts if the predicted cycle life falls below a safety margin.
Fuzzy Evaluation of Energy Storage Cell Systems
Fuzzy logic provides a powerful framework for handling the uncertainty and imprecision inherent in battery system evaluation. I propose a fuzzy evaluation method that transforms linguistic terms into numerical assessments, enabling multi-factor evaluation of energy storage cells.
Linguistic Terms to Fuzzy Rules
First, I define fuzzy sets for relevant variables. For example, the “remaining capacity” of an energy storage cell can be categorized as “high,” “medium,” or “low.” Each linguistic term is assigned a membership function—typically triangular or trapezoidal. Input variables include remaining capacity and charging demand; output variables could be charging power or control strategy. Table 6 shows an example rule base.
| Remaining Capacity | Charging Demand | Charging Power |
|---|---|---|
| High | Low | Low |
| High | Medium | Medium |
| High | High | High |
| Medium | Low | Low |
| Medium | Medium | Medium |
| Medium | High | High |
| Low | Low | Low |
| Low | Medium | Low |
| Low | High | Medium |
Membership Calculation and Fuzzy Composition
For each input variable, I compute the membership degree using the corresponding membership function. For instance, given a measured cycle life value, the membership in the “medium” fuzzy set might be 0.7. The similarity between fuzzy numbers is computed as:
$$
S_{uv}(\tilde{A}, \tilde{B}) = 1 – \frac{1}{n}\sum_{i=1}^{n} |a_i – b_i|
$$
where \(\tilde{A}\) and \(\tilde{B}\) are standard trapezoidal fuzzy numbers corresponding to different linguistic terms. A value close to 1 indicates high similarity.
The weighted membership value for a fuzzy rule \(E_u\) is then:
$$
W_A(E_u) = \frac{\sum_{v \neq u, v=1}^{M} W(E_v) \cdot S_{uw}(\tilde{R}_u, \tilde{R}_v)}{\sum_{v \neq u, v=1}^{M} W(E_v)}
$$
where \(M\) is the number of linguistic terms for the input, and \(W(E_v)\) is the weight reflecting the relative importance of rule \(v\). If all rules are equally important, \(W(E_1)=W(E_2)=\cdots=W(E_M)=1/M\).
The relative agreement and consistency coefficient for each rule are:
$$
R_A(E_u) = \frac{W_A(E_u)}{\sum_{n=1}^{M} W_A(E_n)}
$$
$$
CC(E_u) = \beta \cdot W(E_u) + (1-\beta) \cdot R_A(E_u)
$$
The parameter \(\beta\) balances the influence of the rule’s original importance and its relative agreement. A smaller \(\beta\) increases the impact of agreement. Finally, the overall evaluation result \(\tilde{R}\) for the energy storage cell system is computed as:
$$
\tilde{R} = CC(E_1)\cdot\tilde{R}_1 + \cdots + CC(E_M)\cdot\tilde{R}_M
$$
The magnitude of \(\tilde{R}\) indicates the state of the energy storage cell system, guiding subsequent protection and warning actions.
Risk Assessment Using Fuzzy Evaluation
To assess the operational risks of energy storage cells in the charging station, I identify six key risk factors: control algorithm defects, controller function failure, communication failure, control execution abnormality, data acquisition abnormality, and command response abnormality. Table 7 lists these factors along with their relative occurrence probabilities derived from expert knowledge and fuzzy evaluation.
| Risk Factor | ID | Relative Occurrence Probability |
|---|---|---|
| Control Algorithm Deficiency | N1 | 0.25 |
| Controller Function Failure | N2 | 0.30 |
| Communication Failure | N3 | 0.35 |
| Control Execution Anomaly | N4 | 0.40 |
| Data Acquisition Anomaly | N5 | 0.55 |
| Command Response Anomaly | N6 | 0.60 |
The results indicate that data acquisition and command response anomalies pose the highest risks. Therefore, aging of energy storage cells requires special attention. As energy storage cells degrade, their internal resistance increases and thermal stability decreases, elevating the likelihood of internal short circuits and thermal runaway. The fuzzy evaluation system provides a quantitative basis for scheduling maintenance and replacing underperforming energy storage cells.
Conclusion
In this study, I have developed a comprehensive evaluation method for energy storage cells in photovoltaic charging stations of electric vehicles. The method integrates a tandem solar cell model for accurate energy yield prediction, detailed performance testing of energy storage cells including SOC, SOH, and RUL estimation, and a fuzzy logic-based assessment framework that translates qualitative factors into quantitative risk metrics. The results highlight that aging of energy storage cells is the most critical risk factor, necessitating proactive monitoring and maintenance strategies.
By applying the proposed approach, operators can make informed decisions regarding charging schedules, battery replacement, and system upgrades. The method reduces charging time and costs while improving overall efficiency and reliability. Future work will focus on incorporating real-time data streams and machine learning models to further enhance prediction accuracy for energy storage cells under diverse operating conditions.