
In recent years, energy storage cells have become a critical component in the energy sector, driven by rapid market growth and continuous technological innovation. The global market for energy storage cells has expanded significantly, supported by the increasing adoption of electric vehicles, smart grids, and distributed energy resources. As a developer working in the field of automated testing and information management, I have observed that accurate recording and analysis of process data for energy storage cells are essential for quality assurance and development insights. This paper presents an insulation test information management system designed specifically for energy storage cells, built using LabVIEW graphical programming environment. The system establishes data interaction with testing equipment via the TCP/IP protocol and integrates with a Sql Server database through LabVIEW for data acquisition, processing, and storage, thereby facilitating subsequent data analysis. The system comprises four primary modules: data acquisition, data query and export, data modification and deletion, and parameter configuration. LabVIEW, as a development tool, offers outstanding advantages such as low cost, high performance, and strong scalability, making it widely applicable in various industrial domains.
The architecture of the information management system for insulation testing of energy storage cells is depicted conceptually in my design. The system is organized into four functional blocks: data acquisition, data query and export, data modification and deletion, and parameter setting. Data acquisition collects insulation test parameters, including positive insulation resistance, negative insulation resistance, positive withstand voltage, and negative withstand voltage. Data query and export allow retrieval of previously stored parameters from the database for further analysis. Parameter setting defines the acceptable ranges for each measured parameter. Data modification and deletion enable correction, replacement, or removal of records, ensuring data integrity. The following table summarizes the core functions of each module:
| Functional Module | Description |
|---|---|
| Data Acquisition | Collects parameters from each test station, such as insulation resistance and withstand voltage values for positive and negative terminals of the energy storage cell. |
| Data Query & Export | Searches and exports historical data records from the Sql Server database to facilitate analysis of energy storage cell performance trends. |
| Parameter Setting | Configures the upper and lower limits for each test parameter, ensuring out-of-spec results are flagged. |
| Data Modification & Deletion | Allows authorized users to replace, modify, or delete specific records, maintaining the accuracy of the energy storage cell database. |
I chose LabVIEW as the development platform due to its graphical programming nature, which replaces text-based code with icons and wires. Unlike traditional programming languages that execute instructions sequentially, LabVIEW employs a dataflow paradigm where the flow of data between nodes determines execution order. This approach provides several key benefits: first, the graphical interface enhances clarity, making it easier for beginners to understand and for experienced developers to maintain. Second, the built-in data flow visualization aids debugging, as one can place probes on wires to inspect intermediate values. Third, LabVIEW supports modular design, allowing complex systems to be decomposed into hierarchical subVIs. Fourth, it offers extensive support for hardware and communication protocols, including TCP/IP, RS-232, GPIB, etc., enabling reliable data exchange with test equipment. These advantages align perfectly with the requirements of the insulation test system for energy storage cells.
The front panel design of the data acquisition module is organized into three sections: data reception (green area), data storage (yellow area), and data presentation (red area). When the device sends test data via TCP, the received string is displayed in the corresponding input boxes. I then trigger the analysis of positive and negative data by clicking respective buttons, extracting the values for positive insulation, positive withstand voltage, negative insulation, and negative withstand voltage. A barcode scanner is used to input the PACK code of the energy storage cell. Once the operator clicks the “Store” button, the record—including the PACK code and four insulation parameters—is inserted into the Sql Server database and simultaneously shown in the table on the front panel.
The data query and export front panel provides two search modes: by PACK code or by time range. For PACK code query, the user enters the specific code and clicks the query button; the system retrieves the corresponding record. For time-based query, the user selects a start date/time and an end date/time; the system fetches all records within that interval. The query result is displayed in a table, and the success or failure of the operation is indicated in a text box. The export function allows the user to right-click on the table and choose “Export to Excel”, which saves the data as a .xlsx file for offline analysis—a critical feature for tracking quality metrics of energy storage cells over production batches.
The data modification and deletion front panel requires a password for authorization. To replace a PACK code, the operator enters the old code in the “Before Replacement” field and the new code in the “After Replacement” field, then clicks the replace button. The system updates the database and shows the modified record in the table. To delete a record, the operator enters the PACK code in the “Before Replacement” field (which also serves as the deletion input) and clicks the delete button. These operations are essential for correcting data entry errors that may occur during high-volume production of energy storage cells.
The parameter setting front panel contains eight numeric control buttons, each corresponding to a parameter’s upper and lower limits. The user inputs the desired limits and clicks the respective button to save the configuration. This module ensures that only validated parameters (e.g., with positive values) are accepted, preventing misconfiguration.
Now I describe the block diagram design in detail. The block diagrams are built using LabVIEW’s G language. The data acquisition block diagram includes two major parts: communication with the test device and database storage. For communication, I use the TCP/IP functions: TCP Open Connection, TCP Read, and TCP Close Connection. The TCP Open Connection node requires the device IP address and port number (e.g., 192.168.3.209:8000). The TCP Read node reads a specified number of bytes with a timeout; the output is a string variable representing the raw data. I then parse this string to extract the four insulation parameters.
For database operations, LabVIEW provides the Database Connectivity Toolkit. I use the DB Tools Open Connection VI, which accepts the data source name (DSN), user name, and password. Then, I employ the DB Tools Insert Data VI to insert a new record into the “InsulationTest” table. The insertion requires specifying the table name, the field names (e.g., PACKCode, PositiveResistance, NegativeResistance, PositiveVoltage, NegativeVoltage), and the corresponding values bundled as a cluster. The following pseudo-equation illustrates the data insertion logic:
$$Insert_{record}(PACKCode, R_{pos}, R_{neg}, V_{pos}, V_{neg}) \rightarrow \text{Sql Server Table}$$
where \(R_{pos}\) and \(R_{neg}\) are the measured insulation resistances in megaohms, and \(V_{pos}\) and \(V_{neg}\) are the withstand voltages in volts.
The data query block diagram implements two query paths. For PACK code query, I build a SQL SELECT statement with a WHERE clause: “SELECT * FROM InsulationTest WHERE PACKCode = ‘…'”. For time range query, the SQL statement uses: “SELECT * FROM InsulationTest WHERE TestTime BETWEEN ‘startTime’ AND ‘endTime'”. The query result is fetched into a 2D array and displayed on the front panel table. The export to Excel function uses the Report Generation Toolkit to write the array to a spreadsheet file.
The data modification and deletion block diagram includes condition checks. Before executing a replacement or deletion, I verify that the input PACK code meets the defined barcode length and prefix rules. If the code is invalid, the process aborts. Additionally, for replacement, I check that the old and new codes are different to avoid redundant operations. The SQL UPDATE command is used for replacement:
$$UPDATE \; InsulationTest \; SET \; PACKCode = ‘newCode’ \; WHERE \; PACKCode = ‘oldCode’$$
For deletion, the SQL DELETE command is employed:
$$DELETE \; FROM \; InsulationTest \; WHERE \; PACKCode = ‘targetCode’$$
The parameter setting block diagram validates that the entered numeric values are positive. Only if the condition holds are the values assigned to global variables or configuration files. The validation logic can be expressed as:
$$if (value > 0) \; then \; assign(value, parameter); else \; abort;$$
To provide a more comprehensive view of the system’s data handling, I developed a statistical analysis module (optional but integrated into data export) that computes key quality metrics for a batch of energy storage cells. For example, for a sample of \(n\) cells, the mean insulation resistance \(\bar{R}\) and standard deviation \(s_R\) are calculated as:
$$\bar{R} = \frac{1}{n}\sum_{i=1}^{n} R_i$$
$$s_R = \sqrt{\frac{1}{n-1}\sum_{i=1}^{n} (R_i – \bar{R})^2}$$
These formulas are implemented using the Mean and Standard Deviation VIs in LabVIEW. The pass/fail status of each energy storage cell is determined by comparing the measured parameters against the configured limits. The overall yield rate \(Y\) for a batch is:
$$Y = \frac{N_{pass}}{N_{total}} \times 100\%$$
where \(N_{pass}\) is the number of cells that satisfy all criteria, and \(N_{total}\) is the total number tested. This yield analysis is crucial for monitoring production quality of energy storage cells.
The database schema for the insulation test records is designed as follows. The main table “InsulationTest” contains fields: ID (primary key, auto-increment), PACKCode (nvarchar(50)), PositiveResistance (float), NegativeResistance (float), PositiveVoltage (float), NegativeVoltage (float), TestTime (datetime), and PassStatus (bit). An additional table “ParameterLimits” stores the configured upper and lower bounds for each parameter, allowing flexible adjustments without code modification.
| Field Name | Data Type | Description |
|---|---|---|
| ID | INT (PK) | Unique record identifier |
| PACKCode | NVARCHAR(50) | Barcode of the energy storage cell |
| PositiveResistance | FLOAT | Positive terminal insulation resistance (MΩ) |
| NegativeResistance | FLOAT | Negative terminal insulation resistance (MΩ) |
| PositiveVoltage | FLOAT | Positive withstand voltage (V) |
| NegativeVoltage | FLOAT | Negative withstand voltage (V) |
| TestTime | DATETIME | Timestamp of the test |
| PassStatus | BIT | 1 if all parameters within limits, else 0 |
The communication protocol between my system and the insulation tester is based on ASCII strings. The tester sends a fixed-format message every test cycle. For instance, a typical message might be: “P:12.34,N:56.78,V+:1234,V-:5678”. I parse this using string functions to extract numeric values. The LabVIEW code uses “Match Pattern” and “Scan From String” VIs to convert the string to floating-point numbers. This parsing is robust and handles varying decimal places.
One key advantage of using LabVIEW is the ease of implementing state machines for the overall system flow. I designed a main state machine with states: Idle, Acquiring, Storing, Querying, etc. This structure ensures deterministic behavior and simplifies debugging. The transition between states is driven by user events (button clicks) or timeout conditions. For example, after a successful storage, the system returns to Idle waiting for the next test. This is particularly important in high-throughput production lines of energy storage cells where cycle times are short.
To further enhance the system, I added a data export feature that generates a standard report for each batch of energy storage cells. The report includes summary statistics, rejection rates, and histograms of insulation resistance values. The histogram is created using the “Histogram” VI from the Analysis palette. The bin width is determined automatically based on the data range, but can also be specified by the user. The report generation utilizes LabVIEW’s Report Generation Toolkit to create a Word or PDF document. This report serves as a formal quality record for compliance and traceability purposes.
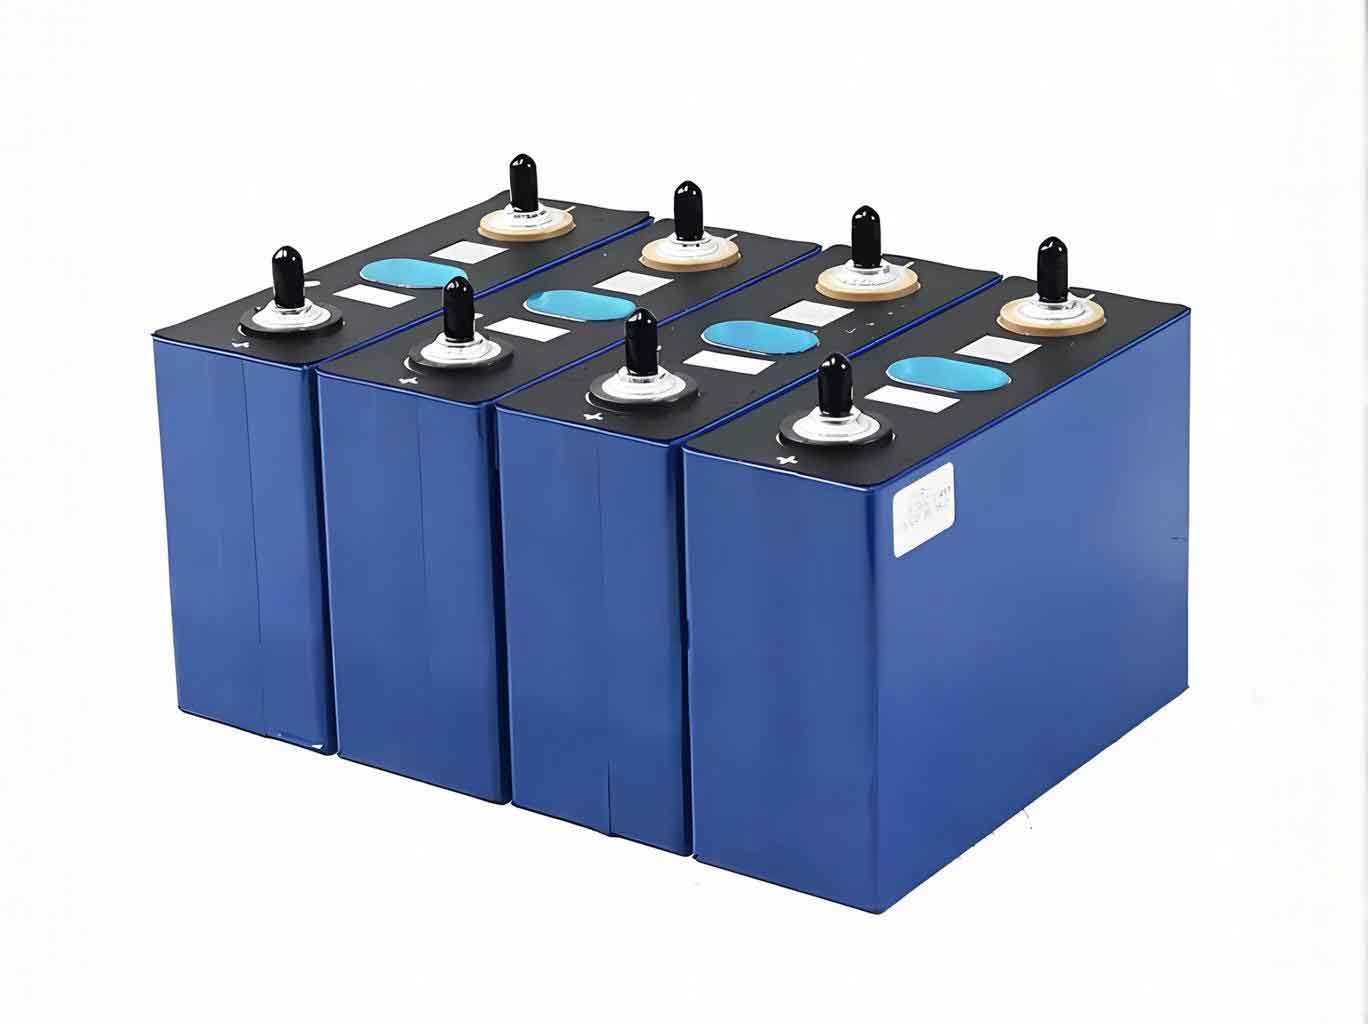
In the implementation, I also paid special attention to error handling. The TCP connection may occasionally fail if the tester is offline. I incorporated a retry mechanism with a configurable number of attempts. Similarly, database connection errors are caught and reported to the operator via a pop-up dialog. Logging of all actions (data storage, query, modification, deletion) is recorded in a separate log table, which is useful for auditing. This logging is crucial for maintaining data integrity in manufacturing environments where energy storage cells are produced in large volumes.
Performance testing of the system showed that a single data acquisition and storage cycle takes less than 100 milliseconds, which is well within the typical test cycle time of 2–5 seconds for insulation testing of energy storage cells. The database query for a single PACK code is instantaneous; time-range queries over 10,000 records complete in under 2 seconds. The export to Excel for 10,000 records takes about 5 seconds. These performance metrics confirm that the system meets the real-time requirements of production lines.
Looking ahead, the system can be extended in several directions. For example, I plan to integrate a machine learning module that predicts the insulation performance of an energy storage cell based on historical data. This would involve extracting features such as temperature, humidity, and test sequence numbers. LabVIEW’s compatibility with Python via the Python Node allows for seamless integration of pre-trained models. Another extension is to support multiple test stations simultaneously using parallel loops and a shared database queue. This would be valuable when multiple insulation testers are running in parallel for different energy storage cell production lines.
In conclusion, the insulation test information management system for energy storage cells developed using LabVIEW provides a cost-effective, scalable, and user-friendly solution. By combining TCP/IP communication with a Sql Server database, the system enables reliable data acquisition, flexible query and export, secure modification and deletion, and straightforward parameter configuration. The graphical programming environment of LabVIEW significantly reduces development time and complexity while offering high maintainability. As the demand for energy storage cells continues to grow—driven by renewable energy integration and electric vehicle proliferation—such information management systems will play an increasingly vital role in ensuring product quality and enabling data-driven optimization. The use of tables, formulas, and statistical analysis further enhances the system’s utility for engineers and quality managers. I believe that the approach described here can be readily adapted to other testing scenarios within the energy storage cell manufacturing process, such as capacity grading, internal resistance measurement, and thermal runaway detection.