
In the field of energy storage, thermal management has become a critical factor for ensuring the safe and efficient operation of lithium-ion batteries. As global energy demands grow and renewable sources such as hydropower, wind power, and solar photovoltaics expand rapidly, the application of energy storage technology is receiving increasing attention. Lithium iron phosphate (LFP) batteries are widely used in energy storage systems due to their long cycle life, high energy density, and excellent performance. However, the thermal behavior of these cells during charge and discharge cycles directly impacts their lifespan, efficiency, and safety. Overheating can lead to thermal runaway and catastrophic failures. Therefore, reliable thermal management is essential to maintain the temperature of energy storage cells within a safe range, typically between -20°C and 55°C, and to ensure uniform temperature distribution across the module. This study focuses on the cooling performance evaluation of a single-phase immersion-cooled energy storage cell unit module using computational fluid dynamics (CFD) simulations and experimental validation.
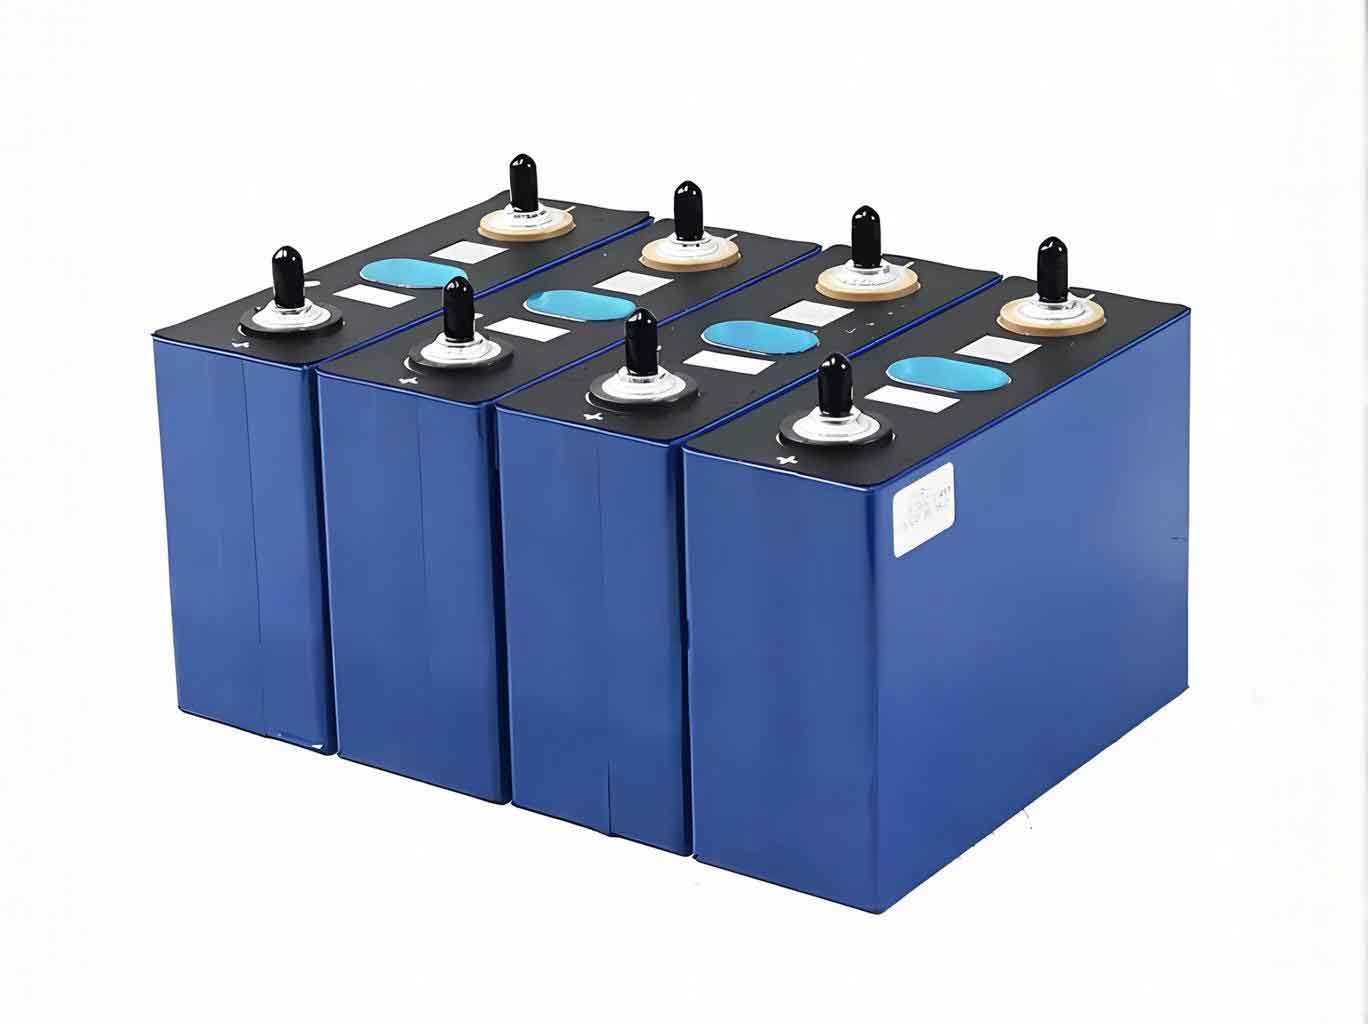
We selected a 280 Ah LFP cell as the research object, with dimensions of 164 mm × 72 mm × 194 mm. The heat generation rate at 0.5 P charge/discharge is 16.5 W per cell. The thermal conductivity of the cell is 14 W/(m·K) in the X and Z directions and 2.5 W/(m·K) in the Y direction. The gap pad between cells has a thermal conductivity of 0.05 W/(m·K). The module configuration is 1P26S (one parallel string of 26 cells in series). The immersion cooling module consists of two such 1P26S battery strings connected in parallel on the coolant side. The coolant flows into each string, passes through the inter-cell flow channels, and exits. The cells are directly immersed in a dielectric cooling fluid with high electrical insulation. The design target is to keep the maximum cell surface temperature below 35°C and the temperature difference among cells within 3°C during steady operation at 0.5 P.
To evaluate the cooling performance, we built a three-dimensional CFD model of a single 1P26S battery string, simplifying the cell as a uniform heat source. The mesh comprised approximately 2.14 million elements. The governing equations for fluid flow and heat transfer include the continuity, momentum, and energy equations:
$$
\frac{\partial p}{\partial t} + \nabla \cdot (p \mathbf{v}) = 0
$$
$$
\frac{d\mathbf{v}}{dt} + (\mathbf{v} \cdot \nabla)\mathbf{v} = \frac{1}{p} \nabla \cdot \sigma + \mathbf{f}
$$
$$
\frac{\partial (p T)}{\partial t} + \nabla \cdot (p \mathbf{U} T) = \nabla \cdot \left( \frac{k_f}{c_p} \nabla T \right) + S_h + \Phi
$$
where \( p \) is fluid density, \( \mathbf{v} \) is velocity, \( T \) is temperature, \( t \) is time, \( \mathbf{f} \) represents body forces, \( \sigma \) is stress tensor, \( k_f \) is thermal conductivity of fluid, \( c_p \) is specific heat, \( S_h \) is volumetric heat source, and \( \Phi \) is viscous dissipation. The boundary conditions were set with coolant inlet temperature of 20°C and varying flow rates.
We first simulated the steady-state behavior at a flow rate of 2.5 L/min per single string (equivalent to 5 L/min for the whole pack). The results showed a maximum cell surface temperature of 36.9°C, which exceeds the 35°C limit, and a maximum temperature difference among cells of 3.4°C, also exceeding the 3°C requirement. These values are summarized in Table 1.
| Flow rate per string (L/min) | Max cell temperature (°C) | Max temperature difference (°C) | Design satisfied? |
|---|---|---|---|
| 2.5 | 36.9 | 3.4 | No |
| 3.0 | 35.7 | 3.2 | No (close) |
Increasing the flow rate to 3.0 L/min per string (6 L/min per pack) reduced the maximum temperature to 35.7°C and the temperature difference to 3.2°C. Although still slightly above the design limits, transient simulations were then performed to capture the real operating profile: 0.5 P charge for 2 hours, rest for 0.5 hour, then 0.5 P discharge for 2 hours. The transient results at the end of charge, rest, and discharge are presented in Table 2.
| Phase | Max cell temperature (°C) | Max temperature difference (°C) |
|---|---|---|
| End of charge | 31.8 | 2.1 |
| End of rest | 28.6 | 1.8 |
| End of discharge | 33.9 | 2.9 |
At the end of discharge, the maximum cell surface temperature reached 33.9°C, and the maximum temperature difference was 2.9°C, both within the design targets (35°C and 3°C, respectively). This indicates that the immersion cooling module with a flow rate of 3.0 L/min per string can meet the thermal requirements under realistic cycling conditions.
To validate the simulations, we built a prototype of the pack (two strings, total flow 6 L/min) and conducted experimental tests under the same 0.5 P charge/discharge cycle. We monitored the temperature at the cell tabs (closest to the cell surface) during 4 complete cycles. The maximum temperature recorded during charging was 33°C, and during discharging was 32.5°C. The overall maximum temperature observed in the experiment was 33°C, very close to the simulated maximum of 33.9°C. The maximum temperature difference among cells measured experimentally was 2.7°C, also close to the simulated value of 2.9°C. A comparison of key metrics is given in Table 3.
| Parameter | Simulation (max) | Experiment (max) | Deviation |
|---|---|---|---|
| Max cell temperature during charge (°C) | 31.8 | 33.0 | +1.2 |
| Max cell temperature during discharge (°C) | 33.9 | 32.5 | -1.4 |
| Overall max temperature (°C) | 33.9 | 33.0 | -0.9 |
| Max temperature difference among cells (°C) | 2.9 | 2.7 | -0.2 |
The good agreement between the CFD predictions and experimental data confirms the accuracy of the simulation methodology. The minor deviations can be attributed to simplifying assumptions such as uniform heat generation, ideal thermal contact, and neglecting the heat capacity of the housing and connectors. Nevertheless, the CFD model successfully predicts the thermal behavior of the energy storage cell module and can be used as a reliable design tool for subsequent development of immersion energy storage systems.
In conclusion, this study demonstrates that an immersion-cooled energy storage cell unit module with a flow rate of 3.0 L/min per string (6 L/min per pack) achieves a maximum cell temperature below 35°C and a temperature difference below 3°C during 0.5 P cycling, satisfying the design requirements. The validated CFD approach provides a cost-effective means to optimize the cooling design of energy storage cells, reducing the need for extensive prototype testing. Future work will focus on multi-module systems, scaling effects, and the integration of immersion cooling with other thermal management strategies.
The thermal performance of the energy storage cell module under varying flow conditions was further analyzed using the energy balance equation:
$$
P = c_p \dot{V} \Delta T
$$
where \( P \) is the total heat generation of the module (26 cells × 16.5 W = 429 W), \( c_p \) is the specific heat of the coolant, \( \dot{V} \) is the volumetric flow rate, and \( \Delta T \) is the coolant temperature rise. For the design case (flow rate 3 L/min), the calculated temperature rise is approximately 4.5°C, consistent with the simulation and experiment.
The simulation process also helped identify the hottest cells, which were located near the outlet side but not exactly at the last row, due to flow distribution and heat radiation to the housing. This insight is valuable for improving flow uniformity in future designs. By adjusting the inlet and outlet positions or adding flow deflectors, the temperature uniformity of the energy storage cell module can be further enhanced.
In summary, the combination of CFD simulation and experimental validation provides a robust framework for designing immersion cooling systems for energy storage cells. The methodology presented here can be extended to other cell chemistries and form factors, contributing to the safe and efficient operation of large-scale energy storage systems.