
In the context of global energy transformation and technological revolution, the solar photovoltaic industry has emerged as a strategic emerging sector with international competitiveness and high-quality development potential. Coastal regions, with their geographical advantages and policy support, play a pivotal role in advancing solar energy utilization. This study focuses on Fujian Province, a representative coastal area in southeastern China, to analyze the development status, challenges, and strategies of the solar photovoltaic industry through patent data analysis. We employ patent metrology methods to examine global, national, and regional trends, with an emphasis on the innovation landscape in Fujian. The objective is to provide insights for promoting the high-quality development of solar photovoltaic industries in coastal areas, leveraging technological chains, application chains, talent chains, and cooperation chains. Throughout this analysis, the term “solar system” will be frequently referenced to underscore the integration of photovoltaic technologies into broader energy systems.
The data for this study is sourced from a global patent database, covering solar photovoltaic-related patents up to 2023. We constructed a search strategy using keywords and International Patent Classification (IPC) codes related to solar energy, such as those for solar cells, photovoltaic modules, and grid integration. After data cleaning and processing, we obtained a dataset of over 250,000 patent documents worldwide, including approximately 118,000 from China and 2,900 from Fujian Province. This dataset forms the basis for quantitative and qualitative analyses, including patent counts, high-value patent ratios, technology clustering, and innovation entity assessments. We utilize statistical models and formulas to summarize trends, such as patent growth rates and technology diffusion patterns. For instance, the cumulative number of patents in a region can be modeled using a logistic growth curve: $$ P(t) = \frac{K}{1 + e^{-r(t-t_0)}} $$ where \( P(t) \) is the patent count at time \( t \), \( K \) is the carrying capacity, \( r \) is the growth rate, and \( t_0 \) is the inflection point. This helps in understanding the maturity of solar system innovations.
Globally, the solar photovoltaic industry is highly concentrated, with four leading countries dominating patent filings. The distribution of patents and high-value patent ratios is summarized in Table 1. High-value patents are defined as those with a quality score above a threshold, reflecting their technological impact and commercial potential. The data indicates that while China leads in patent volume, its high-value patent proportion lags behind that of the United States and Japan, suggesting a need for quality improvement in solar system innovations.
| Country | Patent Count | High-Value Patent Ratio (%) | Key Trends |
|---|---|---|---|
| China | 118,011 | 21 | Leading in volume, but lower quality |
| Japan | 40,128 | 45 | Strong in high-value patents |
| United States | 25,599 | 69 | Highest quality ratio |
| South Korea | 21,101 | 38 | Significant innovation output |
| Others | 54,514 | 30 (average) | Diverse contributions |
The technological landscape is further illuminated by analyzing top patent applicants globally. Companies from Japan and South Korea, such as LG and Sharp, dominate the list, highlighting their advanced capabilities in solar system components. In contrast, Chinese firms are catching up but still face gaps in core technologies. The innovation efficiency can be expressed using a formula for patent productivity: $$ IE = \frac{N_p}{R_d} $$ where \( IE \) is innovation efficiency, \( N_p \) is the number of patents, and \( R_d \) is research and development expenditure. This metric underscores the need for optimized investment in solar system R&D.
In China, the solar photovoltaic industry is clustered in coastal regions, particularly the Yangtze River Delta and Pearl River Delta. Table 2 summarizes the patent output and high-value patent ratios for top Chinese provinces. Jiangsu Province leads with nearly 29,000 patents, followed by Zhejiang and Guangdong. These regions benefit from robust industrial chains, policy support, and innovation ecosystems, facilitating the deployment of integrated solar systems. The concentration of patents aligns with economic development patterns, as modeled by the Gini coefficient for spatial inequality: $$ G = \frac{\sum_{i=1}^n \sum_{j=1}^n |x_i – x_j|}{2n^2 \bar{x}} $$ where \( x_i \) is the patent count in province \( i \), \( n \) is the number of provinces, and \( \bar{x} \) is the mean patent count. A high Gini coefficient indicates uneven distribution, which is observed in China’s solar photovoltaic industry.
| Province | Patent Count | High-Value Patent Ratio (%) | Regional Characteristics |
|---|---|---|---|
| Jiangsu | 28,899 | 22 | Leading cluster with complete supply chain |
| Zhejiang | 15,432 | 20 | Strong in manufacturing and exports |
| Guangdong | 12,345 | 22 | Innovation hub with high-value patents |
| Beijing | 10,987 | 27 | Research-intensive with academic contributions |
| Shanghai | 9,876 | 25 | International collaboration center |
| Others | 40,472 | 19 (average) | Varied development levels |
Fujian Province, as a coastal region, exhibits moderate performance in the national context. With around 2,900 patents, it ranks 11th among Chinese provinces, and its high-value patent ratio is 19%, slightly below the national average. This positions Fujian as a mid-tier player in solar system innovation. To delve deeper, we analyze the internal distribution within Fujian. Table 3 shows the patent counts by city, revealing that Quanzhou, Xiamen, and Fuzhou are the core innovation zones, accounting for 86% of the province’s patents. These cities host key research institutions and enterprises focused on advanced solar systems, such as heterojunction and perovskite solar cells.
| City | Patent Count | Percentage of Provincial Total (%) | Key Technology Focus |
|---|---|---|---|
| Quanzhou | 1,250 | 43 | Heterojunction cells, flexible solar systems |
| Xiamen | 900 | 31 | Perovskite cells, photovoltaic modules |
| Fuzhou | 550 | 19 | Thin-film cells, solar system integration |
| Other Cities | 215 | 7 | Diverse applications |
The technological focus in Fujian is further clarified through patent clustering analysis. We identify six major research directions: flexible solar cells, heterojunction solar cells, perovskite solar cells, solar panels, grid inverters, and photovoltaic systems. Each direction encompasses specific technical aspects, as summarized in Table 4. The integration of these technologies is crucial for developing efficient solar systems. For example, the efficiency of a solar system can be expressed as: $$ \eta_{system} = \eta_{cell} \times \eta_{module} \times \eta_{inverter} \times \eta_{other} $$ where \( \eta_{cell} \) is the solar cell efficiency, \( \eta_{module} \) is the module packing factor, \( \eta_{inverter} \) is the inverter conversion efficiency, and \( \eta_{other} \) accounts for losses due to shading or temperature. Innovations in heterojunction and perovskite cells aim to enhance \( \eta_{cell} \), directly impacting overall solar system performance.
| Cluster Theme | Specific Technologies | Patent Examples |
|---|---|---|
| Flexible Solar Cells | Solar cell chips, crystalline silicon cells, flexible substrates | Patents on bendable solar systems for wearable devices |
| Heterojunction Solar Cells | Grid electrodes, lattice matching, passivation layers | Patents on high-efficiency heterojunction solar system components |
| Perovskite Solar Cells | Dye-sensitized cells, acceptor materials, stability enhancements | Patents on perovskite-based solar system architectures |
| Solar Panels | Power generation efficiency, solar charging, radar-assisted tracking | Patents on smart solar system panels with monitoring |
| Grid Inverters | Inverter design, grid synchronization, energy management | Patents on inverters for grid-connected solar systems |
| Photovoltaic Systems | Thin-film panels, building-integrated PV, system optimization | Patents on integrated solar system solutions for buildings |
Innovation actors in Fujian are dominated by a mix of enterprises and academic institutions. Table 5 lists the top 10 patent applicants, highlighting their roles in advancing solar system technologies. Leading companies focus on heterojunction and flexible solar cells, while universities contribute to perovskite and thin-film research. This synergy between industry and academia is vital for fostering a robust innovation ecosystem. The collaboration intensity can be measured using a co-patenting index: $$ CI = \frac{N_{co}}{N_{total}} $$ where \( CI \) is the collaboration index, \( N_{co} \) is the number of co-assigned patents, and \( N_{total} \) is the total patents. A higher \( CI \) indicates stronger partnerships, which is an area for improvement in Fujian’s solar system sector.
| Applicant | Patent Count | Primary Focus | Type |
|---|---|---|---|
| Company A | 146 | Heterojunction cells, flexible solar systems | Enterprise |
| University B | 122 | Perovskite cells, thin-film solar systems | Academic |
| University C | 82 | Perovskite cells, solar system materials | Academic |
| Company D | 81 | Flexible solar systems, manufacturing equipment | Enterprise |
| University E | 57 | Perovskite cell stability | Academic |
| Company F | 57 | Heterojunction solar system components | Enterprise |
| Company G | 49 | Thin-film solar systems | Enterprise |
| Company H | 42 | Polycrystalline cells, perovskite solar systems | Enterprise |
| University I | 39 | Perovskite cell applications | Academic |
| Company J | 27 | Thin-film solar system modules | Enterprise |
Despite these strengths, Fujian faces several challenges in solar photovoltaic industry development. First, the industry is unevenly distributed, with limited local leading enterprises and an incomplete supply chain. Table 6 compares Fujian with top provinces in terms of industrial scale and innovation output. The gap is evident, necessitating strategies to enhance cluster development. Second, application-side development is constrained by natural resources and policy support. Fujian’s solar irradiance is moderate, affecting the economic viability of large-scale solar systems. The levelized cost of energy (LCOE) for a solar system can be calculated as: $$ LCOE = \frac{\sum_{t=1}^n \frac{I_t + M_t}{(1+r)^t}}{\sum_{t=1}^n \frac{E_t}{(1+r)^t}} $$ where \( I_t \) is investment cost in year \( t \), \( M_t \) is maintenance cost, \( E_t \) is energy output, \( r \) is the discount rate, and \( n \) is the system lifetime. Higher LCOE in Fujian due to lower irradiance requires innovative financing and policy incentives.
| Aspect | Fujian Province | Jiangsu Province | Guangdong Province |
|---|---|---|---|
| Patent Count | 2,900 | 28,899 | 12,345 |
| High-Value Patent Ratio (%) | 19 | 22 | 22 |
| Industrial Cluster Scale | Moderate, focused on few cities | Large, with multiple hubs | Large, with diverse sectors |
| Key Enterprises | Few leaders, many SMEs | Numerous leading firms | Mix of large and innovative firms |
| Solar System Installations (GW) | ~5 (estimated) | ~30 (estimated) | ~20 (estimated) |
Third, talent reserves are relatively insufficient, exacerbated by weaker higher education foundations compared to neighboring provinces. The talent gap can be quantified using a shortage index: $$ SI = \frac{D – S}{D} $$ where \( SI \) is the shortage index, \( D \) is the demand for skilled professionals in solar systems, and \( S \) is the supply. A positive \( SI \) indicates a deficit, which hampers innovation capacity. Fourth, international exchange and cooperation are limited, with fewer high-quality professional exhibitions and global partnerships. This restricts access to advanced solar system technologies and markets.
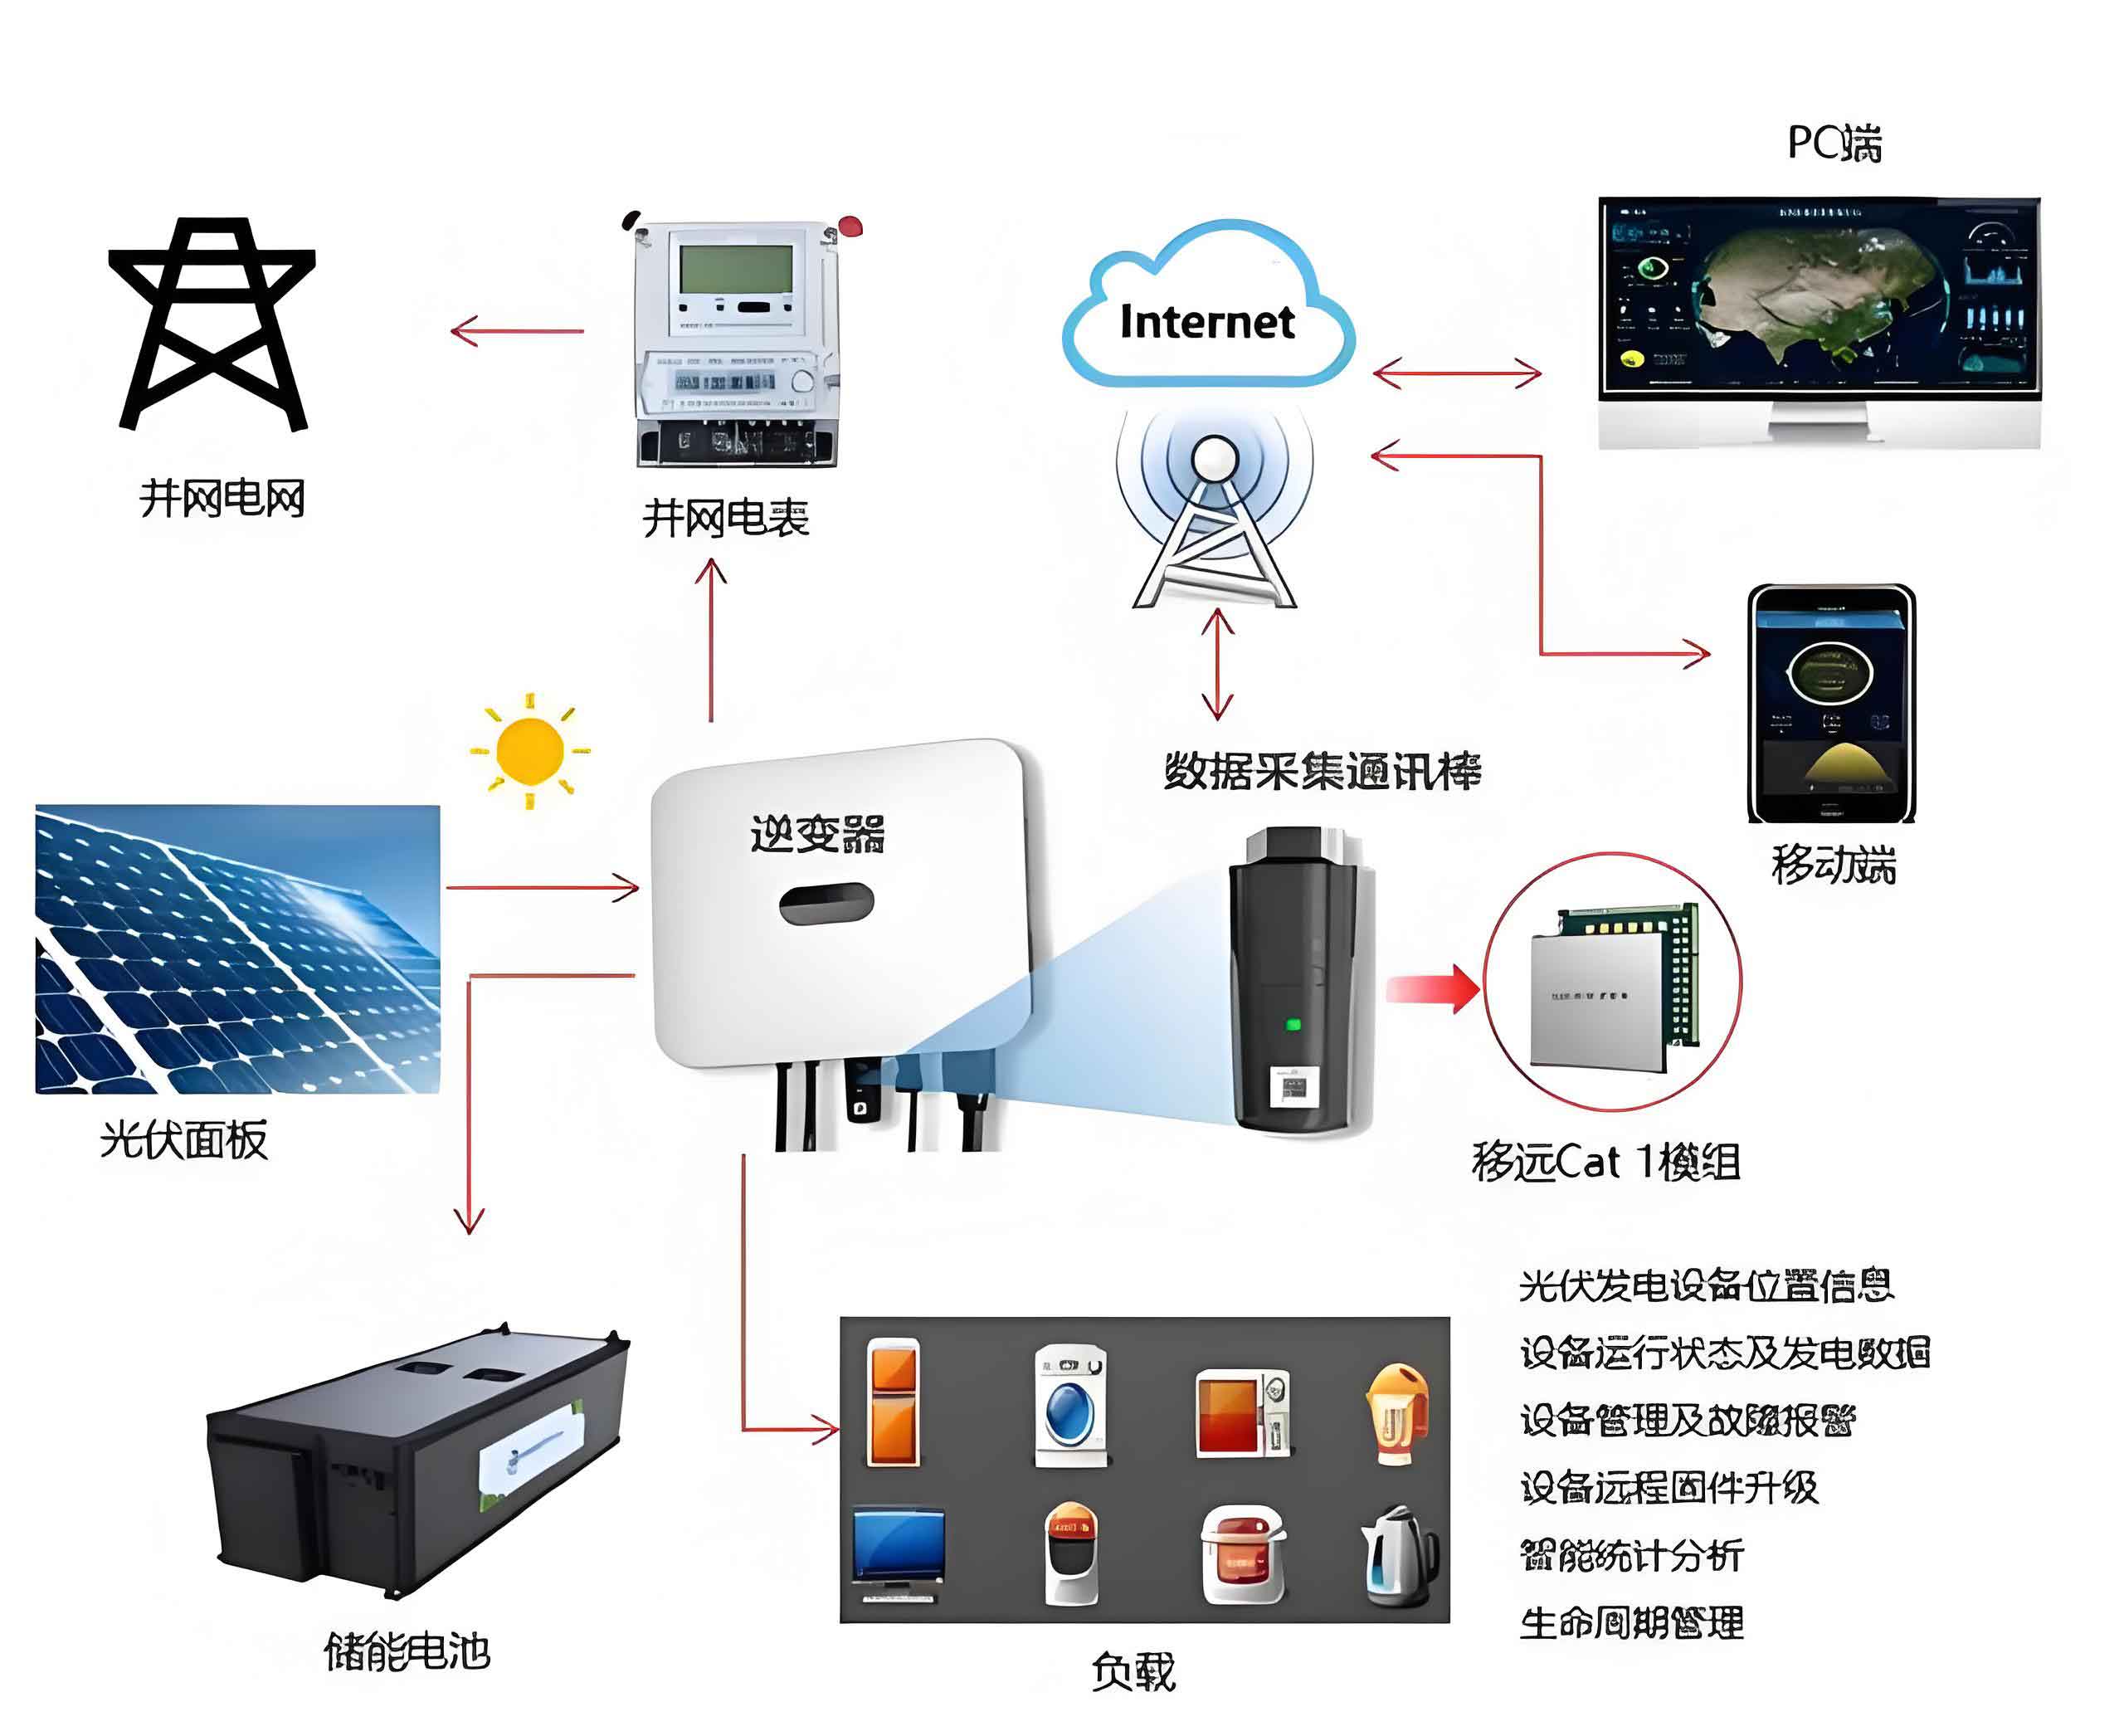
To address these challenges, we propose a multifaceted strategy for Fujian’s solar photovoltaic industry. First, strengthening the technology chain involves enhancing high-level innovation platforms and public technical service centers. For instance, establishing research hubs focused on heterojunction and perovskite solar systems can boost R&D output. The technology advancement rate can be modeled as: $$ \frac{dT}{dt} = \alpha R + \beta C $$ where \( T \) is technological level, \( R \) is R&D investment, \( C \) is collaboration intensity, and \( \alpha, \beta \) are coefficients. Increasing \( R \) and \( C \) through policy support can accelerate solar system innovations.
Second, expanding the application chain requires increasing support for distributed solar systems and exploring new scenarios like offshore photovoltaic projects. Offshore solar systems, integrated with energy storage or marine aquaculture, can leverage Fujian’s coastal resources. The potential energy output from offshore solar systems can be estimated using: $$ E_{offshore} = A \times G \times \eta_{system} \times CF $$ where \( A \) is the available area, \( G \) is solar irradiance, \( \eta_{system} \) is system efficiency, and \( CF \) is capacity factor. Policy incentives, such as feed-in tariffs for solar systems, can improve economic feasibility.
Third, building the talent chain entails implementing precise talent introduction models and deepening evaluation reforms for high-level professionals. Collaboration between enterprises and universities can foster dual education programs focused on solar system design and maintenance. The talent cultivation efficiency can be expressed as: $$ TCE = \frac{N_{graduates}}{I_{education}} $$ where \( TCE \) is talent cultivation efficiency, \( N_{graduates} \) is the number of graduates in relevant fields, and \( I_{education} \) is educational investment. Enhancing \( TCE \) through targeted programs can alleviate talent shortages.
Fourth, widening the cooperation chain involves strengthening domestic industry-academia linkages and engaging with international research networks. Hosting an international solar system expo in Fujian can facilitate knowledge exchange and business opportunities. The cooperation benefit can be quantified using a network analysis metric, such as centrality in patent collaboration graphs: $$ C_i = \frac{\sum_{j \neq i} d_{ij}}{n-1} $$ where \( C_i \) is the centrality of node \( i \) (e.g., a firm or institution), \( d_{ij} \) is the distance between nodes, and \( n \) is the total nodes. Increasing centrality through active participation in global solar system networks can enhance innovation diffusion.
In conclusion, Fujian Province has a solid foundation in solar photovoltaic innovation, with strengths in specific technologies like heterojunction and perovskite solar systems. However, gaps in industrial scale, talent, and internationalization persist. By leveraging patent data insights, we recommend integrated strategies to reinforce technology, application, talent, and cooperation chains. These efforts can propel Fujian toward high-quality development in the solar photovoltaic industry, serving as a model for other coastal regions. The continuous evolution of solar systems will play a critical role in achieving energy sustainability and economic growth, underscoring the importance of innovation-driven policies and collaborative ecosystems.