
As an energy analyst observing the rapid transformations in the global energy landscape, I have witnessed a significant shift toward sustainability, driven by regulatory changes and technological advancements. The maritime industry’s move to low-sulfur fuels and the explosive growth of solar photovoltaic systems are prime examples of this transition. In this article, I will explore these developments from my perspective, emphasizing how integrated solar systems are reshaping our energy future. I aim to provide a comprehensive analysis using data, tables, and formulas to illustrate key trends.
The International Maritime Organization’s (IMO) 2020 sulfur cap regulation, which limits sulfur content in marine fuels to 0.5%, has forced the shipping sector to seek alternatives. From my viewpoint, the options include using low-sulfur fuel oil, installing scrubbers, switching to distillates like diesel, or adopting liquefied natural gas (LNG). Each choice has economic and environmental implications. For instance, distillates offer a ready solution but increase costs; I estimate that replacing residual fuel oil with distillates can raise fuel expenses by an average of 44%, from $212 per ton to $379 per ton. This shift benefits refiners with distillation capacity but challenges those lacking deep conversion capabilities. The demand for distillates in marine fuel blending could support prices, while residual fuel oil prices may decline, affecting market dynamics.
In the long term, I believe that LNG presents a promising path for maritime fuel due to its lower greenhouse gas emissions compared to distillates. The adoption of LNG is expected to surge, with projections indicating potential growth to 50 million tons per year by 2030. However, the integration of renewable energy sources, particularly solar systems, is becoming increasingly relevant. Solar systems, encompassing photovoltaic panels and related infrastructure, are not only transforming power generation but also influencing other sectors through indirect electrification and hybrid solutions.
Now, let’s delve into the solar system phenomenon. According to the International Energy Agency (IEA), 2016 set a record for renewable energy expansion, largely due to the boom in solar photovoltaic capacity in China. I observe that solar system installations are now outpacing all other fuel sources in growth. In 2016, global solar photovoltaic additions increased by 50%, reaching 74 GW, with China accounting for half of that. This marks the first time solar system growth exceeded that of coal and other fuels. The cost reductions and policy support have been instrumental; auction prices for solar systems have fallen to historic lows of $30 per MWh. I project that by 2022, renewable capacity will expand by about 1,000 GW, equivalent to half of the current global coal capacity, with solar systems leading the charge.
To quantify this growth, I use an exponential model: $$ C(t) = C_0 e^{rt} $$ where \( C(t) \) is the installed capacity at time \( t \), \( C_0 \) is the initial capacity, and \( r \) is the growth rate. For solar systems, assuming an initial capacity of 300 GW in 2016 and a growth rate of 20% annually, the capacity in 2022 can be estimated as: $$ C(2022) = 300 \times e^{0.20 \times 6} \approx 300 \times e^{1.2} \approx 300 \times 3.320 = 996 \, \text{GW} $$ This aligns with IEA forecasts, underscoring the rapid adoption of solar systems.
The impact of solar systems extends beyond electricity generation. In transportation and heating, renewable penetration remains low, but solar-powered solutions, such as photovoltaic charging stations for electric vehicles, are gaining traction. The share of renewables in road transport fuel is expected to rise only slightly, from 4% in 2016 to nearly 5% by 2022. This slow progress highlights the policy challenges in decarbonizing these sectors. Advanced biofuels from non-food sources offer opportunities, but without incentives, growth may stall. In heating, the renewable share is projected to increase from 9% in 2015 to nearly 11% by 2022, with solar thermal systems playing a role.
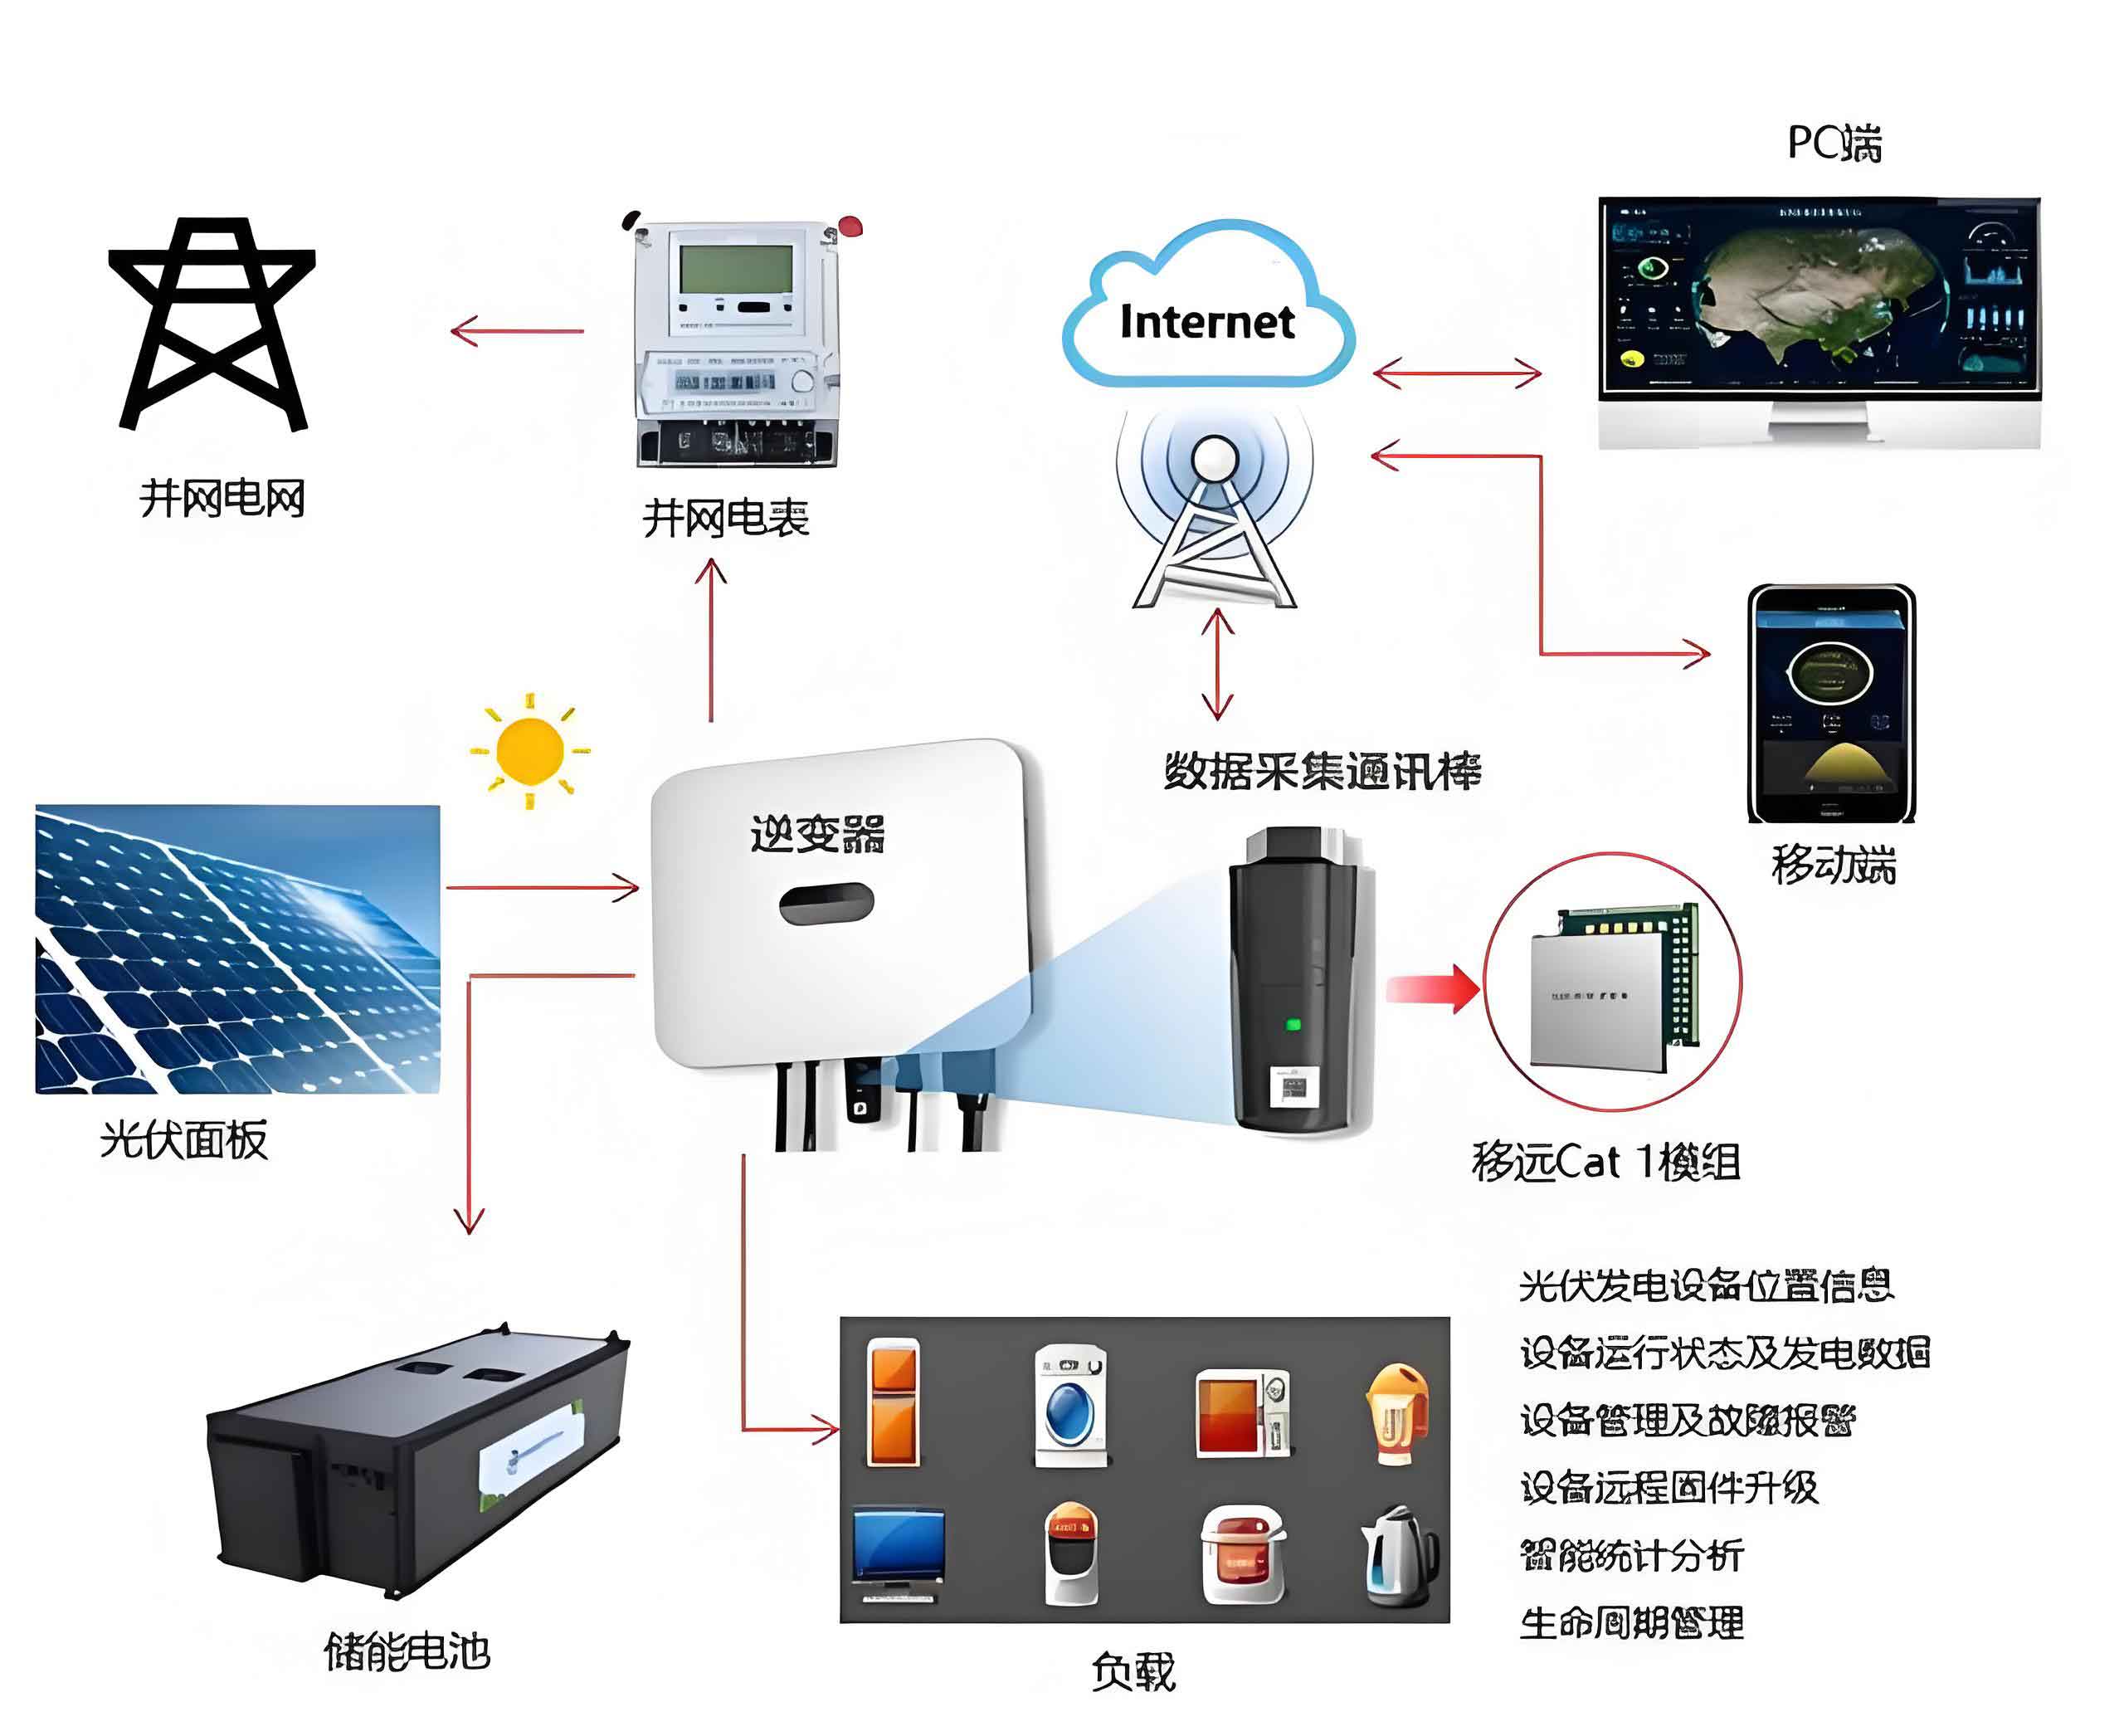
As I analyze the data, it becomes clear that solar systems are central to the energy transition. The scalability and declining costs of solar photovoltaic technology make it a cornerstone for sustainable development. For example, the levelized cost of electricity (LCOE) for solar systems can be expressed as: $$ \text{LCOE} = \frac{\sum_{t=1}^{n} \frac{I_t + M_t}{(1+r)^t}}{\sum_{t=1}^{n} \frac{E_t}{(1+r)^t}} $$ where \( I_t \) is investment cost in year \( t \), \( M_t \) is maintenance cost, \( E_t \) is energy output, \( r \) is the discount rate, and \( n \) is the system lifetime. With solar system costs plummeting, LCOE has dropped below that of fossil fuels in many regions, driving adoption.
To compare different energy sources, I have compiled a table summarizing key metrics for marine fuels and solar systems. This illustrates the trade-offs in terms of cost, emissions, and scalability.
| Energy Source | Sulfur Content (%) | Estimated Cost (USD/ton) | CO2 Emissions (kg/GJ) | Growth Rate (2022 Projection) |
|---|---|---|---|---|
| High-Sulfur Fuel Oil | 3.5 | 212 | 77 | Declining |
| Low-Sulfur Distillates | 0.1 | 379 | 74 | Moderate |
| LNG | 0.01 | Varies | 56 | High |
| Solar Systems (PV) | 0 | 30-50 per MWh | 0 | Very High |
From my perspective, the integration of solar systems into various sectors is crucial. In maritime, hybrid ships with solar-assisted power are being explored, though they are nascent. The potential for solar systems to provide auxiliary power on vessels could reduce reliance on fossil fuels. Moreover, ports are investing in solar infrastructure to support electrification, aligning with broader trends. The solar system revolution is not limited to land; it is extending to offshore applications and floating photovoltaic installations, enhancing energy resilience.
Another aspect I consider is the policy framework supporting solar systems. Governments worldwide are implementing subsidies, tax incentives, and renewable portfolio standards to accelerate deployment. The success of solar systems in countries like China, India, and the United States is largely policy-driven. For instance, China’s feed-in tariffs have spurred massive solar system installations, while India’s ambitious targets aim to reach 100 GW of solar capacity by 2022. In the U.S., federal tax credits have boosted solar system adoption, despite political uncertainties. These policies can be modeled using a logistic growth function: $$ P(t) = \frac{K}{1 + e^{-a(t-t_0)}} $$ where \( P(t) \) is the installed capacity of solar systems at time \( t \), \( K \) is the carrying capacity (maximum potential), \( a \) is the growth rate, and \( t_0 \) is the inflection point. This helps predict saturation points for solar system markets.
Technological innovations in solar systems are also pivotal. Advances in photovoltaic efficiency, energy storage, and smart grid integration are enhancing the viability of solar systems. The efficiency of a solar panel can be described by: $$ \eta = \frac{P_{\text{out}}}{A \times G} \times 100\% $$ where \( \eta \) is efficiency, \( P_{\text{out}} \) is power output, \( A \) is area, and \( G \) is solar irradiance. Current commercial solar systems achieve efficiencies of 15-22%, but research into perovskite and multi-junction cells promises higher values. Coupled with battery storage, solar systems can provide reliable power, addressing intermittency issues.
In the context of global energy demand, solar systems contribute to reducing carbon emissions. The total emissions saved by deploying solar systems can be estimated as: $$ E_{\text{saved}} = \sum_{i=1}^{n} (C_{\text{fossil},i} – C_{\text{solar},i}) \times EF_i $$ where \( C_{\text{fossil},i} \) and \( C_{\text{solar},i} \) are the energy outputs from fossil fuels and solar systems in region \( i \), and \( EF_i \) is the emission factor. As solar systems replace coal and gas, cumulative savings could reach gigatons of CO2 by 2030.
However, challenges remain for solar systems. Grid integration requires upgrades to handle variable output, and land use conflicts can arise for large-scale installations. From my experience, distributed solar systems on rooftops and buildings offer a solution, minimizing land impact. Additionally, recycling of solar panels at end-of-life is an emerging issue, necessitating circular economy approaches. The lifecycle analysis of solar systems involves evaluating impacts from manufacturing to decommissioning, often using formulas like: $$ \text{LCA score} = \sum_{j} w_j \times I_j $$ where \( w_j \) are weights for impact categories (e.g., carbon, water use) and \( I_j \) are inventory data.
Looking ahead, I foresee solar systems becoming ubiquitous. By 2022, solar photovoltaic capacity is expected to exceed the combined current capacity of India and Japan. This growth will be driven by continuous cost reductions, with solar system prices potentially falling below $20 per MWh in sunny regions. The convergence of solar systems with digital technologies, such as IoT and AI, will optimize energy management, enabling smart grids and microgrids. In maritime, solar-powered drones and autonomous ships could revolutionize logistics, further embedding solar systems into global trade.
To illustrate the comparative growth, here is a table projecting renewable energy capacity additions from 2016 to 2022, highlighting the dominance of solar systems.
| Year | Solar Systems Additions (GW) | Wind Additions (GW) | Hydro Additions (GW) | Other Renewables Additions (GW) | Total Renewable Additions (GW) |
|---|---|---|---|---|---|
| 2016 | 74 | 54 | 25 | 12 | 165 |
| 2017 | 85 | 50 | 20 | 10 | 165 |
| 2018 | 95 | 48 | 22 | 10 | 175 |
| 2019 | 110 | 45 | 20 | 10 | 185 |
| 2020 | 130 | 42 | 18 | 10 | 200 |
| 2021 | 150 | 40 | 15 | 10 | 215 |
| 2022 | 170 | 38 | 12 | 10 | 230 |
As shown, solar systems consistently lead in additions, reflecting their pivotal role. This trend is reinforced by investments in research and development for next-generation solar technologies. For example, tandem solar cells that stack multiple layers can achieve efficiencies over 30%, described by: $$ \eta_{\text{tandem}} = 1 – \prod_{i=1}^{n} (1 – \eta_i) $$ where \( \eta_i \) is the efficiency of each layer. Such innovations will sustain the momentum for solar systems.
In conclusion, from my vantage point, the energy transition is accelerating, with solar systems at its core. The maritime sector’s shift to low-sulfur fuels is just one part of a broader movement toward sustainability. Solar systems, with their rapid growth and declining costs, are not only transforming electricity generation but also enabling cross-sectoral decarbonization. I urge policymakers and industry leaders to embrace integrated solar systems, supported by robust grids and storage, to achieve a low-carbon future. The formula for success involves combining technological innovation, market incentives, and global cooperation—all centered around harnessing the power of solar systems for a cleaner planet.
Finally, I reflect on the interconnectedness of these trends. The adoption of solar systems in remote areas can reduce dependence on imported fuels, enhancing energy security. In urban settings, solar-integrated buildings contribute to smart city initiatives. The solar system paradigm is evolving from a niche technology to a mainstream solution, driven by economies of scale and environmental imperatives. As I continue to monitor this space, I am optimistic that solar systems will play an ever-increasing role in meeting global energy needs while mitigating climate change impacts.