
In modern applications such as transportation and aerospace, lithium ion batteries are subjected to various mechanical stresses, including vibration, which can significantly affect their performance and safety. As a researcher focused on battery safety, I have conducted a comprehensive study to understand how vibration influences the internal structure, cyclic aging mechanisms, electrical performance, and thermal runaway characteristics of lithium ion batteries. This article presents our findings based on experiments using 18650-type lithium ion batteries, with an emphasis on the coupling effects of vibration and cycling. The goal is to provide insights that can enhance the safety and reliability of lithium ion batteries in real-world scenarios.
The widespread adoption of lithium ion batteries is driven by their high energy density, long lifespan, and environmental benefits. However, safety remains a critical concern, especially under mechanical abuse conditions like vibration. In aerospace, lithium ion batteries are used for aircraft starting power and as cargo, while in electric vehicles, they face continuous vibration from road conditions. Previous studies have highlighted that vibration can lead to increased internal resistance, structural deformation, and accelerated aging. Yet, there is a lack of long-term vibration-cycling coupling experiments and detailed analyses of thermal stability. Our work aims to fill this gap by integrating multiple testing techniques, including computed tomography (CT) scanning, electrochemical impedance spectroscopy (EIS), and thermal runaway experiments.
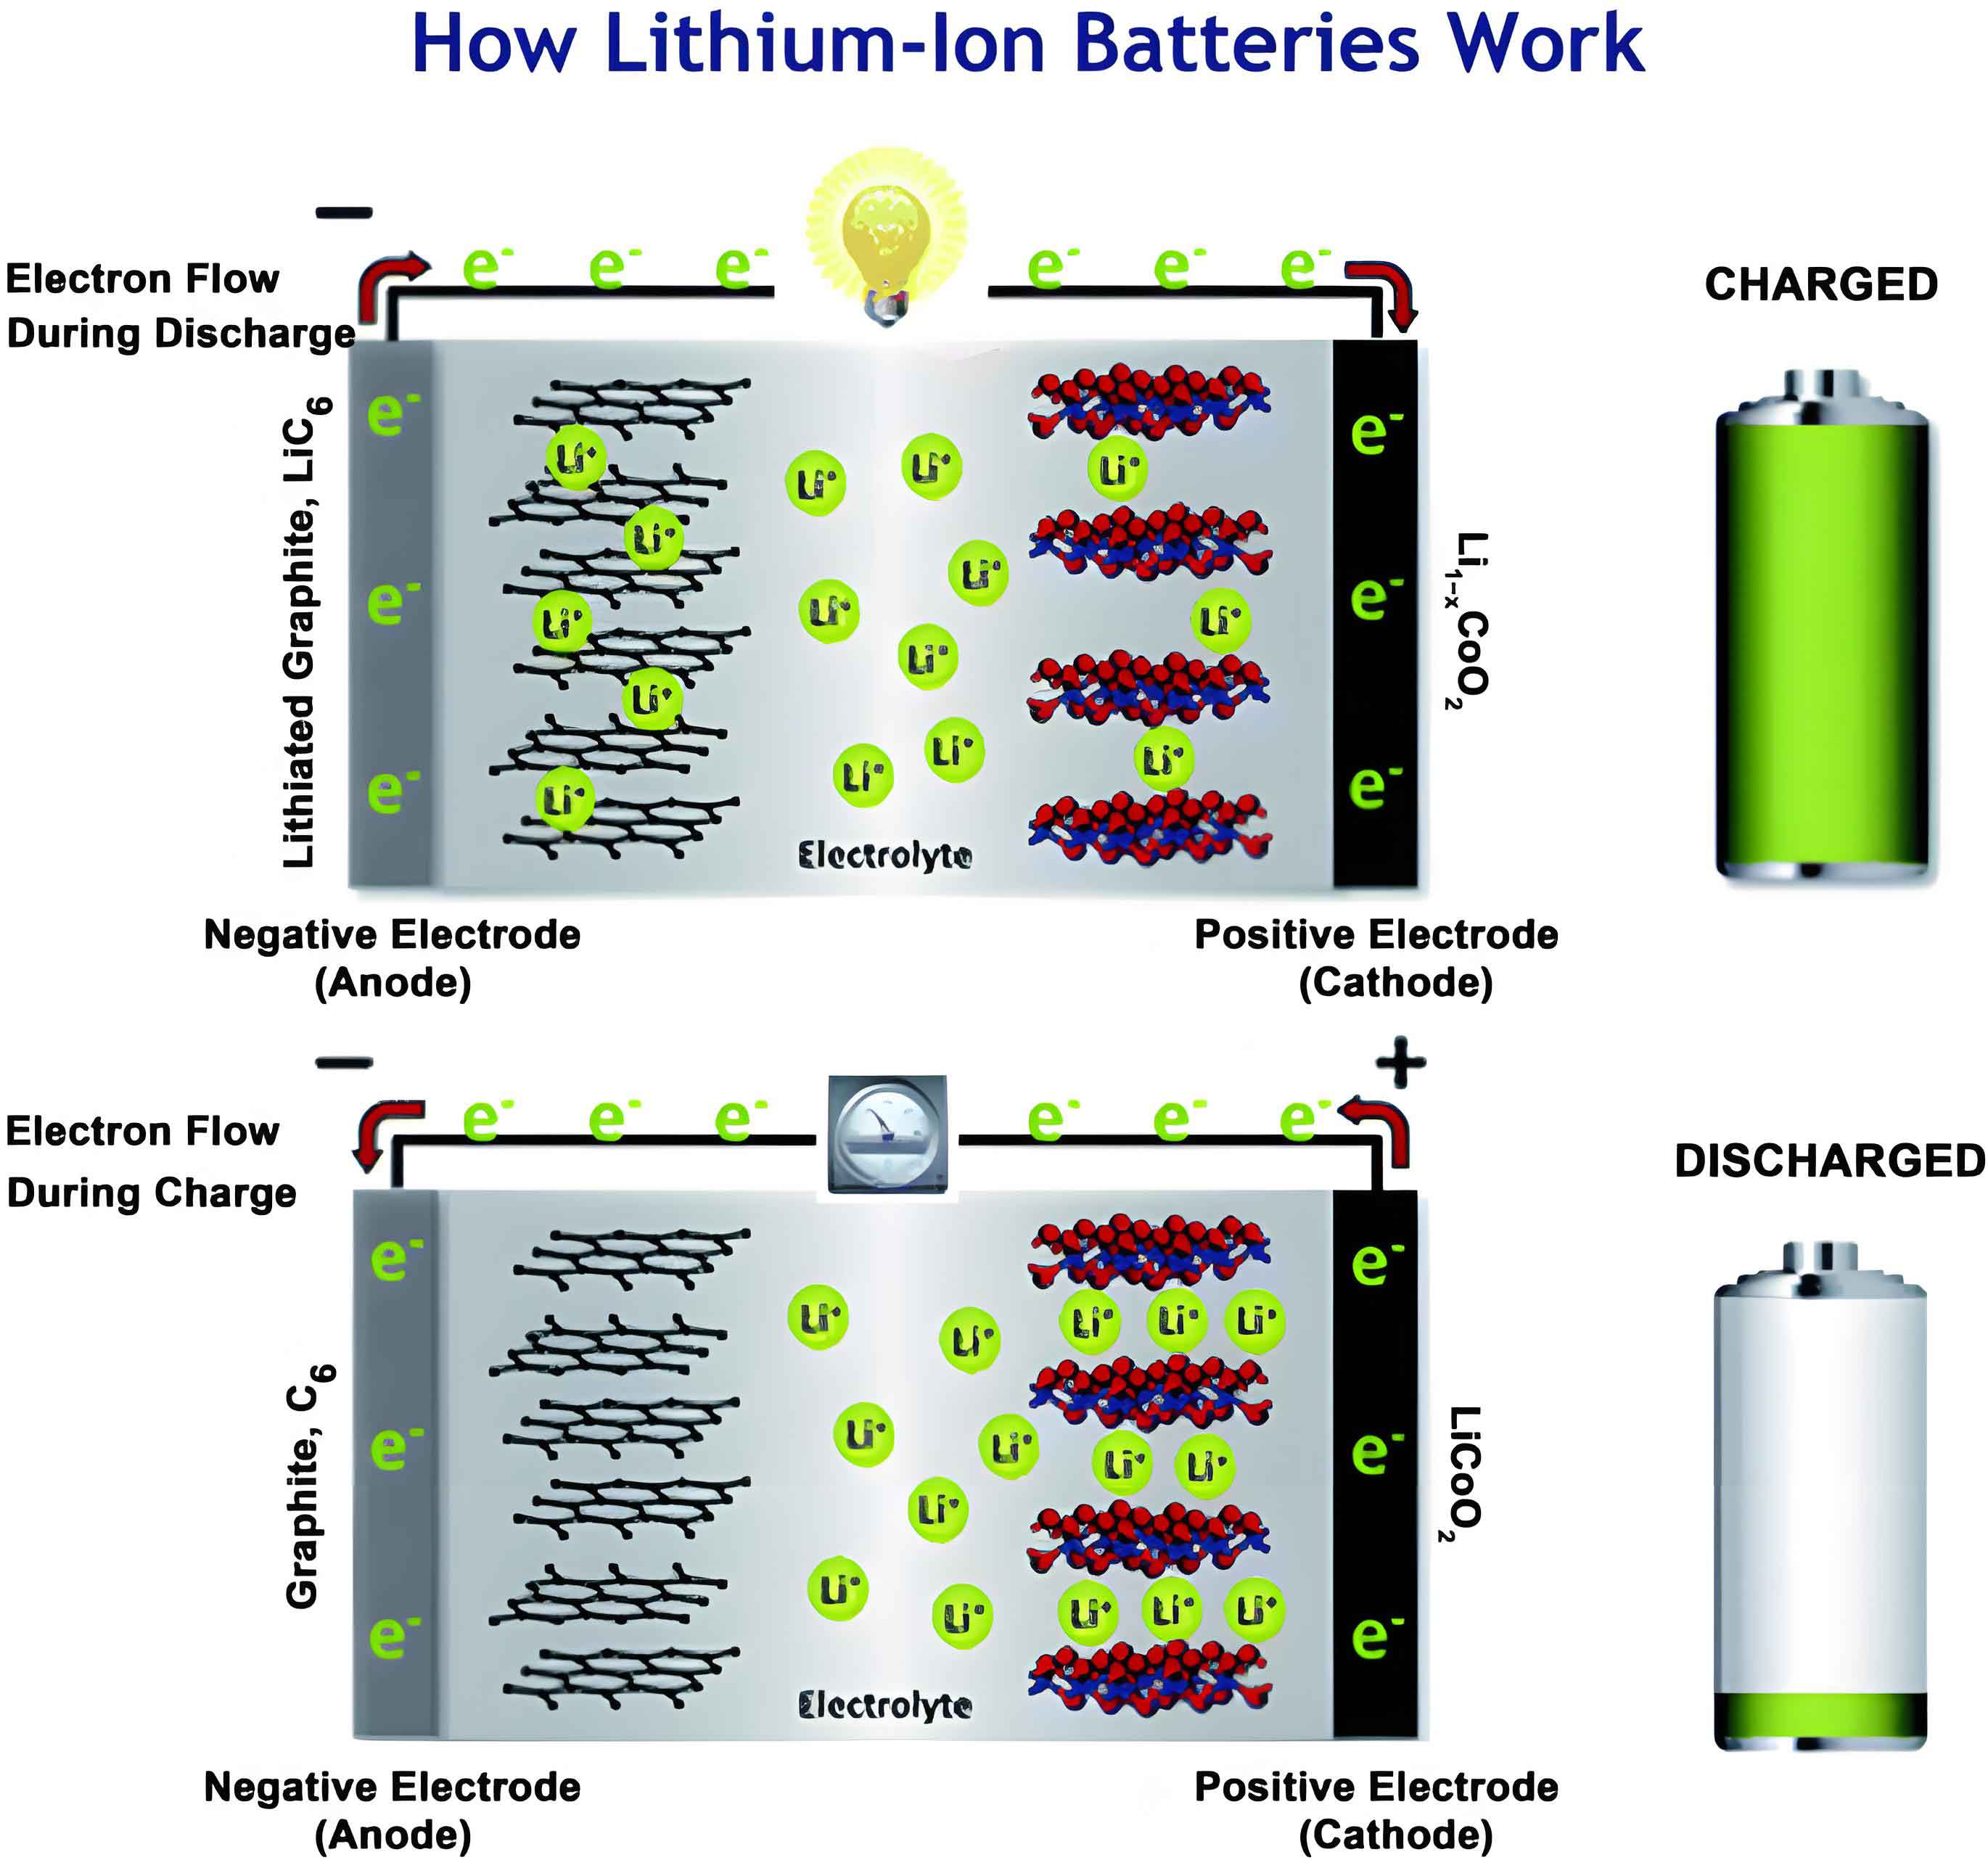
We selected commercial 18650 cylindrical lithium ion batteries with LiNi0.5Co0.2Mn0.3O2 as the cathode material and graphite as the anode material. The electrolyte consisted of LiPF6 in a mixture of ethyl methyl carbonate (EMC), ethylene carbonate (EC), and dimethyl carbonate (DMC). The nominal voltage was 3.6 V, with a capacity of 2200 mAh. To simulate real-world vibration conditions, we designed a vibration test platform based on the UN38.3 T3 standard, which covers a frequency range from 7 Hz to 200 Hz with varying acceleration amplitudes. The vibration parameters are summarized in Table 1.
| Frequency Range | Vibration Parameters | Duration per Axis (min) | Axes |
|---|---|---|---|
| 7–18 Hz | Acceleration: 1gn | 15 | Three-axis |
| 18 Hz to f1 (≈50 Hz) | Displacement: 0.8 mm (peak-to-peak 1.6 mm) | 15 | Three-axis |
| f1 to 200 Hz | Acceleration: 8gn | 15 | Three-axis |
We divided the lithium ion batteries into groups with vibration durations of 0, 100, 200, 300, 400, 500, and 600 hours. Each group contained multiple batteries to ensure statistical reliability. For the vibration-cycling coupling experiment, we simultaneously subjected lithium ion batteries to vibration and charge-discharge cycles at a 1C rate using a constant current-constant voltage (CC-CV) protocol. The cycling involved discharging to 2.75 V, resting for 10 minutes, charging to 4.2 V, and then holding at constant voltage until the current dropped below 50 mA. This process continued for 600 hours, equivalent to approximately 200 cycles, to observe aging effects.
To assess internal damage, we used X-ray CT scanning to visualize the structural changes in the lithium ion batteries without disassembly. This allowed us to examine critical components like the electrode roll, core shaft, current collectors, and safety valve. For electrochemical analysis, we performed EIS measurements over a frequency range of 0.1 to 1050 Hz, fitting the data to an equivalent circuit model to extract impedance parameters. The equivalent circuit, as shown in Figure 1, includes ohmic resistance (R1), charge transfer resistance (R2), and Warburg impedance (Rw), with a constant phase element (CPE) accounting for non-ideal capacitance.
Furthermore, we conducted thermal runaway experiments by externally heating the lithium ion batteries at 40 W in a sealed chamber equipped with thermocouples and pressure sensors. We recorded the surface temperature and internal pressure to identify the onset of initial explosion (venting) and combustion-induced explosion (full thermal runaway). This helped us evaluate how vibration affects the thermal stability of lithium ion batteries.
Our CT scan results revealed significant internal deformation in the lithium ion batteries after long-term vibration. As shown in Table 2, vibration caused the negative current collector to loosen and deform, exerting compressive stress on the electrode roll. In contrast, non-vibrated batteries showed minimal changes. The deformation was more pronounced in the transverse direction, with multiple wrinkles observed near the core shaft, and extended longitudinally, affecting a larger area of the electrode layers. This structural damage can be attributed to the accumulation of mechanical stress over time, which alters the microstructural integrity of the lithium ion battery components.
| Vibration Time (hours) | Observed Damage | Severity |
|---|---|---|
| 0 | Minor wrinkles near core shaft | Low |
| 100–300 | Current collector loosening, electrode roll compression | Moderate |
| 400–600 | Significant deformation, multi-layer wrinkling | High |
The EIS analysis provided insights into the electrochemical changes in the lithium ion batteries. The Nyquist plots showed that as vibration time increased, the semicircle diameter expanded initially, indicating an increase in charge transfer resistance. After 400 hours, the ohmic resistance rose significantly. We fitted the EIS data to the equivalent circuit and calculated the impedance values, as presented in Table 3. The trends suggest that vibration up to 400 hours primarily affects the solid electrolyte interface (SEI) layer and charge transfer processes, while prolonged vibration beyond 400 hours leads to contact failure and increased ohmic resistance. This can be modeled using the following equation for total impedance (Z) of a lithium ion battery:
$$ Z = R_1 + \frac{R_2}{1 + (j\omega R_2 CPE)^\alpha} + R_w $$
where ω is the angular frequency, and α is the dispersion factor of the CPE. The increase in R1 and R2 with vibration time highlights the degradation in ionic and electronic conductivity within the lithium ion battery.
| Vibration Time (hours) | R1 (Ω) | R2 (Ω) | Rw (Ω) |
|---|---|---|---|
| 0 | 0.010 | 0.025 | 0.030 |
| 100 | 0.011 | 0.028 | 0.031 |
| 200 | 0.012 | 0.032 | 0.032 |
| 300 | 0.013 | 0.035 | 0.033 |
| 400 | 0.020 | 0.030 | 0.034 |
| 500 | 0.022 | 0.028 | 0.035 |
| 600 | 0.025 | 0.026 | 0.036 |
In terms of cyclic performance, the vibration-cycling coupling led to notable fluctuations in the electrical output of the lithium ion batteries. The discharge capacity under vibration was lower than that under static conditions, especially in the early cycles, as shown in Table 4. This is due to the dynamic changes in contact area between electrode materials and the separator, which impede lithium ion migration during charge and discharge. The Coulombic efficiency (CE) and energy efficiency (EE) were calculated using the following formulas:
$$ \text{CE} = \frac{C_{\text{discharge}}}{C_{\text{charge}}} \times 100\% $$
$$ \text{EE} = \frac{E_{\text{discharge}}}{E_{\text{charge}}} \times 100\% $$
where Cdischarge and Ccharge are the discharge and charge capacities, and Edischarge and Echarge are the corresponding energies. Under vibration, CE varied between 96.72% and 103.83%, showing high dispersion, while EE decreased by up to 6.27% with greater instability. This indicates that vibration introduces randomness in the lithium ion battery’s energy conversion processes, reducing reliability.
| Condition | Average Discharge Capacity (Ah) | Coulombic Efficiency Range (%) | Energy Efficiency at 200 cycles (%) |
|---|---|---|---|
| Static Cycling | 1.95 | 98.5–101.2 | 90.1 |
| Vibration-Cycling | 1.80 | 96.7–103.8 | 84.8 |
The capacity retention rate, defined as the ratio of capacity after n cycles to the initial capacity, further illustrated the aging differences. After 200 cycles, static lithium ion batteries retained 83.44% capacity, while vibrated ones retained 84.77%. However, the retention rate curves crossed around 140 cycles, suggesting that vibration initially accelerates degradation but later may cause compressive effects that temporarily mitigate loss of active lithium ions. This complex behavior underscores the need for models that account for mechanical stress in lithium ion battery aging. We propose a simplified aging model for a lithium ion battery under vibration:
$$ \frac{dQ}{dt} = -k_1 \cdot S_v – k_2 \cdot \sigma $$
where Q is the capacity, t is time, k1 and k2 are degradation rate constants, Sv is the vibration stress intensity, and σ is the mechanical strain. This equation highlights how vibration stress contributes to capacity fade in lithium ion batteries.
Thermal runaway experiments revealed that vibration significantly compromises the safety of lithium ion batteries. As vibration time increased, the time to trigger both initial explosion and combustion-induced explosion decreased. Table 5 summarizes the thermal runaway characteristics. For instance, lithium ion batteries vibrated for 600 hours had an initial explosion time 72 seconds earlier and a combustion-induced explosion time 114 seconds earlier than non-vibrated batteries. The interval between these events also shortened, indicating faster progression to catastrophic failure. The pressure peaks during combustion-induced explosion were highly variable, with some vibrated lithium ion batteries exceeding 0.3 MPa, compared to around 0.25 MPa for non-vibrated ones. This instability in pressure release poses additional risks in confined spaces.
| Vibration Time (hours) | Initial Explosion Time (s) | Combustion-Induced Explosion Time (s) | Interval (s) | Peak Pressure (MPa) |
|---|---|---|---|---|
| 0 | 718 | 921 | 203 | 0.25 |
| 100 | 709 | 900 | 191 | 0.26 |
| 200 | 705 | 881 | 176 | 0.31 |
| 300 | 663 | 825 | 162 | 0.27 |
| 400 | 659 | 822 | 163 | 0.32 |
| 500 | 653 | 813 | 160 | 0.25 |
| 600 | 646 | 807 | 161 | 0.26 |
The temperature profiles during thermal runaway followed a similar pattern, with initial explosion temperatures ranging from 176°C to 186°C and combustion-induced explosion temperatures from 615°C to 695°C across all groups. The reduced thermal stability can be attributed to structural weaknesses induced by vibration, such as micro-cracks in the electrodes, which facilitate faster heat generation and propagation. To quantify this, we can use the Arrhenius equation modified for vibration effects:
$$ k = A \exp\left(-\frac{E_a}{RT}\right) \cdot (1 + \beta V) $$
where k is the reaction rate constant, A is the pre-exponential factor, Ea is the activation energy, R is the gas constant, T is the temperature, β is a vibration coefficient, and V is the vibration intensity. This model suggests that vibration accelerates the exothermic reactions in a lithium ion battery during thermal runaway.
In conclusion, our study demonstrates that vibration has profound effects on the performance and safety of lithium ion batteries. The internal structure of lithium ion batteries is susceptible to deformation, particularly in the current collectors and electrode rolls, leading to increased impedance and fluctuating electrical efficiencies. Long-term vibration also advances the onset of thermal runaway, reducing the time available for safety interventions. These findings emphasize the importance of incorporating vibration resistance into lithium ion battery design, such as through robust casing, damping materials, and optimized electrode assembly. Future work should focus on developing predictive models that integrate mechanical, electrical, and thermal aspects to enhance the durability of lithium ion batteries in vibrating environments. By addressing these challenges, we can improve the safety and reliability of lithium ion batteries across aerospace, automotive, and other critical applications.