
The global pursuit of “carbon neutrality” and “peak carbon” has fundamentally reshaped the energy landscape, driving the massive integration of renewable sources like wind and solar into power grids. To mitigate their inherent intermittency and ensure grid stability, advanced energy storage systems (ESS) have become indispensable. Among various technologies, the li ion battery stands out due to its superior characteristics: high energy density, flexible power capability, fast response, and excellent round-trip efficiency. Consequently, it has emerged as the most dominant and rapidly advancing electrochemical energy storage technology. However, the performance of a li ion battery inevitably degrades over prolonged use through complex electrochemical mechanisms such as solid electrolyte interphase (SEI) layer growth, lithium plating, and active material loss. This degradation not only reduces capacity and power but also raises significant safety concerns, including risks of thermal runaway, internal short circuits, and electrolyte leakage. Therefore, accurate and reliable State of Health (SOH) estimation is paramount for Battery Management Systems (BMS) to ensure safe operation, optimize usage strategies, schedule timely maintenance, and extend the overall lifespan of li ion battery packs in stationary storage and electric vehicles.
SOH is a key metric quantifying the aging level of a battery, typically defined as the ratio of its current maximum available capacity to its nominal capacity. A direct measurement of SOH is impractical in real-time operation. Thus, estimation methods are essential. Existing approaches are broadly categorized into model-based and data-driven methods. Model-based techniques, such as Equivalent Circuit Models (ECMs) and electrochemical models, rely on identifying physical parameters. While ECMs use networks of resistors and capacitors to simulate terminal behavior, their parameters often exhibit complex, non-linear relationships with aging, making precise identification challenging. Electrochemical models, based on partial differential equations (PDEs) describing internal ion transport and reactions, are physically accurate but computationally prohibitive for real-time BMS applications. In contrast, data-driven methods bypass complex physical modeling. They learn the intricate mapping between easily measurable operational parameters (health indicators) and the battery’s SOH directly from historical cycling data. This approach offers strong flexibility and adaptability but critically depends on the selection of representative health features and the proper configuration of the learning model’s parameters. Poor feature selection or suboptimal model parameters can lead to significant estimation errors and poor generalization.
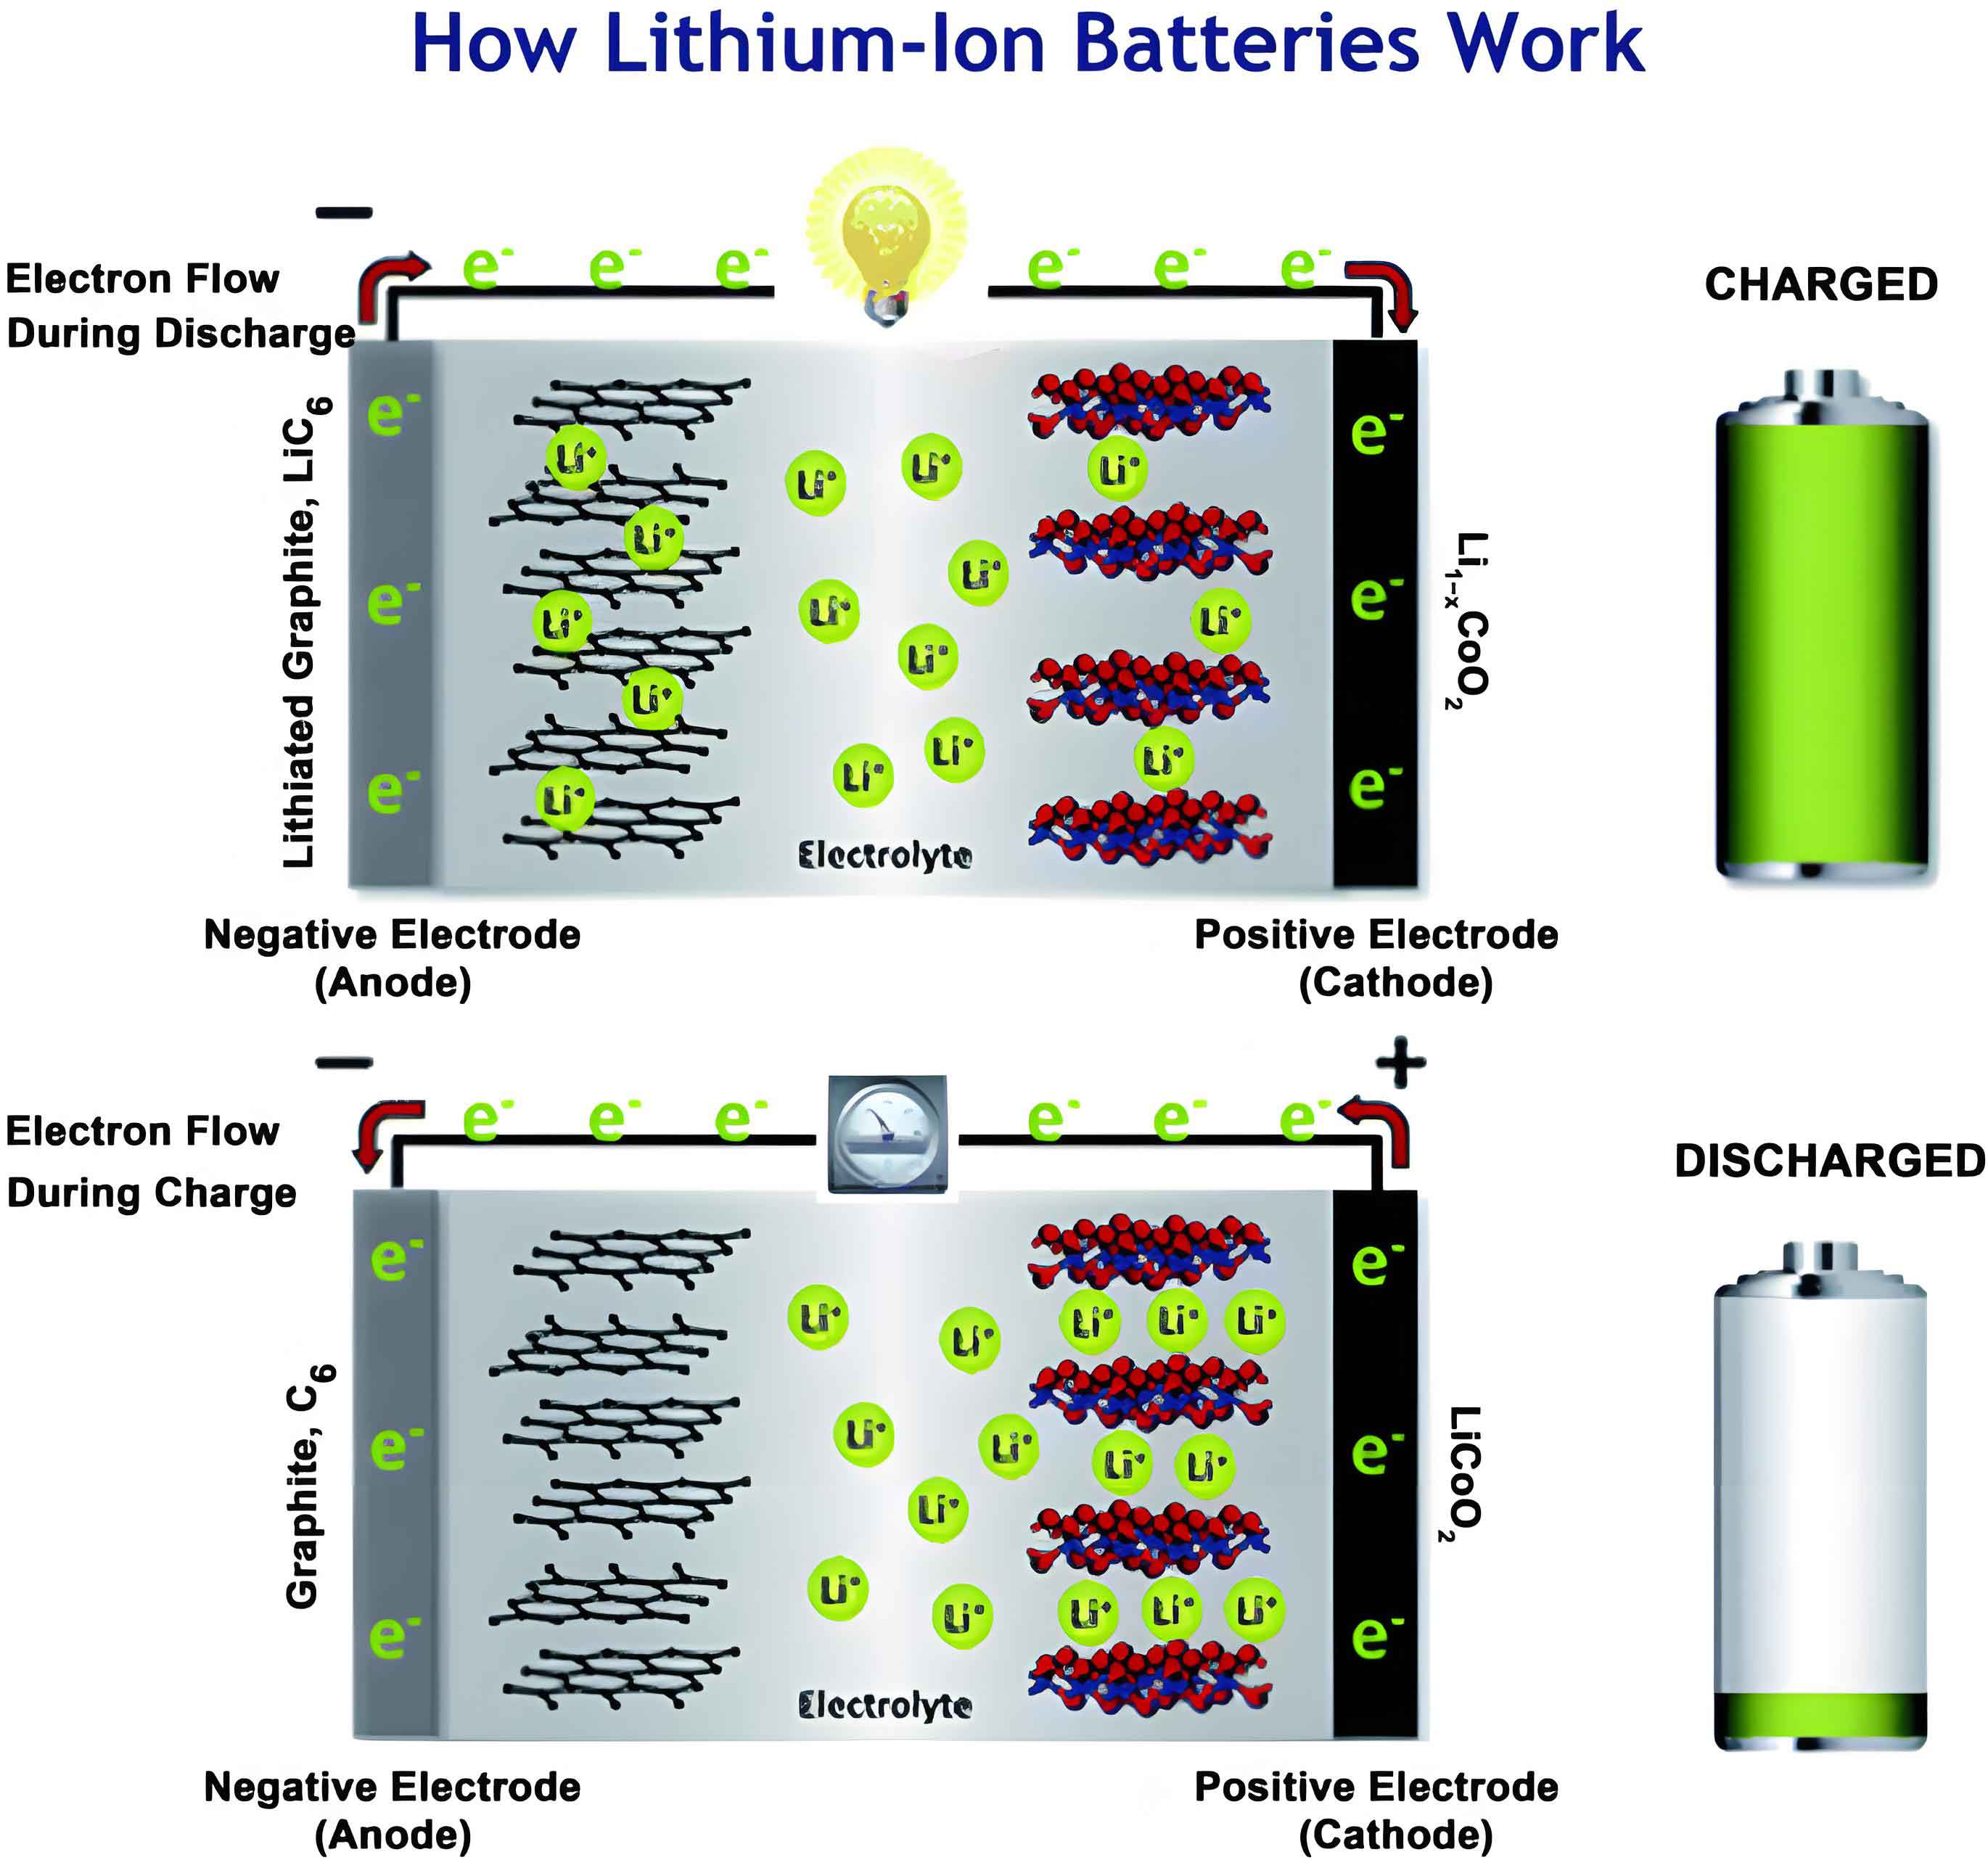
To address the limitations of low accuracy and instability in traditional methods, this article explores and advocates for an advanced data-driven framework. The core proposition is a hybrid model that synergistically combines a novel metaheuristic optimization algorithm with a fast neural network for superior li ion battery SOH estimation. The process begins with the intelligent selection of health features from routine charge-discharge data. Subsequently, an Extreme Learning Machine (ELM) model is employed to establish the non-linear mapping. Finally, to overcome the randomness and instability inherent in standard ELM, the Pelican Optimization Algorithm (POA) is leveraged to meticulously optimize the ELM’s critical internal parameters. This integrated POA-ELM approach aims to deliver highly accurate, robust, and generalizable SOH estimates.
Foundational Algorithms and Methodology
The Pelican Optimization Algorithm (POA)
The Pelican Optimization Algorithm is a recent nature-inspired metaheuristic that mimics the hunting strategy of pelicans. This strategy consists of two distinct phases: moving towards the prey (exploration) and flying on the water surface to scoop fish (exploitation). The mathematical modeling of these phases enables POA to effectively balance global search and local refinement, making it a powerful tool for optimizing complex problems, such as tuning the parameters of a neural network for li ion battery SOH prediction.
1. Initialization: The algorithm starts by randomly generating a population of pelicans (potential solutions) within the search space boundaries. For a problem with dimension $m$, the position of the $i$-th pelican is represented as $X_i = [x_{i,1}, x_{i,2}, …, x_{i,m}]$. The entire population matrix $X$ and the corresponding objective function values $F$ are initialized.
2. Phase 1: Exploration (Moving Towards Prey): In this phase, pelicans identify the location of the prey and move towards that region. This behavior promotes exploration of the search space. The new position is updated according to:
$$x^{P1}_{i,j} = \begin{cases} x_{i,j} + rand \cdot (p_j – I \cdot x_{i,j}), & \text{if } F_p < F_i \\ x_{i,j} + rand \cdot (x_{i,j} – p_j), & \text{otherwise} \end{cases}$$
where $x^{P1}_{i,j}$ is the new position, $p_j$ is the prey’s position in dimension $j$, $F_p$ is the prey’s objective value, $rand$ is a random number in [0,1], and $I$ is a random integer (1 or 2). The position is updated only if the objective function improves.
3. Phase 2: Exploitation (Wing Flying on Water Surface): After reaching the water surface, pelicans spread their wings to herd fish and then scoop them up. This local hunting strategy is mathematically modeled to enhance convergence:
$$x^{P2}_{i,j} = x_{i,j} + R \cdot (1 – \frac{t}{T}) \cdot (2 \cdot rand – 1) \cdot x_{i,j}$$
Here, $R$ is a random number (0 or 2), $t$ is the current iteration, and $T$ is the maximum iteration. The term $R(1 – t/T)$ acts as an adaptive neighborhood radius, which shrinks as iterations progress, allowing the algorithm to take finer, more precise steps towards the optimal solution near the end of the search process. This ensures effective local exploitation.
Extreme Learning Machine (ELM)
Extreme Learning Machine is a single-hidden-layer feedforward neural network known for its extremely fast learning speed. Unlike traditional gradient-based neural networks, ELM randomly assigns weights and biases for the input layer and hidden layer. The output weights are then calculated analytically using a least-squares method, avoiding iterative tuning. For $N$ arbitrary samples $(x_i, t_i)$, where $x_i \in R^n$ and $t_i \in R^m$, the standard ELM with $L$ hidden neurons is modeled as:
$$\sum_{i=1}^{L} \beta_i g(w_i \cdot x_j + b_i) = o_j, \quad j=1,…,N$$
where $g(\cdot)$ is the activation function, $w_i$ is the input weight vector, $b_i$ is the hidden layer bias, and $\beta_i$ is the output weight vector. The model can be written compactly as $H \beta = T$, where $H$ is the hidden layer output matrix. The optimal output weights $\hat{\beta}$ are obtained via the Moore-Penrose generalized inverse: $\hat{\beta} = H^{\dagger}T$. While this grants ELM remarkable speed, the random initialization of $w_i$ and $b_i$ can lead to non-optimal solutions and unstable performance, especially for regression tasks like li ion battery SOH estimation.
The Integrated POA-ELM Model for SOH Estimation
The proposed hybrid model strategically integrates POA and ELM to mitigate the randomness of ELM. In this framework, the parameters to be optimized by POA are the input weights and hidden layer biases ($w_i, b_i$) of the ELM network. The POA searches for the optimal set of these parameters that minimizes the error between the ELM’s predicted SOH and the actual SOH on the training data. The mean squared error (MSE) is used as the fitness function for POA:
$$MSE = \frac{1}{N} \sum_{i=1}^{N} (\hat{y}_i – y_i)^2$$
where $\hat{y}_i$ is the estimated SOH and $y_i$ is the actual SOH for the $i$-th cycle.
The workflow of the POA-ELM model for li ion battery SOH estimation is as follows:
- Data Processing: Raw feature data (e.g., time intervals, voltage, current) are extracted from charge-discharge cycles and normalized to a [0,1] range to ensure equal scaling: $x_{norm} = (x – x_{min})/(x_{max} – x_{min})$.
- POA Initialization: POA parameters (population size, maximum iterations, search boundaries) are set. The “prey” corresponds to a candidate set of ELM parameters ($w_i, b_i$).
- Fitness Evaluation: For each pelican (parameter set), an ELM model is constructed, trained on the normalized training data, and its performance is evaluated using the MSE on the training set. This MSE is the fitness value for that pelican.
- POA Optimization: The POA executes its exploration and exploitation phases over multiple iterations to evolve the population of pelicans (parameter sets), continually seeking the configuration that yields the lowest MSE.
- SOH Estimation: Once POA converges, the optimal parameters are used to configure the final ELM model. This model is then used with test data to estimate the SOH of the li ion battery.
Health Feature Analysis and Selection
The efficacy of any data-driven model hinges on the quality of its input features. For li ion battery SOH estimation, the features must be easily measurable during standard operation and must strongly correlate with the underlying capacity degradation. This study analyzes data from the publicly available NASA PCoE li ion battery dataset (cells B005, B006, B007, B018). The SOH is defined based on capacity fade:
$$SOH = \frac{C_i}{C_0} \times 100\%$$
where $C_i$ is the discharge capacity at cycle $i$ and $C_0$ is the initial nominal capacity (2 Ah).
By analyzing the charge-discharge voltage, current, and temperature profiles, four health features (HFs) are identified that change consistently with aging:
| Health Feature (HF) | Description | Rationale |
|---|---|---|
| HF1: Constant Voltage Rise Time | Duration for voltage to rise from 3.8V to 4.2V during the constant current (CC) charge phase. | As the battery ages, internal resistance increases, causing the voltage to rise faster during CC charging, thus shortening this time interval. It correlates highly with capacity loss. |
| HF2: Constant Current Drop Time | Duration for charge current to drop from 1.6A to 0.5A during the constant voltage (CV) charge phase. | The CV phase shortens with aging as the battery accepts less charge. This selected segment of the current profile is a sensitive indicator of this change. |
| HF3: Constant Voltage Drop Time | Duration for voltage to drop from 4.0V to 3.6V during the constant current discharge phase. | Aging increases polarization, leading to a faster voltage drop under a fixed discharge current. This reduces the time the voltage stays within a specific high-voltage window, directly related to available energy. |
| HF4: Discharge Temperature Peak Time | The time elapsed from the start of discharge until the battery temperature reaches its maximum value. | Increased internal resistance in aged batteries leads to faster heat generation, causing the temperature peak to occur earlier in the discharge cycle. |
To quantify the strength of the linear relationship between each proposed health feature and the SOH, Pearson correlation analysis is performed. The Pearson correlation coefficient $r$ between a feature $X$ and SOH $Y$ is calculated as:
$$r_{X,Y} = \frac{\sum_{i=1}^{n} (X_i – \bar{X})(Y_i – \bar{Y})}{\sqrt{\sum_{i=1}^{n} (X_i – \bar{X})^2} \sqrt{\sum_{i=1}^{n} (Y_i – \bar{Y})^2}}$$
where $n$ is the number of cycles. An absolute value of $|r| > 0.8$ indicates a very strong correlation. The results for the four battery cells are summarized below, confirming that all selected features are excellent health indicators.
| Cell ID | HF1 (r) | HF2 (r) | HF3 (r) | HF4 (r) |
|---|---|---|---|---|
| B005 | 0.9933 | -0.9854 | 0.9967 | 0.9971 |
| B006 | 0.9907 | -0.9710 | 0.9945 | 0.9878 |
| B007 | 0.9912 | -0.9234 | 0.9854 | 0.9915 |
| B018 | 0.9940 | -0.9512 | 0.9836 | 0.9812 |
Experimental Validation and Comparative Analysis
The proposed POA-ELM method is rigorously validated using the NASA dataset. For each battery (B005, B006, B007, B018), the first 60% of cycle data are used for model training and parameter optimization, while the remaining 40% are reserved for testing. The performance of POA-ELM is compared against three benchmark models: the standard ELM (with random parameters), Particle Swarm Optimization-ELM (PSO-ELM), and Genetic Algorithm-ELM (GA-ELM). This comparison evaluates the specific contribution of the POA optimizer. Three standard metrics are used for quantitative evaluation:
- Mean Absolute Error (MAE): $MAE = \frac{1}{n}\sum_{i=1}^{n} |\hat{y}_i – y_i|$
- Root Mean Square Error (RMSE): $RMSE = \sqrt{\frac{1}{n}\sum_{i=1}^{n} (\hat{y}_i – y_i)^2}$
- Coefficient of Determination (R²): $R^2 = 1 – \frac{\sum_{i=1}^{n} (\hat{y}_i – y_i)^2}{\sum_{i=1}^{n} (y_i – \bar{y})^2}$
Lower MAE and RMSE values indicate higher accuracy, while an R² value closer to 1 signifies a better fit to the actual SOH degradation trend.
The comparative results across all four li ion battery cells are consolidated in the table below. The superiority of the POA-ELM model is unequivocally demonstrated.
| Cell ID | Model | MAE | RMSE | R² |
|---|---|---|---|---|
| B005 | POA-ELM | 0.3459 | 0.4792 | 0.9715 |
| PSO-ELM | 0.6854 | 0.8728 | 0.9057 | |
| GA-ELM | 0.7925 | 0.8604 | 0.9083 | |
| ELM | 1.7694 | 1.9733 | 0.5174 | |
| B006 | POA-ELM | 0.3246 | 0.4453 | 0.9876 |
| PSO-ELM | 0.8876 | 1.1963 | 0.9102 | |
| GA-ELM | 0.9183 | 1.0412 | 0.9102 | |
| ELM | 1.5862 | 2.1536 | 0.7091 | |
| B007 | POA-ELM | 0.1981 | 0.2418 | 0.9901 |
| PSO-ELM | 0.6311 | 0.7684 | 0.9003 | |
| GA-ELM | 0.6941 | 0.8757 | 0.8705 | |
| ELM | 1.0874 | 1.3209 | 0.7052 | |
| B018 | POA-ELM | 0.3756 | 0.5361 | 0.8976 |
| PSO-ELM | 0.8640 | 1.0978 | 0.5706 | |
| GA-ELM | 0.5079 | 0.7237 | 0.8134 | |
| ELM | 0.9522 | 1.1624 | 0.5172 |
The analysis of the results reveals several key insights:
- Superior Accuracy: POA-ELM achieves the lowest MAE and RMSE across all test cells. For instance, compared to the basic ELM, it reduces the MAE by up to 81.78% (B007) and the RMSE by up to 81.69% (B007). This substantial improvement directly stems from POA’s effective search for the optimal ELM parameters, which the random, PSO, and GA-based methods fail to find as efficiently.
- Enhanced Stability and Fit: The R² values for POA-ELM are consistently the highest and very close to 1 (e.g., 0.9901 for B007), indicating its estimations almost perfectly trace the actual SOH degradation curve, including subtle nonlinearities and capacity regeneration “bumps.” The competing models show significant deviation, especially in the later stages of life.
- Generalization Capability: The POA-ELM model maintains high performance across four different li ion battery cells with slightly different end-of-discharge voltage thresholds, demonstrating its robustness and generalization ability. The estimation error remains stable within 2% throughout the entire testing range for all cells.
- Optimizer Performance: While PSO-ELM and GA-ELM show marked improvement over the standard ELM, their performance is still inferior to POA-ELM. This suggests that the two-phase hunting strategy of POA provides a better balance of exploration and exploitation in the high-dimensional parameter space of the ELM, leading to a more optimal and stable configuration.
Conclusion and Future Perspectives
Accurate State of Health estimation remains a critical challenge for ensuring the reliability, safety, and economic viability of li ion battery energy storage systems. This article has presented a comprehensive framework addressing this challenge through an intelligent data-driven hybrid model. The proposed POA-ELM method systematically combines feature engineering, advanced optimization, and fast neural computation. By extracting highly correlated health features from operational data and employing the novel Pelican Optimization Algorithm to meticulously tune the Extreme Learning Machine, the model achieves a significant leap in estimation accuracy, stability, and generalizability compared to conventional and other optimized data-driven approaches.
The experimental validation on a standard public dataset confirms that the POA-ELM model can estimate li ion battery SOH with errors consistently below 2%, faithfully tracking the complex capacity fade trajectory. The superior performance over PSO-ELM and GA-ELM highlights the efficacy of the POA’s search mechanism for this specific optimization problem. For practical BMS implementation, the next steps involve testing the model under dynamic, real-world load profiles, exploring incremental learning techniques to adapt to diverse aging conditions, and potentially integrating this SOH estimator with other state estimators (like SOC) within a unified BMS architecture. The principles demonstrated here—intelligent feature selection coupled with metaheuristic-optimized machine learning—provide a powerful and promising pathway toward more reliable and smarter management of li ion battery systems across various applications.