
In the pursuit of sustainable transportation, electric vehicles powered by lithium-ion batteries have emerged as a pivotal solution to address energy and environmental challenges. The performance, safety, and longevity of these lithium-ion batteries are critically dependent on effective thermal management. During charge and discharge cycles, lithium-ion batteries generate significant heat due to Joule heating and electrochemical reactions. If not properly dissipated, this heat accumulation can lead to capacity fade, accelerated aging, and even thermal runaway, posing serious safety risks. Therefore, designing an efficient battery thermal management system (BTMS) is paramount to maintain lithium-ion batteries within their optimal operating temperature range of 20–40°C and ensure temperature uniformity, typically with a maximum temperature difference below 5°C.
Among various cooling methods, liquid cooling BTMS has gained widespread adoption in the automotive industry due to its superior heat dissipation capability, moderate cost, and reliability. The core component of such a system is the liquid cooling plate, which directly interfaces with the battery cells to remove heat. Traditional channel-based cooling plates, such as straight or serpentine channels, often suffer from high pressure drops and poor temperature uniformity, leading to increased pumping power and reduced battery life. To overcome these limitations, topology optimization offers a systematic and automated approach to design cooling channel layouts that simultaneously minimize thermal resistance and fluid flow resistance. This study leverages multi-objective topology optimization to develop advanced liquid cooling plates for lithium-ion battery packs. We investigate the impact of various inlet and outlet configurations on the optimized designs and compare the performance with conventional straight-channel plates, providing new insights for enhancing BTMS efficiency.
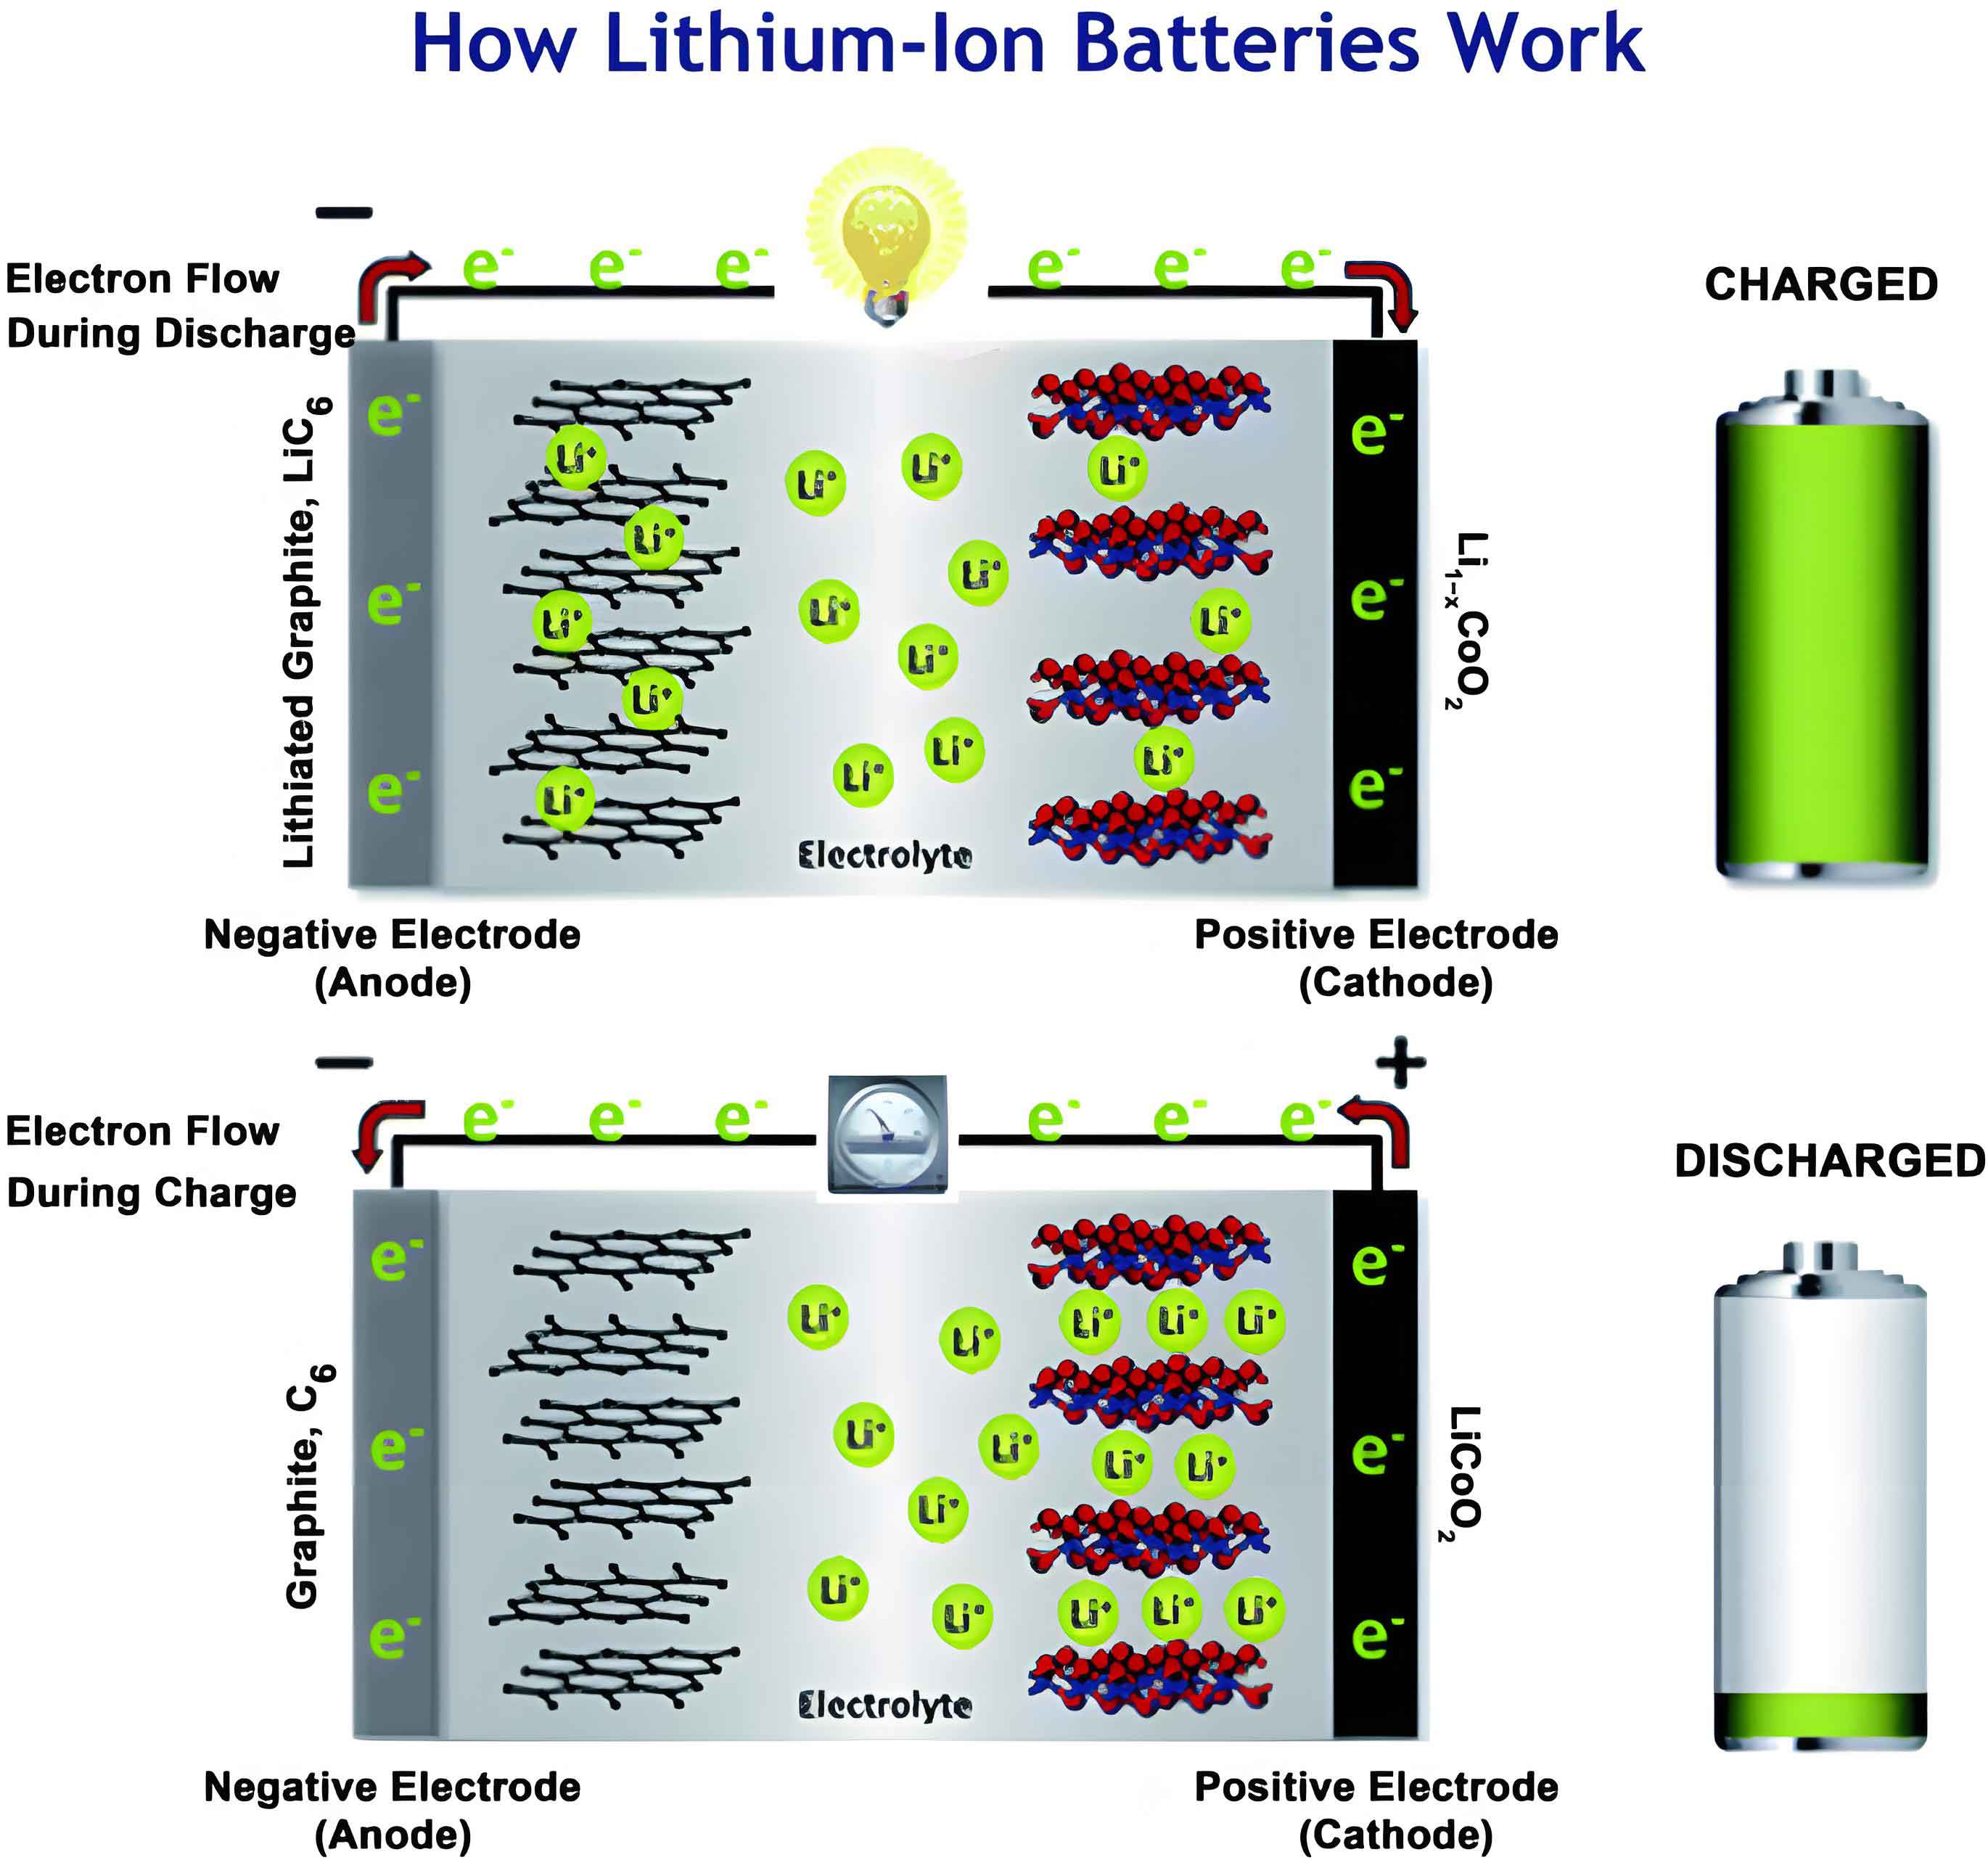
The foundation of any thermal analysis for lithium-ion batteries lies in accurately modeling their heat generation. Based on the Bernardi heat generation model, the total heat produced during discharge consists of irreversible Joule heating and reversible entropic heat. The heat generation rate \( Q \) can be expressed as:
$$ Q = I^2 R_j + I T \left( \frac{\partial U_{\text{ocv}}}{\partial T} \right) $$
where \( I \) is the current, \( R_j \) is the Joule internal resistance, \( T \) is the temperature, and \( U_{\text{ocv}} \) is the open-circuit voltage. Under adiabatic conditions, the heat generated equals the heat absorbed by the battery, leading to:
$$ m c_p \frac{dT}{dt} = I^2 R_j + I T \left( \frac{\partial U_{\text{ocv}}}{\partial T} \right) $$
Here, \( m \) is the mass, \( c_p \) is the specific heat capacity, and \( t \) is time. For a specific lithium-ion battery with a capacity of 30 Ah, mass of 0.55 kg, and internal resistance of 2 mΩ, experimental data from temperature rise tests under various discharge currents were used to calibrate the model. By plotting \( (1/I)(dT/dt) \) versus \( I \), a linear relationship was derived, allowing the calculation of \( c_p \) as 864 J/(kg·K). The final volumetric heat generation rate \( q \) for the lithium-ion battery is given by:
$$ q = \frac{Q}{V} = 8.13 I^2 + 287.78 I $$
where \( V \) is the battery volume. This model enables the prediction of heat generation at different discharge rates, such as 3C, which is used as the thermal load in this study.
To design the liquid cooling plate, we employ the variable density topology optimization method. This approach discretizes the design domain into finite elements and assigns each element a pseudo-density \( \gamma \) ranging from 0 to 1, where \( \gamma = 1 \) represents fluid (coolant) and \( \gamma = 0 \) represents solid (plate material). The goal is to find the optimal distribution of material that minimizes objective functions while satisfying constraints. The design domain for the cooling plate is a rectangular area of 200 mm × 130 mm, corresponding to the surface of a typical lithium-ion battery cell. A non-designable border of 2 mm is included to prevent channels from intersecting the edges, resulting in a total size of 204 mm × 134 mm. The fluid flow and heat transfer in this domain are governed by the conjugate heat transfer equations, adapted for the porous medium analogy used in topology optimization.
The governing equations for steady-state flow and heat transfer in the design domain are as follows. The energy conservation equation is:
$$ \rho(\gamma) C_p(\gamma) (\mathbf{u} \cdot \nabla T) = \nabla \cdot (k(\gamma) \nabla T) + Q $$
The continuity equation is:
$$ \nabla \cdot \mathbf{u} = 0 $$
The momentum conservation equation is:
$$ \rho(\gamma) (\mathbf{u} \cdot \nabla) \mathbf{u} = -\nabla P + \mu \nabla^2 \mathbf{u} + \mathbf{F} $$
where \( \mathbf{u} \) is the velocity vector, \( P \) is the pressure, \( \mu \) is the dynamic viscosity, and \( \mathbf{F} \) is the volume force term representing the friction in the porous medium, defined as \( \mathbf{F} = -\alpha(\gamma) \mathbf{u} \). The inverse permeability \( \alpha(\gamma) \) controls the fluid-solid distribution and is interpolated using the Brinkman penalty model:
$$ \alpha(\gamma) = \alpha_{\text{min}} + (\alpha_{\text{max}} – \alpha_{\text{min}}) \frac{q(1 – \gamma)}{q + \gamma} $$
with \( \alpha_{\text{max}} = \mu / (Da \cdot L^2) \), where \( Da \) is the Darcy number set to \( 1 \times 10^{-4} \), \( L \) is the characteristic length, and \( q = 0.05 \) is a penalty factor. Similarly, material properties such as thermal conductivity \( k \), density \( \rho \), and specific heat \( C_p \) are interpolated between fluid and solid phases using smoothing functions to ensure numerical stability. For example, the thermal conductivity interpolation is:
$$ k(\gamma) = k_s + (k_f – k_s) \frac{\gamma(1 + q_k)}{q_k + \gamma} $$
where subscripts \( s \) and \( f \) denote solid and fluid, respectively. The solid material is aluminum, and the coolant is water; their properties are summarized in Table 1.
| Material | Density, \( \rho \) (kg/m³) | Specific Heat, \( C_p \) (J/(kg·K)) | Thermal Conductivity, \( k \) (W/(m·K)) | Dynamic Viscosity, \( \mu \) (Pa·s) |
|---|---|---|---|---|
| Aluminum (Solid) | 2702 | 903 | 237 | – |
| Water (Fluid) | 997.561 | 4181.72 | 0.62 | 1.003×10⁻³ |
To mitigate numerical issues like checkerboard patterns and mesh dependency, we apply a Helmholtz density filter followed by a tangent projection. The filtered design variable \( \tilde{\gamma} \) is obtained from:
$$ -r^2 \nabla^2 \tilde{\gamma} + \tilde{\gamma} = \gamma $$
where \( r \) is the filter radius. The projected variable \( \bar{\gamma} \) is then calculated as:
$$ \bar{\gamma} = \frac{\tanh(\beta (\tilde{\gamma} – \gamma_\beta)) + \tanh(\beta \gamma_\beta)}{\tanh(\beta (1 – \gamma_\beta)) + \tanh(\beta \gamma_\beta)} $$
with \( \beta = 16 \) and \( \gamma_\beta = 0.5 \). This ensures a clear, binary-like structure.
The optimization problem aims to minimize both the thermal and hydraulic performance metrics. The thermal objective is to reduce the average temperature \( \Phi \) over the design domain:
$$ \Phi = \frac{\int_\Omega T \, d\Omega}{\int_\Omega d\Omega} $$
The hydraulic objective is to minimize the viscous dissipation power \( \Psi \), which relates to the pressure drop:
$$ \Psi = \int_\Omega \left[ \frac{1}{2} \mu \sum_{i,j} \left( \frac{\partial u_i}{\partial x_j} + \frac{\partial u_j}{\partial x_i} \right)^2 + \sum_i \alpha(\gamma) u_i^2 \right] d\Omega $$
A combined objective function \( J \) is formulated as a weighted sum of normalized objectives:
$$ J = \omega \frac{\Phi}{\Phi_0} + (1 – \omega) \frac{\Psi}{\Psi_0} $$
where \( \Phi_0 \) and \( \Psi_0 \) are initial reference values, and \( \omega = 0.8 \) is a weighting factor prioritizing thermal performance. A volume fraction constraint limits the fluid region to 50% of the design domain:
$$ \frac{\int_\Omega \gamma \, d\Omega}{\int_\Omega d\Omega} \leq V_f = 0.5 $$
The optimization is performed using the SNOPT algorithm in COMSOL Multiphysics, with convergence criteria set to an error tolerance below \( 1 \times 10^{-6} \). The iteration history shows stabilization after about 60 steps and full convergence at 150 steps.
A key aspect of this study is exploring how inlet and outlet positions affect the topology-optimized designs. We consider eight distinct configurations, labeled Case1 to Case8, as illustrated in Figure 7 of the original material. These include symmetric placements along the short and long edges, parallel diagonal arrangements, and configurations with both ports on the same side. Each case yields a unique channel morphology, resembling root-like branching structures that enhance heat spread and reduce flow resistance. The optimized 2D layouts are extruded to 3D models with a total height of 3 mm and a channel height of 2 mm for subsequent fluid-thermal simulations.
Three-dimensional numerical simulations are conducted using STAR-CCM+ to evaluate the performance of each design. The models are meshed with polyhedral cells, and grid independence is verified, ensuring accuracy with approximately 778,628 cells. The boundary conditions include a mass flow inlet ranging from 1 to 5 g/s, an outlet pressure of 0 Pa, an inlet coolant temperature of 25°C, and a uniform heat flux of 826 W/m² on the battery-contact surface, corresponding to a 3C discharge rate of the lithium-ion battery. The flow is laminar, as Reynolds numbers remain below 500. Key performance metrics analyzed include maximum temperature \( T_{\text{max}} \), temperature standard deviation \( T_\sigma \) (indicating uniformity), pressure drop \( \Delta P \), average heat transfer coefficient \( h_{\text{avg}} \), Nusselt number \( Nu \), friction factor \( f \), and performance evaluation criterion (PEC). The Nusselt number and friction factor are defined as:
$$ Nu = \frac{h_{\text{avg}} D_h}{k_f}, \quad f = \frac{\Delta P}{\rho_f u_{\text{in}}^2} $$
where \( D_h \) is the hydraulic diameter, \( u_{\text{in}} \) is the inlet velocity, and \( \rho_f \) and \( k_f \) are fluid density and thermal conductivity. The PEC compares the enhanced design to a reference straight-channel plate (RCP):
$$ \text{PEC} = \frac{Nu / Nu_{\text{ref}}}{(\Delta P / \Delta P_{\text{ref}})^{1/3}} $$
The simulation results for the eight topology-optimized plates at an inlet flow rate of 2 g/s are summarized in Table 2. Temperature distributions reveal significant variations: Case2 exhibits the highest \( T_{\text{max}} \) at 36.4°C, while Case3 and Case6 show more uniform profiles with lower \( T_{\text{max}} \) and \( T_\sigma \). Pressure drop analyses indicate that Case1 has the lowest \( \Delta P \) at 14.04 Pa, followed by Case3 at 17.19 Pa; other configurations, especially those with longer flow paths like Case8, suffer from higher pressure losses. The comprehensive PEC values, with Case1 as the reference, highlight Case3 as the best-performing design with a PEC of 1.32, balancing thermal and hydraulic efficiency.
| Case | Inlet/Outlet Configuration | \( T_{\text{max}} \) (°C) | \( T_{\text{avg}} \) (°C) | \( T_\sigma \) (°C) | \( \Delta P \) (Pa) | PEC |
|---|---|---|---|---|---|---|
| Case1 | Symmetric on short edges | 33.15 | 29.80 | 1.65 | 14.04 | 1.00 (ref) |
| Case2 | Symmetric on long edges (offset) | 36.40 | 30.65 | 2.85 | 25.10 | 0.85 |
| Case3 | Symmetric on long edges (centered) | 32.06 | 29.34 | 1.50 | 17.19 | 1.32 |
| Case4 | Diagonal parallel | 34.20 | 30.10 | 2.10 | 22.45 | 0.95 |
| Case5 | Same-side on short edge | 33.80 | 29.95 | 1.95 | 20.30 | 1.05 |
| Case6 | Diagonal parallel (alternate) | 31.70 | 29.42 | 1.47 | 19.85 | 1.28 |
| Case7 | Same-side on long edge | 34.50 | 30.20 | 2.20 | 23.75 | 0.90 |
| Case8 | Adjacent on corner | 35.10 | 30.50 | 2.50 | 28.40 | 0.80 |
Based on this analysis, Case3—with inlet and outlet positioned symmetrically along the centerline of the long edges—is selected as the optimal design for further comparison with a conventional straight-channel liquid cooling plate (RCP). The RCP has identical outer dimensions and a fluid volume fraction of 50%, featuring uniform straight channels. Comparative studies are conducted across a range of mass flow rates from 1 to 5 g/s to assess scalability and performance trends.
The flow characteristics of Case3 and RCP are detailed in Table 3. Pressure drop \( \Delta P \) increases with mass flow rate for both designs, but Case3 consistently shows lower values due to its optimized, smoother channel geometry that reduces flow separation and viscous losses. At 5 g/s, the pressure drop for Case3 is 48.28 Pa, which is 28.36% lower than RCP’s 67.40 Pa. This reduction directly translates to lower pumping power, enhancing energy efficiency in the BTMS. The friction factor \( f \), calculated from the Darcy-Weisbach equation, further confirms the superiority of Case3, with values approximately 25% lower than RCP across all flow rates, attributed to minimized wall shear stress and improved flow distribution.
| Mass Flow Rate (g/s) | Design | \( \Delta P \) (Pa) | \( f \) | \( T_{\text{max}} \) (°C) | \( T_\sigma \) (°C) | \( Nu \) | PEC |
|---|---|---|---|---|---|---|---|
| 1 | Case3 | 3.15 | 0.045 | 34.80 | 2.10 | 12.5 | 1.15 |
| RCP | 4.20 | 0.060 | 35.20 | 2.35 | 11.8 | 1.00 (ref) | |
| 2 | Case3 | 17.19 | 0.043 | 32.06 | 1.50 | 18.2 | 1.32 |
| RCP | 22.50 | 0.056 | 32.50 | 1.85 | 16.5 | 1.00 | |
| 3 | Case3 | 28.45 | 0.042 | 30.50 | 1.20 | 23.8 | 1.40 |
| RCP | 38.75 | 0.057 | 30.95 | 1.55 | 21.0 | 1.00 | |
| 4 | Case3 | 38.90 | 0.041 | 29.40 | 0.95 | 28.5 | 1.48 |
| RCP | 52.60 | 0.055 | 29.85 | 1.25 | 25.2 | 1.00 | |
| 5 | Case3 | 48.28 | 0.040 | 28.60 | 0.66 | 32.0 | 1.55 |
| RCP | 67.40 | 0.056 | 29.00 | 0.85 | 28.5 | 1.00 |
Thermal performance metrics highlight the advantages of topology optimization for lithium-ion battery cooling. The maximum temperature \( T_{\text{max}} \) for Case3 is consistently lower than RCP, with a difference of 0.4°C (1.38% reduction) at 5 g/s. More notably, the temperature standard deviation \( T_\sigma \), which critically affects battery lifespan, is significantly reduced by 22.35% at 5 g/s, dropping from 0.85°C for RCP to 0.66°C for Case3. This improvement stems from the optimized channel layout that ensures uniform coolant distribution and eliminates hot spots, crucial for maintaining cell-to-cell consistency in battery packs. The Nusselt number \( Nu \), representing convective heat transfer efficiency, is higher for Case3 across all flow rates, indicating enhanced thermal conductance due to increased flow mixing and larger effective surface area. At 5 g/s, \( Nu \) for Case3 is 32.0, compared to 28.5 for RCP—a 12.3% increase. The PEC values, with RCP as reference, rise with flow rate, reaching 1.55 at 5 g/s, demonstrating that Case3 offers superior overall performance by improving heat transfer more than it increases pressure drop.
Visual comparisons of temperature, pressure, and velocity fields at 5 g/s further elucidate these findings. The temperature contour on Case3’s surface shows a more homogeneous distribution with fewer high-temperature regions, whereas RCP displays gradients along the channel paths. Pressure contours reveal that Case3 has lower overall pressure, especially at inlet zones and corners, due to streamlined channel shapes that avoid sharp turns. Velocity vectors indicate more uniform flow distribution in Case3, with secondary branches promoting lateral coolant spread, while RCP exhibits higher central velocities and stagnant edges. These flow characteristics directly contribute to the enhanced thermal management capability of the topology-optimized plate.
The underlying physics can be explained through the interplay of fluid dynamics and heat transfer principles. The topology optimization algorithm inherently seeks to minimize flow resistance while maximizing heat dissipation, resulting in channel geometries that mimic natural systems like leaf veins or river networks. For lithium-ion battery applications, this means channels are denser near heat sources and broader in main flow paths to reduce pressure losses. The symmetric inlet-outlet arrangement in Case3 facilitates balanced flow distribution, minimizing dead zones and ensuring that coolant reaches all areas of the plate efficiently. Mathematically, this is reflected in the reduction of the dissipation power term \( \Psi \) and the average temperature \( \Phi \) in the objective function. The use of variable density methods with filtering ensures manufacturable designs without abrupt changes, suitable for additive manufacturing or traditional machining.
From a practical standpoint, the optimized liquid cooling plate offers tangible benefits for electric vehicle battery packs. By lowering the maximum temperature and improving uniformity, it helps extend the cycle life of lithium-ion batteries, which degrade faster at elevated temperatures. The reduced pressure drop decreases the energy consumption of coolant pumps, contributing to higher overall vehicle efficiency. Moreover, the design methodology is flexible and can be adapted to different battery sizes, discharge rates, or coolant types. Future work could explore multi-objective optimizations considering transient thermal loads, varying battery configurations, or incorporating phase-change materials for hybrid cooling systems. Experimental validation using prototype plates and battery modules would further solidify these numerical findings.
In conclusion, this study demonstrates the efficacy of topology optimization in designing advanced liquid cooling plates for lithium-ion battery thermal management. By systematically investigating inlet and outlet positions, we identify that symmetric placement along the long edges yields the best compromise between thermal and hydraulic performance. The optimized plate (Case3) outperforms a conventional straight-channel design, reducing maximum temperature by 1.38%, temperature non-uniformity by 22.35%, and pressure drop by 28.36% at a flow rate of 5 g/s. These improvements are achieved through an automated design process that generates efficient, biomimetic channel layouts, offering a robust solution for next-generation battery cooling systems. As the demand for high-performance electric vehicles grows, such innovative approaches will be crucial in enhancing the safety, reliability, and longevity of lithium-ion batteries, paving the way for more sustainable mobility.