
In the pursuit of sustainable transportation, electric vehicles (EVs) powered by lithium-ion batteries have emerged as a pivotal solution to address energy and environmental crises. The lithium-ion battery, renowned for its high energy density, low self-discharge rate, and long cycle life, is the preferred choice for EV powertrains. However, the performance and safety of lithium-ion batteries are critically dependent on thermal management. During charge-discharge cycles, heat generation from Joule heating and electrochemical reactions can lead to elevated temperatures, causing capacity fade, accelerated aging, and in extreme cases, thermal runaway. Effective battery thermal management systems (BTMS) are essential to maintain lithium-ion batteries within an optimal temperature range of 20–40°C, with a maximum temperature difference below 5°C among battery cells. Among various cooling methods, liquid cooling BTMS offers superior cooling performance, moderate cost, and reliability, making it widely adopted in the automotive industry. The core component of such systems is the liquid cooling plate, whose channel design directly impacts cooling efficiency and energy consumption. Traditional channel designs, such as straight or serpentine layouts, often suffer from high pressure drops and poor temperature uniformity, limiting overall system performance. To overcome these limitations, topology optimization—a computational design method that optimizes material distribution within a given domain—provides a promising approach for creating innovative channel structures that enhance heat dissipation while minimizing flow resistance. In this study, I employ a multi-objective topology optimization framework to design liquid cooling channels for lithium-ion battery thermal management, investigating the influence of inlet and outlet positions on performance and comparing optimized designs with conventional layouts.
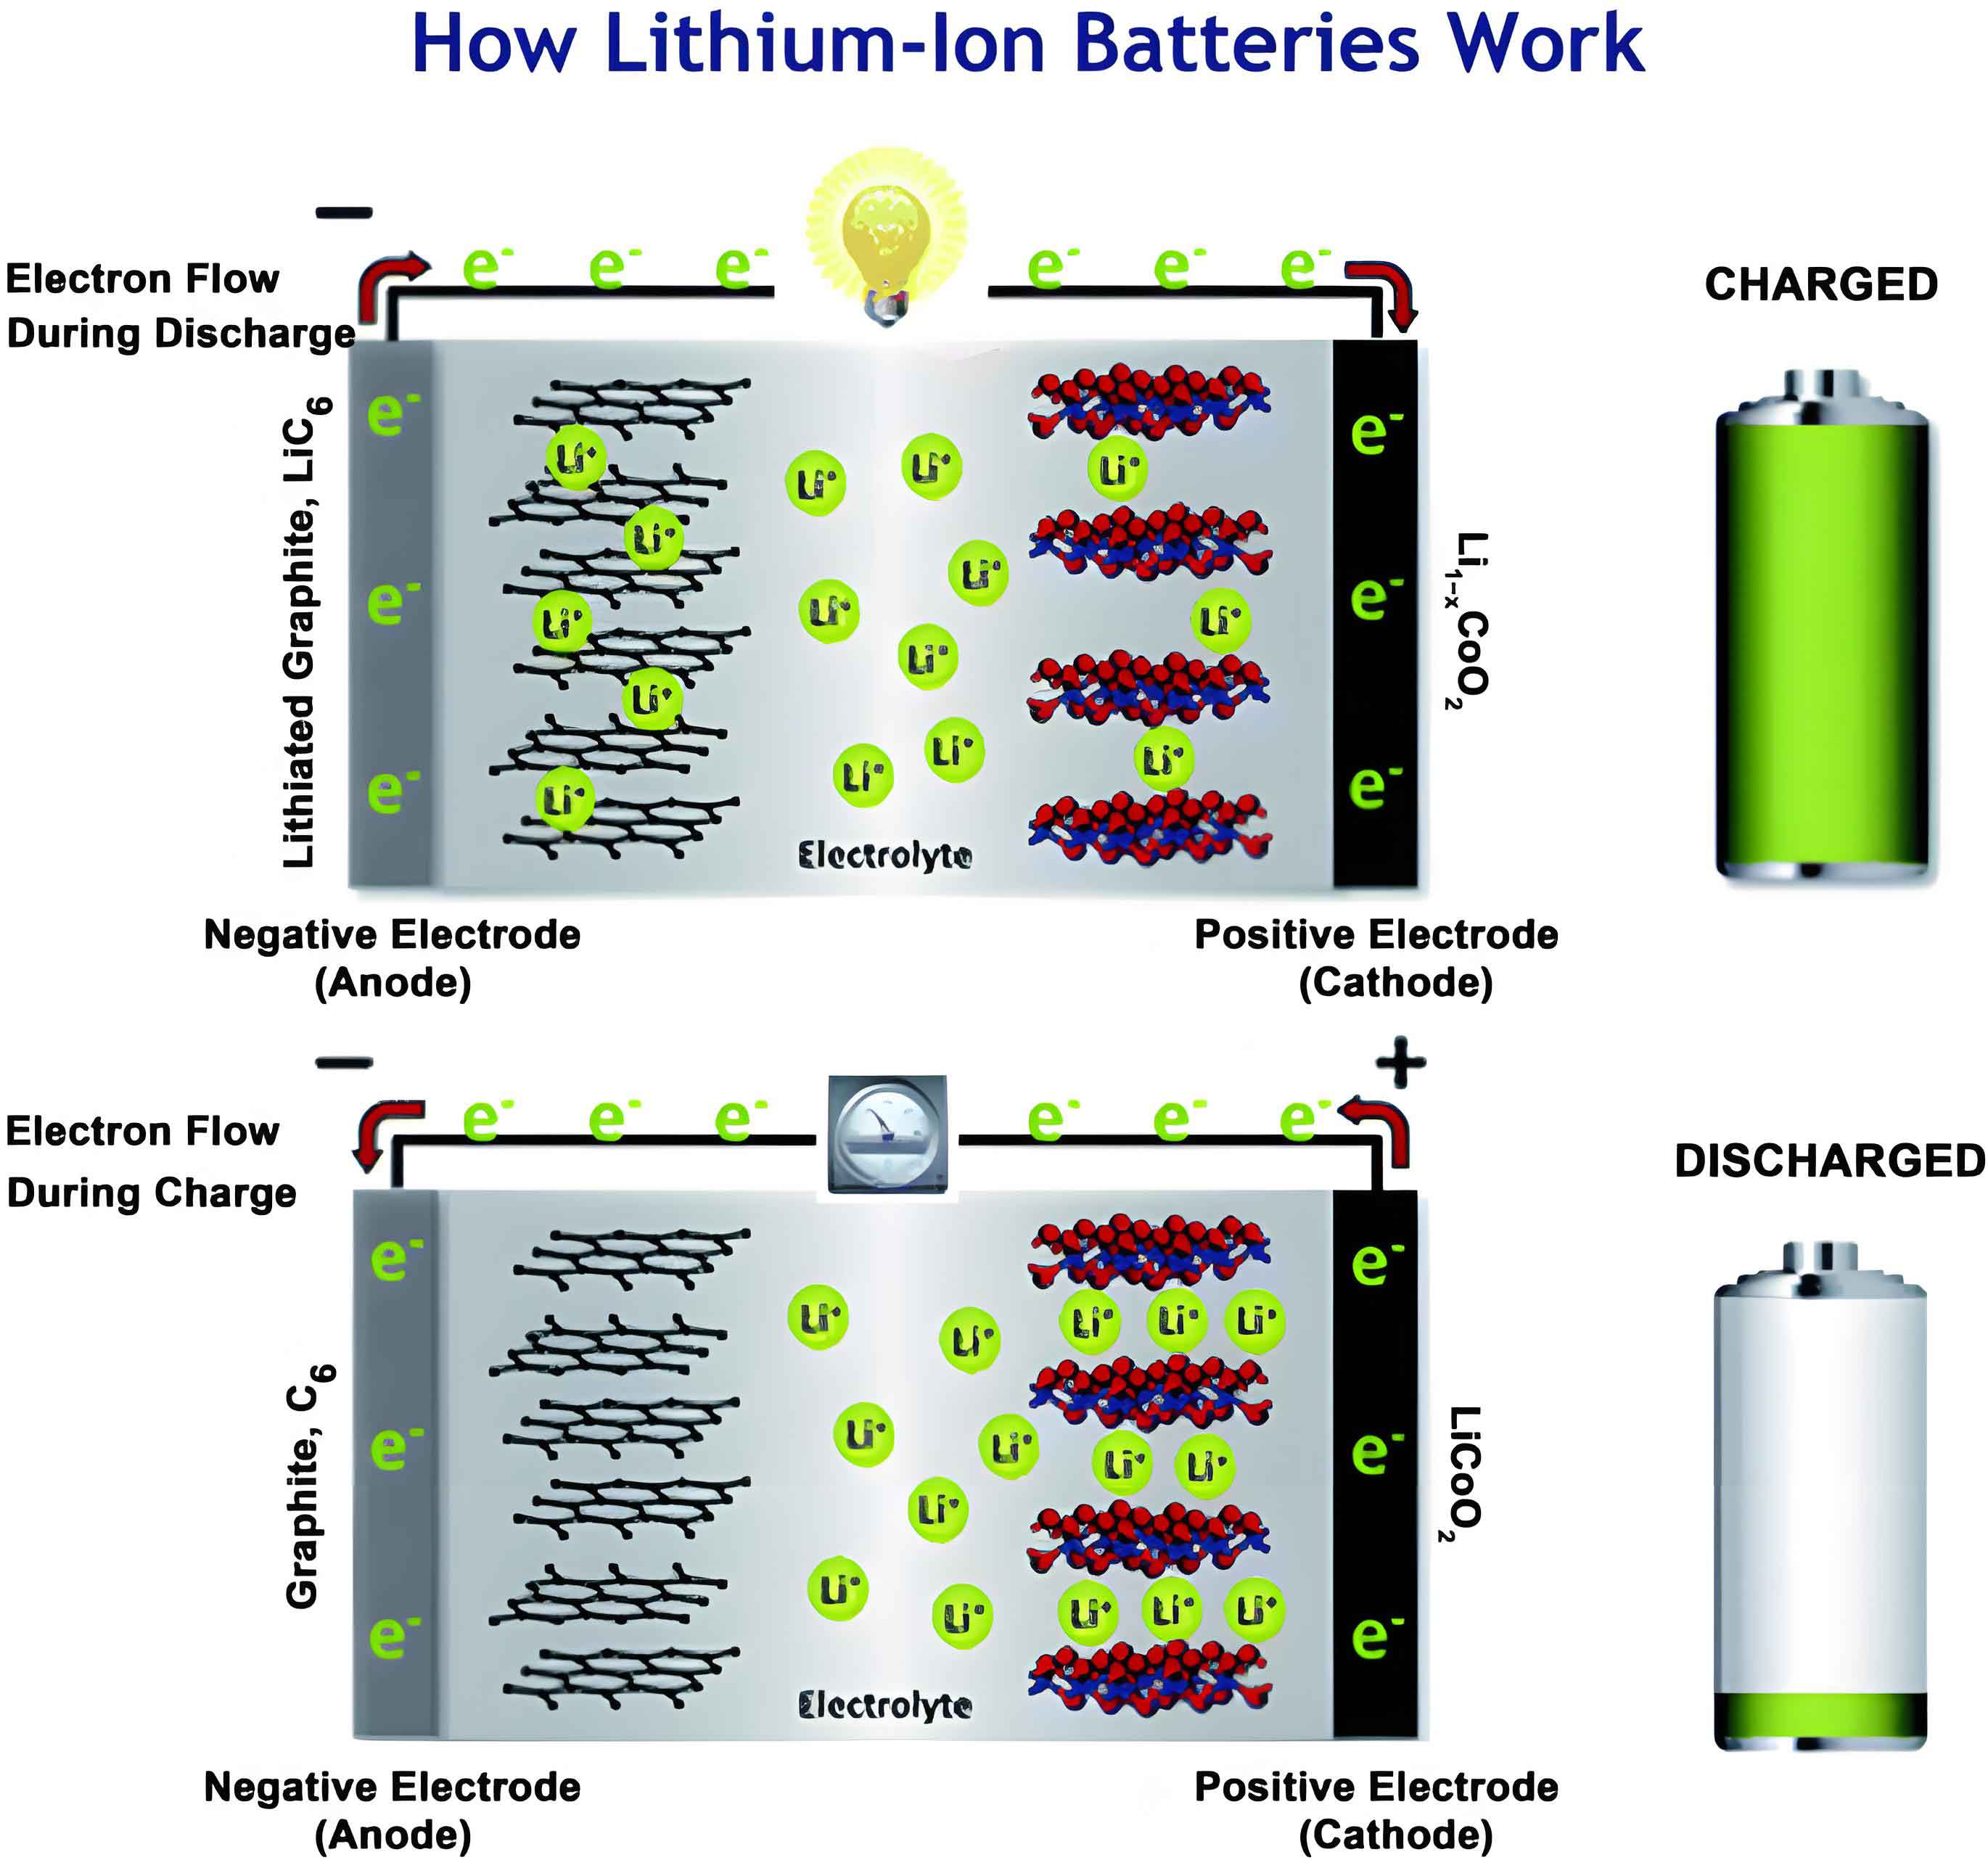
The thermal behavior of lithium-ion batteries is governed by heat generation mechanisms, which must be accurately modeled for effective cooling system design. Based on the Bernardi heat generation model, the heat production during discharge incorporates irreversible Joule heating and reversible entropic heat. For a lithium-ion battery under adiabatic conditions, the heat generation rate per unit volume can be derived from experimental data. I conducted temperature rise tests on a soft-pack lithium-ion battery with a capacity of 30 Ah, internal resistance of 2 mΩ, and mass of 0.55 kg, measuring temperature variations at different discharge currents. By fitting the data, the volumetric heat generation rate \( q \) (in W/m³) is expressed as a function of current \( I \) (in A):
$$ q = 8.13I^2 + 287.78I $$
This equation allows for calculating heat flux under various discharge rates, such as 3C, which is used as input for cooling plate simulations. The specific heat capacity \( c_p \) of the lithium-ion battery is determined as 864 J/(kg·K), providing essential parameters for thermal analysis.
Topology optimization is applied to design the cooling channel layout within a two-dimensional domain representing the cooling plate surface. The design domain measures 200 mm × 130 mm, with a 2 mm non-optimizable border to prevent edge intersections, resulting in an overall size of 204 mm × 134 mm to match the battery surface for maximal heat exchange. Using the variable density method, the domain is discretized into finite elements, each assigned a pseudo-density \( \gamma \) ranging from 0 to 1, where \( \gamma = 1 \) represents fluid regions (coolant) and \( \gamma = 0 \) represents solid regions (aluminum plate). The optimization aims to find the optimal distribution of fluid and solid to minimize both average temperature and pressure drop, formulated as a multi-objective problem. The governing equations for fluid flow and heat transfer in this conjugate system are based on steady-state assumptions, incorporating the Brinkman penalization model to simulate porous media flow. The momentum equation includes a volume force term \( F \) that depends on the design variable \( \gamma \):
$$ \rho(\gamma) (\mathbf{u} \cdot \nabla) \mathbf{u} = -\nabla P + \mu \nabla \cdot (\nabla \mathbf{u} + \nabla \mathbf{u}^T) + \mathbf{F} $$
where \( \mathbf{F} = -\alpha(\gamma) \mathbf{u} \). The inverse permeability \( \alpha(\gamma) \) is interpolated using a penalty function:
$$ \alpha(\gamma) = \alpha_{\text{min}} + (\alpha_{\text{max}} – \alpha_{\text{min}}) \cdot \frac{q(1 – \gamma)}{q + \gamma} $$
with \( q = 0.05 \) as a penalty factor, \( \alpha_{\text{max}} = \mu / (Da \cdot L^2) \), \( Da = 1 \times 10^{-4} \) (Darcy number), and \( L \) as the characteristic length. Similarly, material properties such as thermal conductivity \( k \), density \( \rho \), and specific heat capacity \( c_p \) are interpolated between fluid and solid phases:
$$ k(\gamma) = k_s + (k_f – k_s) \cdot \frac{\gamma(1 + q_k)}{q_k + \gamma} $$
$$ \rho(\gamma) = \rho_s + (\rho_f – \rho_s) \cdot \frac{\gamma(1 + q_\rho)}{q_\rho + \gamma} $$
$$ c_p(\gamma) = c_{p,s} + (c_{p,f} – c_{p,s}) \cdot \frac{\gamma(1 + q_c)}{q_c + \gamma} $$
To mitigate numerical issues like checkerboarding and mesh dependency, Helmholtz filtering and tangent projection are applied. The filtered design variable \( \tilde{\gamma} \) is obtained from:
$$ -r^2 \nabla^2 \tilde{\gamma} + \tilde{\gamma} = \gamma $$
with filter radius \( r \), followed by projection:
$$ \bar{\gamma} = \frac{\tanh(\beta(\tilde{\gamma} – \gamma_\beta)) + \tanh(\beta \gamma_\beta)}{\tanh(\beta(1 – \gamma_\beta)) + \tanh(\beta \gamma_\beta)} $$
where \( \beta = 16 \) and \( \gamma_\beta = 0.5 \). The optimization objectives are to minimize the domain-average temperature \( \Phi \) and the viscous dissipation power \( \Psi \), normalized and combined into a single objective function \( J \):
$$ \Phi = \int_\Omega T \, d\Omega \bigg/ \int_\Omega 1 \, d\Omega $$
$$ \Psi = \int_\Omega \left[ \frac{1}{2} \mu \sum_{i,j} \left( \frac{\partial u_i}{\partial x_j} + \frac{\partial u_j}{\partial x_i} \right)^2 + \sum_i \alpha(\gamma) u_i^2 \right] d\Omega $$
$$ J = \omega \frac{\Phi}{\Phi_0} + (1 – \omega) \frac{\Psi}{\Psi_0} $$
with weight \( \omega = 0.8 \). A volume fraction constraint limits the fluid region to 50% of the design domain:
$$ \int_\Omega \gamma \, d\Omega \bigg/ \int_\Omega 1 \, d\Omega \leq V_f = 0.5 $$
I implemented this model in COMSOL Multiphysics, using the SNOPT optimization algorithm with a convergence tolerance of \( 1 \times 10^{-6} \). The iteration process typically stabilizes after 150 steps, yielding clear channel topologies. To explore the impact of inlet and outlet arrangements, eight distinct configurations are considered, as summarized in Table 1. These include opposing positions along short and long edges, parallel diagonal placements, and same-side arrangements, labeled Case1 through Case8.
| Case | Inlet Position | Outlet Position | Description |
|---|---|---|---|
| Case1 | Center of short edge | Opposite center of short edge | Opposing along short edge |
| Case2 | Center of long edge | Opposite center of long edge | Opposing along long edge |
| Case3 | Center of long edge (symmetric) | Center of opposite long edge (symmetric) | Symmetric along long edge centerline |
| Case4 | Corner of short edge | Opposite corner of short edge | Diagonal along short edge |
| Case5 | Corner of long edge | Opposite corner of long edge | Parallel diagonal |
| Case6 | Corner of long edge (parallel) | Opposite corner of long edge (parallel) | Parallel diagonal alternative |
| Case7 | Center of long edge | Adjacent side center | Same-side arrangement |
| Case8 | Corner of long edge | Adjacent corner | Same-side corner arrangement |
The optimized two-dimensional channel layouts for each case exhibit tree-like structures with main trunks and branching tributaries, resembling natural root systems. These designs aim to enhance heat transfer uniformity and reduce flow resistance. To evaluate three-dimensional performance, I extruded the 2D geometries to a height of 3 mm, with a channel height of 2 mm, creating solid models for computational fluid dynamics (CFD) simulations in STAR-CCM+. The cooling plate material is aluminum, and the coolant is water, with properties listed in Table 2.
| Material | Density \(\rho\) (kg/m³) | Thermal Conductivity \(k\) (W/(m·K)) | Specific Heat Capacity \(c_p\) (J/(kg·K)) | Dynamic Viscosity \(\mu\) (Pa·s) |
|---|---|---|---|---|
| Aluminum (Solid) | 2702 | 237 | 903 | – |
| Water (Coolant) | 997.561 | 0.62 | 4181.72 | 1.003 × 10⁻³ |
Simulations assume steady, incompressible, laminar flow (Reynolds number < 2300), with no-slip boundary conditions at fluid-solid interfaces. The inlet is set as a mass flow inlet at 25°C, with mass flow rates ranging from 1 to 5 g/s, while the outlet is a pressure outlet at 0 Pa gauge. A constant heat flux of 826 W/m², corresponding to 3C discharge of the lithium-ion battery, is applied to the cooling plate surface in contact with the battery. Other surfaces are adiabatic. The governing equations for fluid flow and heat transfer in three dimensions are:
Continuity: $$ \nabla \cdot (\rho_f \mathbf{u}_f) = 0 $$
Momentum: $$ \rho_f (\mathbf{u}_f \cdot \nabla) \mathbf{u}_f = -\nabla P + \mu \nabla^2 \mathbf{u}_f $$
Energy (fluid): $$ \rho_f c_{p,f} (\mathbf{u}_f \cdot \nabla T) = k_f \nabla^2 T $$
Energy (solid): $$ \rho_s c_{p,s} \frac{\partial T}{\partial t} = k_s \nabla^2 T $$
For performance evaluation, key metrics include maximum temperature \( T_{\text{max}} \), temperature standard deviation \( T_\sigma \) (indicating uniformity), pressure drop \( \Delta P \), average heat transfer coefficient \( h_{\text{avg}} \), Nusselt number \( Nu \), flow resistance coefficient \( f \), and performance evaluation criterion (PEC). These are defined as:
$$ T_\sigma = \sqrt{ \frac{ \int_{A_c} (T – T_{\text{avg}})^2 \, dA_c }{ \int_{A_c} 1 \, dA_c } } $$
$$ h_{\text{avg}} = \frac{Q}{A_c (T_{\text{avg}} – (T_{\text{in}} + T_{\text{out}})/2)} $$
$$ Nu = \frac{h_{\text{avg}} D_h}{k_f} $$
$$ f = \frac{\Delta P}{\rho_f u_{\text{in}}^2} $$
$$ \text{PEC} = \frac{Nu / Nu_{\text{ref}}}{(\Delta P / \Delta P_{\text{ref}})^{1/3}} $$
where \( D_h \) is hydraulic diameter, \( u_{\text{in}} \) is inlet velocity, and subscript “ref” denotes a reference case (e.g., conventional design). A mesh independence study confirmed that a polyhedral mesh with approximately 778,628 cells ensures results within 0.2% variation.
The results reveal significant differences in thermal and hydraulic performance among the eight topology-optimized designs. At an inlet mass flow rate of 2 g/s, surface temperature distributions show that Case2 has the highest maximum temperature of 36.4°C, while Case3 and Case6 exhibit lower temperature gradients. Quantitative comparisons are presented in Table 3, summarizing \( T_{\text{max}} \), \( T_{\text{avg}} \), \( T_\sigma \), and \( \Delta P \) for all cases.
| Case | \( T_{\text{max}} \) (°C) | \( T_{\text{avg}} \) (°C) | \( T_\sigma \) (°C) | \( \Delta P \) (Pa) |
|---|---|---|---|---|
| Case1 | 33.15 | 29.87 | 1.65 | 14.04 |
| Case2 | 36.40 | 31.20 | 2.85 | 28.73 |
| Case3 | 32.06 | 29.34 | 1.50 | 17.19 |
| Case4 | 34.88 | 30.45 | 2.25 | 22.50 |
| Case5 | 33.92 | 30.10 | 1.98 | 19.87 |
| Case6 | 31.70 | 29.42 | 1.47 | 23.15 |
| Case7 | 34.25 | 30.20 | 2.10 | 25.60 |
| Case8 | 35.10 | 30.80 | 2.50 | 30.45 |
Case3 demonstrates the lowest average temperature (29.34°C) and second-lowest maximum temperature, while Case6 has the lowest temperature standard deviation (1.47°C) and maximum temperature. Regarding pressure drop, Case1 shows the minimum (14.04 Pa), followed by Case3 (17.19 Pa). High pressure drops are observed in Case2 and Case8 due to longer flow paths. The PEC values, with Case1 as reference, indicate that Case3 achieves the highest PEC of 1.32, signifying the best overall trade-off between heat transfer and flow resistance. Thus, Case3—with inlet and outlet along the long-edge centerline—is selected as the optimal design for further analysis.
To assess the advantages of topology optimization, I compare Case3 with a conventional straight-channel cooling plate (RCP) of identical dimensions and fluid volume fraction. The straight-channel design features parallel channels with rectangular cross-sections, commonly used in industry. Performance trends over mass flow rates from 1 to 5 g/s are analyzed. The pressure drop \( \Delta P \) increases with flow rate for both designs, but Case3 consistently exhibits lower values, as shown in Table 4. At 5 g/s, the pressure drop for Case3 is 48.32 Pa, compared to 67.44 Pa for RCP, a reduction of 28.36%. This reduction translates to lower pumping power, enhancing energy efficiency in the lithium-ion battery thermal management system.
| Mass Flow Rate (g/s) | \( \Delta P \) for Case3 (Pa) | \( \Delta P \) for RCP (Pa) | Flow Resistance Coefficient \( f \) for Case3 | Flow Resistance Coefficient \( f \) for RCP |
|---|---|---|---|---|
| 1 | 4.21 | 5.89 | 0.045 | 0.063 |
| 2 | 17.19 | 24.15 | 0.043 | 0.061 |
| 3 | 28.74 | 40.33 | 0.042 | 0.059 |
| 4 | 38.90 | 54.56 | 0.041 | 0.058 |
| 5 | 48.32 | 67.44 | 0.040 | 0.057 |
Thermal performance metrics also favor Case3. As illustrated in Table 5, the maximum temperature \( T_{\text{max}} \) and temperature standard deviation \( T_\sigma \) are lower for Case3 across all flow rates. At 5 g/s, \( T_{\text{max}} \) is 28.6°C for Case3 versus 29.0°C for RCP, a decrease of 1.38%, while \( T_\sigma \) drops from 0.85°C to 0.66°C, a 22.35% improvement. The Nusselt number \( Nu \), indicative of convective heat transfer efficacy, is higher for Case3, confirming enhanced cooling capability. The optimized channel layout promotes uniform fluid distribution, reduces hot spots, and increases surface area for heat exchange, crucial for maintaining lithium-ion battery temperature within safe limits.
| Mass Flow Rate (g/s) | \( T_{\text{max}} \) for Case3 (°C) | \( T_{\text{max}} \) for RCP (°C) | \( T_\sigma \) for Case3 (°C) | \( T_\sigma \) for RCP (°C) | \( Nu \) for Case3 | \( Nu \) for RCP |
|---|---|---|---|---|---|---|
| 1 | 32.50 | 33.10 | 2.10 | 2.65 | 12.34 | 10.89 |
| 2 | 32.06 | 32.80 | 1.50 | 1.95 | 15.67 | 13.45 |
| 3 | 30.45 | 31.20 | 1.10 | 1.40 | 18.90 | 16.23 |
| 4 | 29.40 | 30.10 | 0.85 | 1.10 | 21.56 | 18.78 |
| 5 | 28.60 | 29.00 | 0.66 | 0.85 | 23.89 | 20.95 |
Visualizations of temperature, pressure, and velocity fields at 5 g/s further elucidate the benefits. The Case3 design shows a more uniform temperature distribution with fewer localized hot regions compared to RCP. Pressure contours indicate lower overall levels in Case3, especially at corners where RCP experiences high resistance due to sharp turns. Velocity profiles demonstrate that Case3 achieves better flow spreading, avoiding stagnant zones and ensuring efficient coolant utilization across the entire lithium-ion battery contact surface.
The success of topology optimization in this context stems from its ability to generate geometries that inherently balance multiple physical objectives. Unlike traditional trial-and-error approaches, the method systematically explores the design space, yielding structures that mimic natural flow patterns. For lithium-ion battery applications, where thermal homogeneity is as critical as peak temperature control, such optimized channels can significantly extend battery life and safety. Moreover, the reduction in pressure drop directly lowers parasitic energy consumption, contributing to overall vehicle efficiency.
However, challenges remain in practical implementation. Manufacturing complexity of topology-optimized channels may increase costs, though advancements in additive manufacturing (e.g., 3D printing) could facilitate production. Additionally, the optimization assumes steady-state conditions; dynamic thermal loads during real-world driving cycles warrant further investigation. Future work could integrate transient analyses, multi-physics coupling with battery electrochemistry, and system-level optimizations including pump and coolant selection.
In conclusion, this study demonstrates the efficacy of multi-objective topology optimization for designing liquid cooling channels in lithium-ion battery thermal management systems. By considering various inlet and outlet positions, I identified that symmetric placement along the long-edge centerline yields the best overall performance, with notable improvements in temperature uniformity and pressure drop reduction compared to conventional straight-channel designs. The optimized channel layout enhances heat dissipation while minimizing flow resistance, addressing key limitations in existing cooling plates. These findings provide a foundation for innovative cooling strategies that can enhance the reliability and efficiency of lithium-ion batteries in electric vehicles, supporting the transition toward sustainable mobility. Continued research in this direction will further unlock the potential of advanced design methodologies for next-generation energy storage systems.