
The widespread adoption of lithium-ion batteries across diverse sectors, from consumer electronics and electric vehicles to grid-scale energy storage systems, has brought the critical issue of battery health and safety to the forefront. Accurate and timely assessment of a lithium-ion battery’s State of Health (SOH) is paramount for ensuring system reliability, preventing failures, and optimizing operational lifespan. Typically, SOH is not a directly measurable parameter; it must be inferred through its relationship with observable electrical signals such as voltage and current. While SOH can be defined by capacity fade, this requires lengthy full charge-discharge cycles, making it unsuitable for online, real-time applications. An alternative approach defines SOH based on the increase in internal resistance, which can be assessed more rapidly. The internal resistance of a lithium-ion battery is not a single value but comprises various polarization resistances stemming from different physical and electrochemical processes. This multi-factorial nature offers a richer set of features for potentially more accurate and robust SOH estimation.
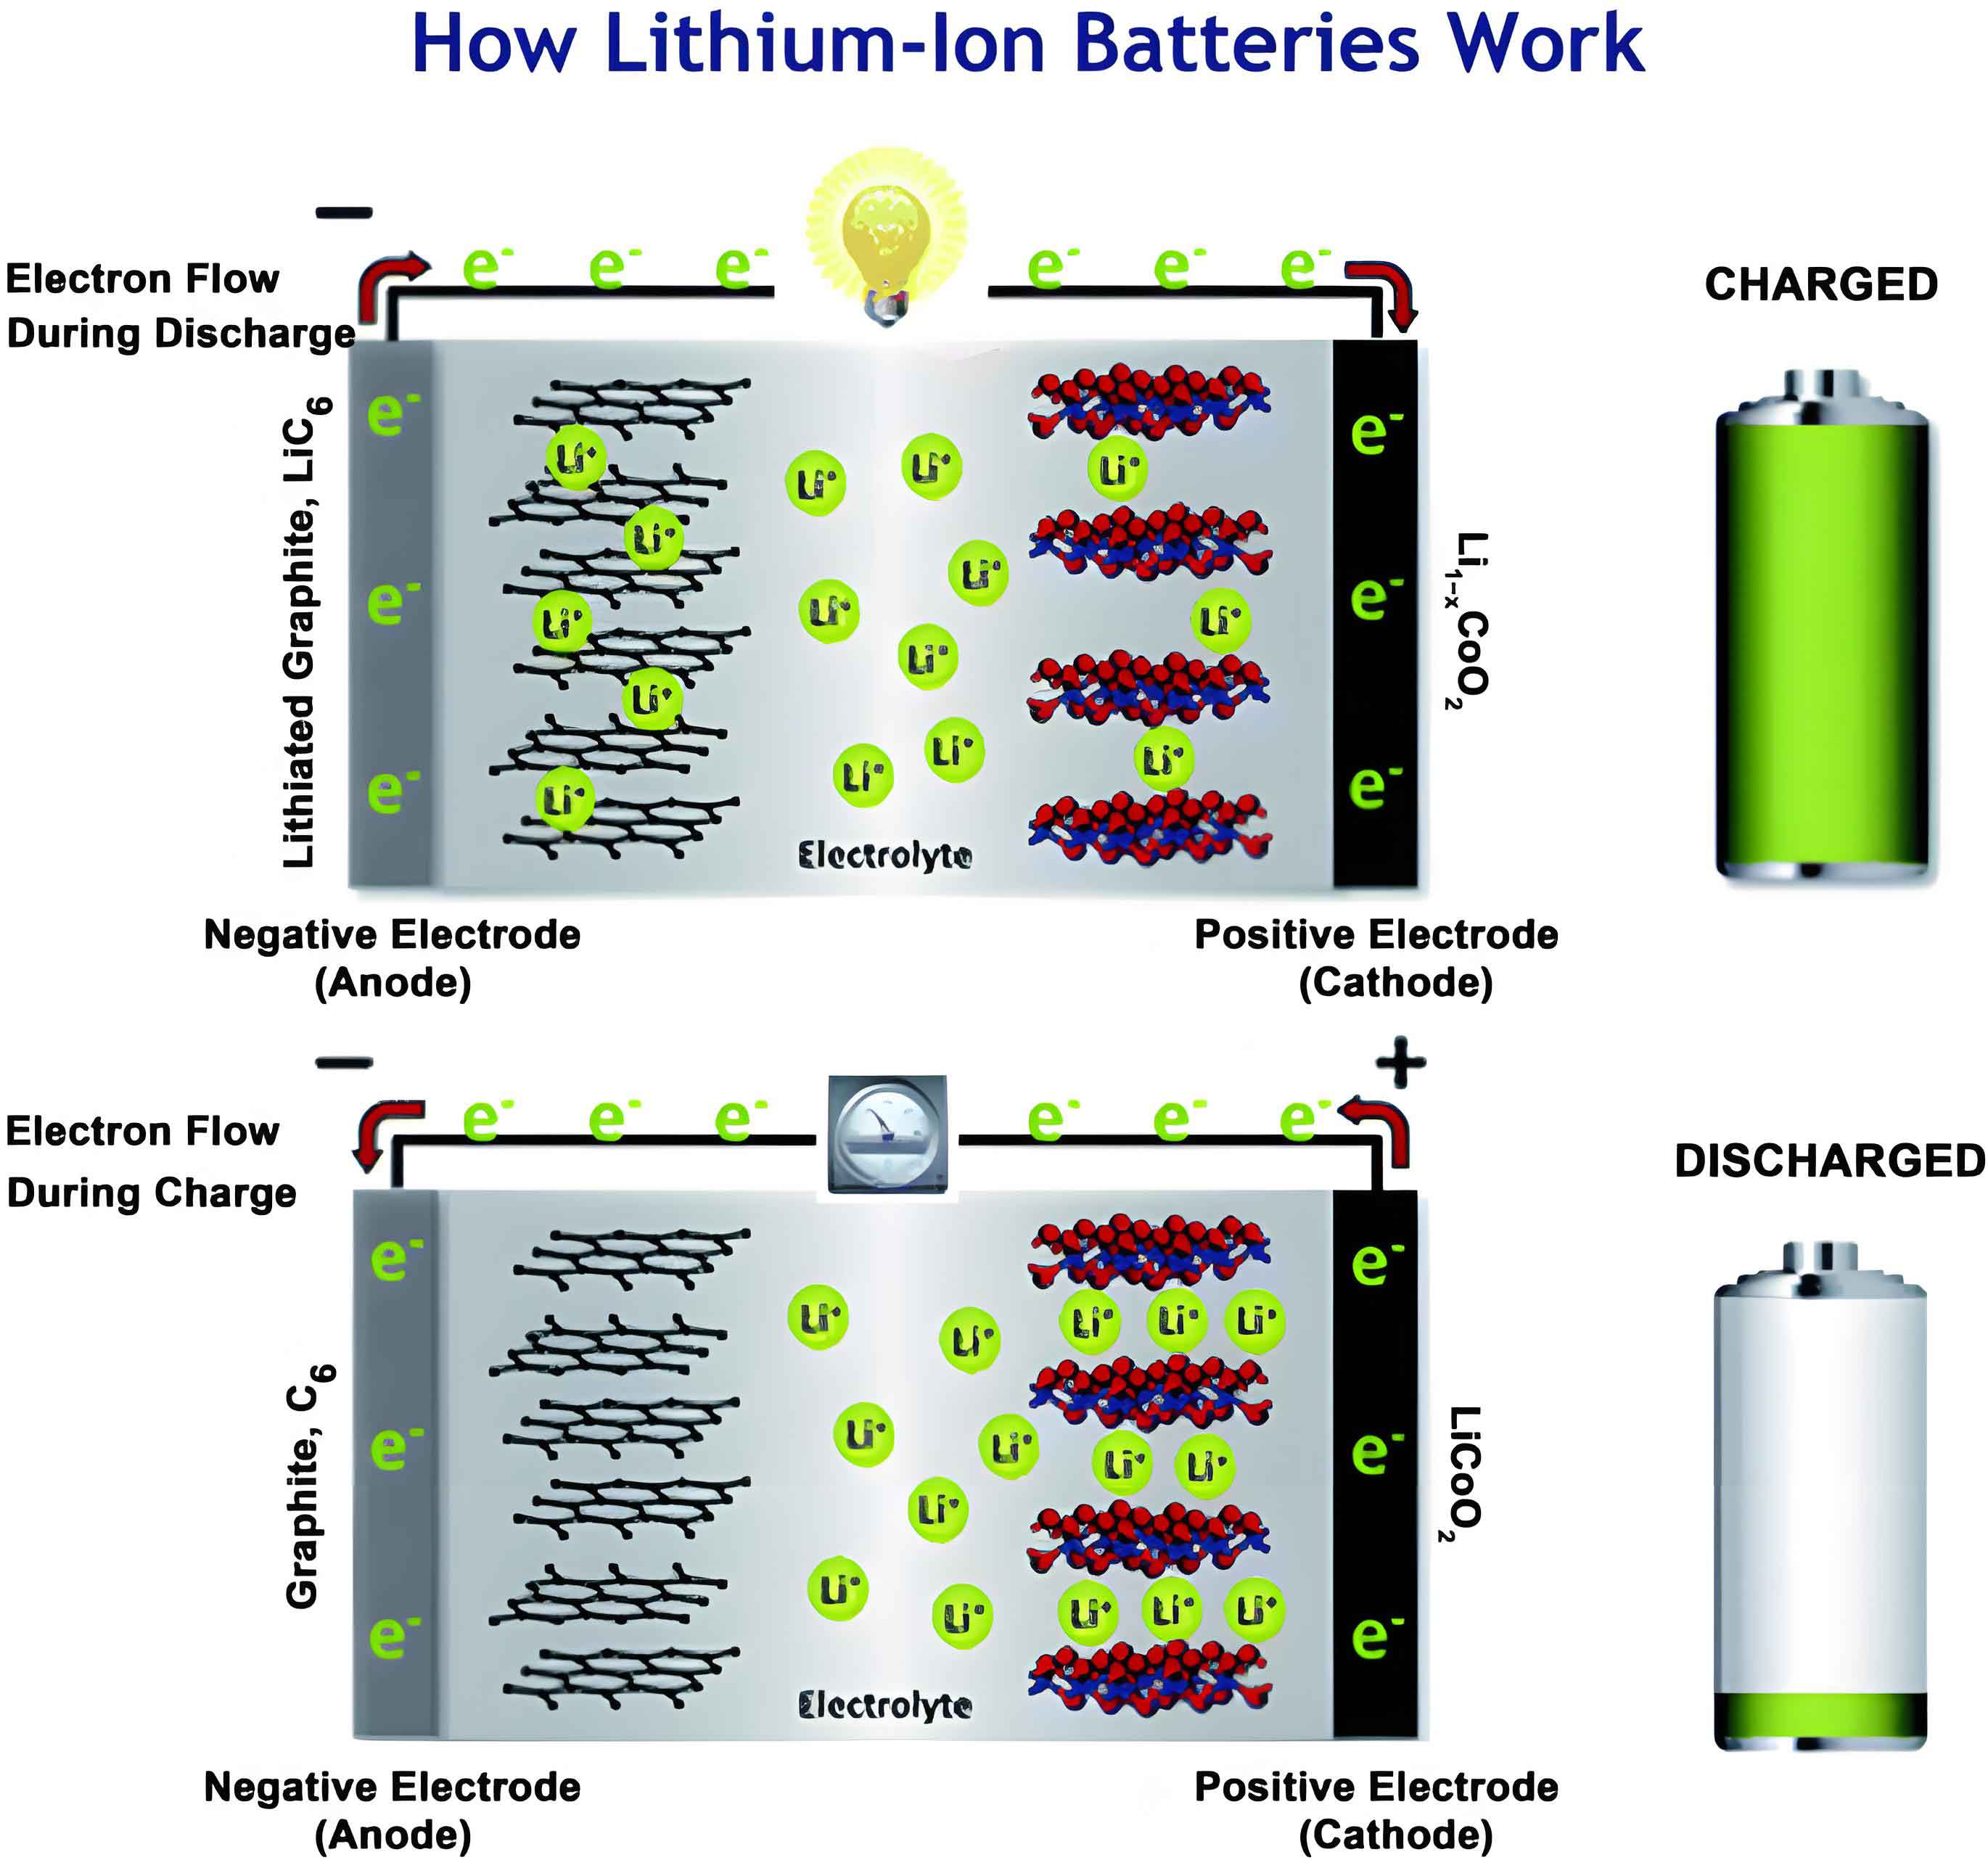
Electrochemical Impedance Spectroscopy (EIS) coupled with Equivalent Circuit Model (ECM) fitting is a predominant technique for characterizing these internal resistances. EIS probes the frequency-dependent response of a lithium-ion battery, revealing signatures of various kinetic processes. However, traditional EIS analysis for SOH diagnosis faces significant challenges for practical online implementation. Standard EIS measurements require a wide frequency sweep (e.g., from mHz to kHz), which is time-consuming. During such a long measurement, especially at low frequencies, the battery’s State of Charge (SOC) can drift, contaminating the impedance data with SOC-dependent effects. Furthermore, commercial potentiostats for EIS are expensive and involve complex data acquisition and fitting procedures. While single-frequency impedance measurements offer speed, they often lack sufficient information as they condense the complex impedance of the lithium-ion battery into a single number, ignoring the distinct contributions of different aging mechanisms and leading to poor estimation accuracy.
To address these limitations, this work proposes a novel online rapid diagnosis method for lithium-ion battery SOH based on multi-point impedance analysis. The core idea is to shift from a full spectrum measurement to a targeted interrogation at a few, carefully selected characteristic frequencies. These frequencies are chosen based on a deep analysis of how different polarization processes within the lithium-ion battery depend on SOC and SOH. By injecting a composite current signal containing these selected frequencies, we can quickly acquire key impedance features that are strongly indicative of SOH while being largely independent of the instantaneous SOC. This enables fast, online-capable diagnostics using simpler hardware and algorithms.
Methodology: From Full Spectrum to Feature Points
The proposed methodology involves several key steps: establishing a physically interpretable model, analyzing the dependence of polarization processes on SOC and SOH, selecting optimal characteristic frequencies, and developing the online measurement and estimation algorithm.
1. Establishing a Physically Interpretable Equivalent Circuit Model
Instead of using an empirical ECM, we construct a model with clear physical meanings by deconvolving the full EIS data. This is achieved using the Distribution of Relaxation Times (DRT) method. The DRT analysis assumes the total polarization impedance of a system, like a lithium-ion battery, can be represented as a series of parallel resistor-capacitor (RC) elements, each with a characteristic time constant \(\tau\). The impedance \(Z(\omega)\) is given by:
$$
Z(\omega) = R_O + R_{pol} \int_0^{\infty} \frac{g(\tau)}{1 + j\omega\tau} d\tau
$$
where \(R_O\) is the ohmic resistance, \(R_{pol}\) is the total polarization resistance, \(g(\tau)\) is the distribution function of relaxation times, \(j\) is the imaginary unit, and \(\omega\) is the angular frequency. The DRT function \(g(\tau)\) (or \(\gamma(\ln \tau)\)) is obtained by solving this integral equation using numerical techniques like Tikhonov regularization. Peaks in the DRT plot correspond to distinct electrochemical processes with specific time constants.
For a commercial lithium-ion battery (e.g., INR18650-35E) at 50% SOC, DRT analysis typically reveals four primary peaks, as shown in the analysis of experimental data. These peaks are associated with the following polarization processes, ordered from shortest to longest time constant:
- Contact Polarization (s1): Related to the electronic contact between active materials and current collectors.
- SEI Layer Polarization (s2): Associated with lithium-ion migration through the Solid-Electrolyte Interphase (SEI) layer.
- Charge Transfer Polarization (s3): Corresponds to the electrochemical reaction at the electrode/electrolyte interface.
- Diffusion Polarization (s4): Related to solid-state diffusion of lithium ions within the electrode particles.
This direct mapping allows us to construct an ECM where each RC element has a clear physical basis: \(R_O\), \(R_C\) (Contact), \(R_{SEI}\), \(R_{CT}\) (Charge Transfer), and a Warburg element \(Z_W\) for diffusion. The model’s accuracy is validated by comparing its dynamic voltage response and simulated impedance spectrum with experimental data, showing excellent agreement.
2. Analyzing SOC and SOH Dependence of Polarization Processes
A critical step for online application is to identify impedance features that are sensitive to SOH but insensitive to SOC variations, which are difficult to control precisely during online operation.
SOC Dependence Analysis: EIS measurements of a single lithium-ion battery at different SOC levels show significant variation, particularly in the mid-frequency arc associated with charge transfer. DRT analysis of this data clarifies this dependence. The peaks corresponding to contact resistance (\(R_C\)) and SEI resistance (\(R_{SEI}\)) show minimal shift with changing SOC. In contrast, the peaks for charge transfer (\(R_{CT}\)) and diffusion (\(Z_W\)) exhibit strong SOC dependence.
SOH Dependence Analysis: EIS and subsequent DRT analysis of lithium-ion batteries with different maximum available capacities (i.e., different SOH) reveal that the characteristic time constants separating the contact and SEI processes (\(\tau_1, \tau_2\)) remain relatively stable. However, the magnitudes of the corresponding resistances (\(R_O, R_C, R_{SEI}\)) increase consistently as the lithium-ion battery degrades.
Key Insight: The ohmic, contact, and SEI resistances (\(R_O, R_C, R_{SEI}\)) are:
- Strong indicators of SOH: They increase with lithium-ion battery aging due to electrolyte decomposition, current collector corrosion, and SEI layer growth, respectively.
- Largely independent of SOC: Their characteristic time constants and values are minimally affected by the instantaneous charge level.
- Located in the mid-to-high frequency range: This allows for very fast measurement, crucial for online diagnostics where the SOC should be considered constant during the test.
Therefore, these three parameters are ideal candidates as feature variables for online SOH estimation of the lithium-ion battery.
3. Selecting Optimal Characteristic Frequencies
We need to find specific frequencies where the measured total impedance is dominated by the contribution of one or more of our target resistances (\(R_O, R_C, R_{SEI}\)). The impedance of a single RC element is:
$$
Z(\omega) = \frac{R}{1 + j\omega\tau_0}
$$
where \(\tau_0 = RC\) is its time constant. The real part of the impedance is:
$$
\text{Re}[Z(\omega)] = \frac{R}{1 + (\omega\tau_0)^2}
$$
Analysis shows that when an excitation frequency \(f_x\) (with \(\tau_x = 1/(2\pi f_x)\)) is much higher than the characteristic time constant of a process (\(\tau_x \ll \tau_0\)), that process’s resistance contributes fully to the real part of the measured impedance. Conversely, if \(f_x\) is much lower (\(\tau_x \gg \tau_0\)), its contribution is negligible.
From the DRT analysis, we obtain the boundary time constants separating the key processes: \(\tau_1\) (between \(R_O\) and \(R_C\)) and \(\tau_2\) (between \(R_C\) and \(R_{SEI}\)). The optimal characteristic frequencies are then calculated as the inverse of these boundaries:
$$
f_1 = \frac{1}{2\pi\tau_1}, \quad f_2 = \frac{1}{2\pi\tau_2}, \quad f_3 = \frac{1}{2\pi\tau_3}
$$
where \(\tau_3\) is related to the start of the SEI process region. For a typical lithium-ion battery, these frequencies fall in the mid-to-high range (e.g., ~315 Hz, ~21 Hz, ~2.4 Hz).
At these specific points:
- \(|Z(f_1)| \approx R_O\) (Ohmic resistance dominates).
- \(|Z(f_2)| \approx R_O + R_C\) (Ohmic + Contact resistances dominate).
- \(|Z(f_3)| \approx R_O + R_C + R_{SEI}\) (Ohmic + Contact + SEI resistances dominate).
This relationship is summarized in the table below:
| Characteristic Frequency | Dominant Resistances in |Z| | Calculation Rule |
|---|---|---|
| \(f_1\) (High) | \(R_O\) | \(R_O \approx |Z(f_1)|\) |
| \(f_2\) (Medium) | \(R_O + R_C\) | \(R_C \approx |Z(f_2)| – |Z(f_1)|\) |
| \(f_3\) (Low-Medium) | \(R_O + R_C + R_{SEI}\) | \(R_{SEI} \approx |Z(f_3)| – |Z(f_2)|\) |
4. Multi-Frequency Superposition Injection and SOH Estimation Model
To measure these three frequencies almost simultaneously and thus ensure they reflect the same battery state (minimizing SOC drift), we propose a Multi-Frequency Superposition Injection method. Instead of sequential single-frequency sweeps, a composite current signal \(i(t)\) is injected into the lithium-ion battery:
$$
i(t) = I_1 \sin(2\pi f_1 t) + I_2 \sin(2\pi f_2 t) + I_3 \sin(2\pi f_3 t)
$$
where \(I_1, I_2, I_3\) are the current amplitudes for each frequency component. The voltage response \(v(t)\) of the lithium-ion battery is measured simultaneously. Fast Fourier Transform (FFT) is then applied to both \(i(t)\) and \(v(t)\) to extract the magnitude ratio (impedance modulus) at each of the three characteristic frequencies \(f_1, f_2, f_3\). The phase information is not strictly required because in this mid-high frequency range, the phase angle is very close to zero, so \(|Z| \approx \text{Re}(Z)\).
Using the rules in the table above, the feature resistances \(R_O, R_C, R_{SEI}\) are calculated from the three impedance moduli.
SOH Estimation Model: The SOH of the lithium-ion battery is defined based on capacity fade (\(C_{now}/C_{new}\)). We propose a weighted linear model that relates the increase in the three feature resistances to SOH:
$$
\text{SOH} (\%) = \left( \alpha \frac{R_{O,eol} – R_{O,now}}{R_{O,eol} – R_{O,new}} + \beta \frac{R_{C,eol} – R_{C,now}}{R_{C,eol} – R_{C,new}} + \delta \frac{R_{SEI,eol} – R_{SEI,now}}{R_{SEI,eol} – R_{SEI,new}} \right) \times 100\%
$$
where the subscript new, now, and eol refer to the new state, current state, and end-of-life state of the lithium-ion battery, respectively. The weights \(\alpha, \beta, \delta\) (\(\alpha + \beta + \delta = 1\)) represent the contribution of each resistance to the overall aging. They can be determined empirically by solving a linear system using data from lithium-ion batteries at different aging states. For instance, experimental data might reveal \(\delta \gg \alpha, \beta\), indicating that SEI growth is the dominant aging mechanism for that specific type of lithium-ion battery.
Experimental Validation and Results
The proposed method was validated using commercial 18650 lithium-ion batteries with different levels of capacity fade (SOH). The table below shows a subset of the impedance estimation results using the multi-frequency superposition injection method under different load conditions (0C, 0.1C, 0.2C charging rates). The “Reference” values are obtained from full EIS fitting.
| Battery Capacity (mAh) | Condition | \(R_O\) (mΩ) [Error] | \(R_C\) (mΩ) [Error] | \(R_{SEI}\) (mΩ) [Error] |
|---|---|---|---|---|
| 3483 | 0C (Ref: 29.84) | 29.76 [0.27%] | 4.116 [3.61%] | 0.825 [1.64%] |
| 0.1C | 30.05 [0.70%] | 4.106 [3.37%] | 0.866 [3.25%] | |
| 0.2C | 30.33 [1.65%] | 4.099 [3.18%] | 0.872 [3.89%] | |
| 0.3C | 30.19 [1.19%] | 4.152 [4.51%] | 0.872 [3.92%] | |
| … | … | … | … | … |
The results demonstrate that the three feature resistances can be estimated online with good accuracy (most errors under 4%) within a very short measurement time (2-3 minutes), compared to ~35 minutes for a full EIS scan.
The final SOH estimation performance is shown in the following table, comparing the true SOH (from capacity measurement) with the estimated SOH using the weighted model with the calculated feature resistances.
| True Capacity (mAh) [SOH%] | Condition | Estimated SOH% | Absolute Error |
|---|---|---|---|
| 3483 [99.51%] | 0C | 100.49% | 0.98% |
| 3433 [98.09%] | 0.1C | 98.37% | 0.28% |
| 3430 [98.00%] | 0.2C | 98.28% | 0.28% |
| 3410 [97.43%] | 0.3C | 96.63% | 0.80% |
| 3388 [96.80%] | 0.2C | 96.62% | 0.18% |
The maximum absolute error in SOH estimation is kept within 2%, validating the effectiveness of the proposed multi-point impedance method for online rapid diagnosis of the lithium-ion battery’s state of health.
Conclusion
This work presents a comprehensive framework for the online rapid diagnosis of lithium-ion battery State of Health. By leveraging DRT analysis to deconstruct the electrochemical impedance spectrum, we gain physical insight into the dominant polarization processes within the lithium-ion battery. This insight guides the selection of a minimal set of characteristic frequencies that probe specific internal resistances (\(R_O, R_C, R_{SEI}\)) which are strong indicators of aging yet exhibit low sensitivity to State of Charge variations.
The proposed multi-frequency superposition injection technique is a key innovation, enabling the simultaneous acquisition of these key impedance features in a time frame short enough (2-3 minutes) to consider the battery’s state quasi-stationary. This addresses a major limitation of traditional EIS for online use. The subsequent SOH estimation model, based on a weighted combination of the increases in these feature resistances, provides accurate results with errors typically below 2%.
Compared to full EIS with complex nonlinear fitting or simple single-frequency resistance measurements, this method offers an excellent balance between speed, hardware simplicity, information richness, and estimation accuracy. It represents a significant step towards practical, online-capable health monitoring systems for lithium-ion batteries in real-world applications such as electric vehicles and grid storage, where timely and accurate diagnosis is crucial for safety, performance, and longevity.
Future work will focus on extending this methodology to account for the influence of temperature on the impedance characteristics of the lithium-ion battery and on investigating the correlation between the extracted weight factors (\(\alpha, \beta, \delta\)) and specific, dominant aging mechanisms (like lithium plating or active material loss) for different lithium-ion battery chemistries.