
The global push towards “carbon peak” and “carbon neutrality” has catalyzed the rapid growth of industries such as new energy vehicles and energy storage. Within this landscape, the lithium-ion battery stands out due to its high energy conversion efficiency, superior cycle performance, and portability. It has become the cornerstone technology for applications ranging from large-scale energy storage stations and electric vehicles to portable electronic devices. The performance and safety of these systems are intrinsically tied to the health of their constituent lithium-ion battery cells.
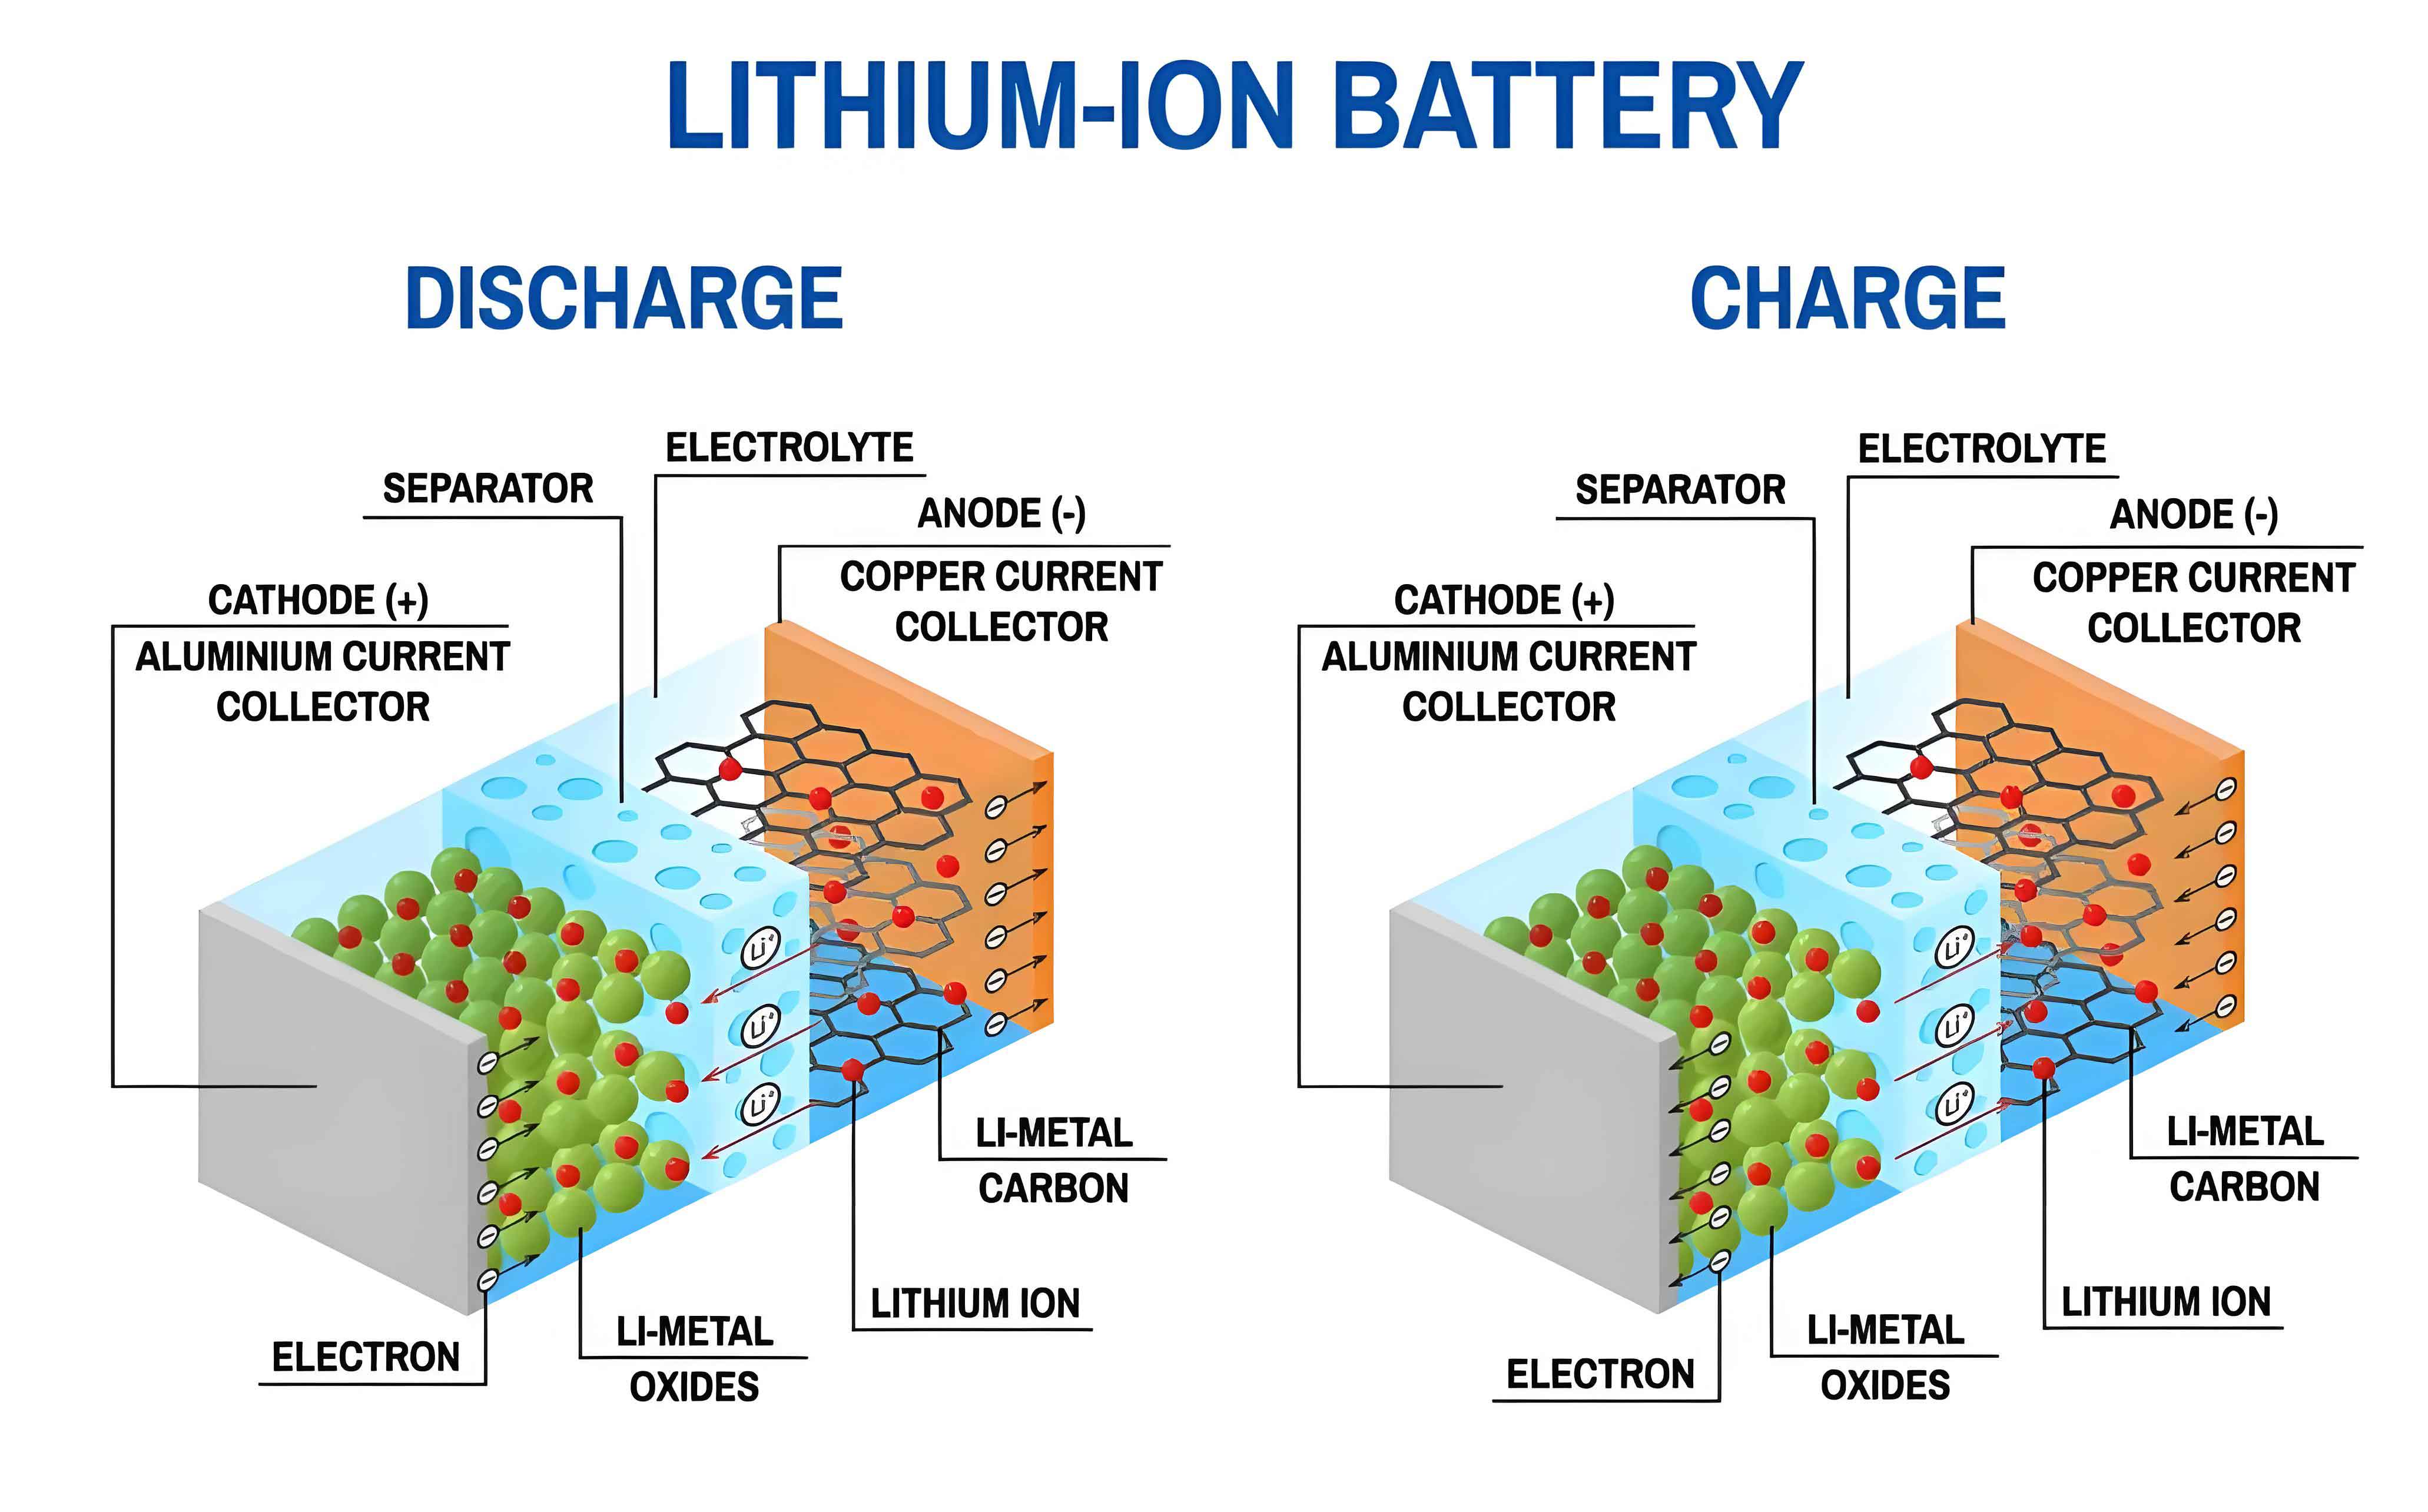
However, a critical safety challenge persists: the lithium plating reaction. During charging, especially under harsh conditions like low temperatures or high rates, lithium ions ($\mathrm{Li^+}$) can be reduced to metallic lithium ($\mathrm{Li^0}$) on the surface of the graphite anode instead of intercalating into it. This side reaction is detrimental. While a portion of this plated lithium can reversibly strip and intercalate during constant-voltage charging or rest periods, a fraction reacts irreversibly with the electrolyte to form “dead lithium.” The accumulation of dead lithium leads to active lithium loss and capacity fade. More dangerously, repeated lithium plating can grow dendritic structures that puncture the separator, causing an internal short circuit, which can escalate into thermal runaway—a catastrophic failure mode involving fire or explosion.
Consequently, reliable detection of lithium plating is paramount for battery safety management. Existing methods often fall short for real-world applications. Physical detection techniques, such as scanning electron microscopy (SEM) or X-ray diffraction (XRD), require specialized, expensive equipment and are inherently offline and destructive. Post-mortem electrochemical methods, like differential voltage (dV/dQ) analysis, are effective for diagnosis after a cycle but cannot provide real-time warnings. Therefore, there is a pressing need for an online, non-invasive detection technique that can be integrated into a Battery Management System (BMS).
Electrochemical Impedance Spectroscopy (EIS) emerges as a powerful candidate. It probes the kinetic and interfacial properties of a lithium-ion battery by applying a small-amplitude alternating current (AC) perturbation and measuring the voltage response. The impedance spectrum is highly sensitive to changes in charge transfer and surface film properties, which are directly influenced by lithium plating. This paper presents a comprehensive methodology for the online detection of lithium plating based on the real-time measurement and analysis of a lithium-ion battery‘s electrochemical impedance at a characteristic frequency.
Theoretical Foundation: Impedance Model Analysis of Lithium Plating
To establish a theoretical basis for detection, we first analyze the impact of lithium plating on the impedance characteristics of a lithium-ion battery. A common approach is to use an Equivalent Circuit Model (ECM) to represent the physical electrochemical processes. A fractional-order ECM offers superior accuracy in capturing the distributed time constants and diffusion phenomena inherent to batteries compared to integer-order models.
The impedance of a healthy lithium-ion battery during normal operation can be effectively modeled by the circuit shown below. The key components are:
- $L$: Inductance from wires and current collectors (high-frequency feature).
- $R_0$: Ohmic resistance from electrolyte, electrodes, and contacts (high-frequency real-axis intercept).
- $R_{sei}$ & $Q_{sei}$: Resistance and constant phase element (CPE) of the Solid-Electrolyte Interphase (SEI) layer. The CPE, $Q$, accounts for the non-ideal capacitive behavior due to surface heterogeneity. This parallel combination models the first semicircle in the mid-to-high frequency range of a Nyquist plot.
- $R_{ct}$ & $Q_{dl}$: Charge transfer resistance and double-layer CPE. This parallel combination models the interfacial charge transfer kinetics, appearing as the second, larger semicircle in the mid-frequency range. $Q_{dl}$ is often used interchangeably with $Q_{ct}$ to represent the double-layer capacitance.
- $W$: Warburg impedance, representing semi-infinite linear diffusion of lithium ions within the active material particles, manifesting as a ~45° line at low frequencies.
The fundamental charging reaction at the graphite anode is lithium intercalation:
$$\mathrm{xLi^+ + xe^- + Li_\delta C_6 \rightarrow Li_{\delta+x}C_6} \quad \text{(Reaction 1)}$$
When lithium plating initiates, a competing reaction occurs simultaneously on the anode surface:
$$\mathrm{yLi^+ + ye^- \rightarrow yLi^0} \quad \text{(Reaction 2)}$$
This metallic lithium ($\mathrm{Li^0}$) can subsequently follow two paths: reversible stripping/intercalation or irreversible side reactions forming dead lithium.
The critical insight for detection is that Reaction 2 creates a new, parallel charge transfer pathway. In the ECM framework, the standard charge transfer impedance $R_{ct}$ (for intercalation) is now shunted by a new impedance element $R_{ct,Li}$ associated with the plating/stripping process. The effective charge transfer impedance for the anode interface becomes the parallel combination:
$$R_{ct, eff} = \left( \frac{1}{R_{ct}} + \frac{1}{R_{ct,Li}} \right)^{-1}$$
Typically, the plating reaction has faster kinetics under the conditions that induce it (e.g., low temperature, high overpotential), meaning $R_{ct,Li} < R_{ct}$. Therefore, the onset of lithium plating causes a decrease in the overall effective charge transfer impedance $R_{ct, eff}$. Since $R_{ct}$ is a dominant component of the battery’s impedance in the mid-frequency range (typically ~1 Hz to ~100 Hz), a detectable drop in the total impedance magnitude at these frequencies is expected when plating begins. This forms the core hypothesis of our online detection method: monitoring the impedance at a characteristic frequency within the charge-transfer region can reveal the unique “accelerated decay” signature caused by the parallel plating pathway.
Experimental Methodology: Online Impedance Measurement and Test Design
Design of the Online Impedance Measurement Device
Real-time impedance monitoring requires a dedicated measurement system compatible with operational battery cycling. We designed a device based on the digital lock-in amplifier principle for high precision and noise immunity. The key aspects are:
- Excitation Method: A current excitation is preferred over voltage excitation to avoid large current surges. A low-amplitude sinusoidal current perturbation $I_{ac}(t) = I_0 \sin(\omega t)$ is injected, with $I_0$ typically set to 0.05C to ensure system linearity.
- Signal Generation: The perturbation signal is generated digitally using a Direct Digital Synthesizer (DDS) for frequency accuracy and flexibility.
- Current Source: A bipolar voltage-controlled current source (VCCS) circuit converts the voltage signal from the DDS into a precise AC current.
- Four-Wire (Kelvin) Measurement: To eliminate the influence of lead and contact resistances, separate force and sense lines are used for current injection and voltage sensing, respectively.
- Signal Processing & Impedance Calculation: The battery’s voltage response $V_{ac}(t)$ and the known current $I_{ac}(t)$ are sampled. A digital lock-in algorithm performs cross-correlation with reference sine and cosine waves at the excitation frequency $\omega$ to extract the in-phase and quadrature components, yielding the complex impedance $Z(\omega)=V_{ac}/I_{ac}=Z’ + jZ”$. The magnitude $|Z|$ and phase $\phi$ are computed as:
$$|Z| = \sqrt{(Z’)^2 + (Z”)^2}, \quad \phi = \arctan\left(\frac{Z”}{Z’}\right)$$
Validation tests comparing this device with a commercial potentiostat (e.g., CHI660E) on precision resistors and various lithium-ion battery cells showed excellent agreement, with errors in impedance magnitude typically below 0.5 mΩ in the relevant frequency range.
Cell Preparation and Experimental Platform
The test platform integrates a battery cycler, a thermal chamber, the custom impedance device, and a data acquisition system. Commercial 18650 cylindrical cells with NCA cathodes and graphite anodes (nominal capacity: 3500 mAh) were used. All cells underwent standard formation and aging cycles prior to testing to ensure consistency. Static EIS scans from 10 kHz to 0.1 Hz were performed at different States of Charge (SOC) and temperatures using a potentiostat to establish baseline behavior and identify the characteristic frequency range related to charge transfer.
Experimental Protocol for Lithium Plating Induction and Detection
To study and validate the detection method, lithium plating was deliberately induced under controlled stressful charging conditions. The primary variables were ambient temperature and charging current (C-rate). The experimental matrix is summarized in the table below.
| Temperature (°C) | Charging C-rates Tested | Discharge C-rate | Objective |
|---|---|---|---|
| -10 | 0.1C, 0.25C, 0.5C, 0.75C | 0.2C | Induce varying degrees of lithium plating; Monitor online impedance during charge; Validate plating via dV/dQ analysis post-cycle. |
| -5 | 0.1C, 0.25C, 0.5C, 0.75C, 1C | ||
| 0 | 0.1C, 0.25C, 0.5C, 0.75C, 1C | ||
| 5 | 0.25C, 0.5C, 0.75C, 1C |
For each test, the cell was stabilized at the target temperature for 2 hours. Charging was performed in constant-current (CC) mode only (without the subsequent constant-voltage phase) to a fixed voltage limit (e.g., 4.2V). During the entire CC charge, the online impedance device continuously measured the battery’s impedance at a fixed, single frequency. Following the charge, the cell was discharged at 0.2C. The discharge voltage profile was then analyzed using the dV/dQ method to independently confirm the occurrence and quantify the amount of reversible lithium plating, serving as the “ground truth” for validating the impedance-based detection.
Results and Discussion: Impedance Signature of Lithium Plating
Static EIS Analysis: Influence of Temperature and SOC
Static EIS measurements provide context for understanding dynamic changes. As expected, temperature has a profound effect. The overall impedance decreases significantly with increasing temperature, as lower temperatures slow down ionic conductivity and charge transfer kinetics. The two semicircles (SEI and charge transfer) become increasingly overlapped and less distinguishable as temperature rises.
At a fixed temperature, the ohmic resistance $R_0$ and the high-frequency SEI impedance remain relatively constant with SOC. In contrast, the mid-frequency charge transfer resistance $R_{ct}$ and the low-frequency Warburg diffusion impedance decrease as SOC increases. This is because a higher SOC (higher lithium concentration in the anode) facilitates both the intercalation reaction kinetics and solid-state diffusion. The most significant drop in $R_{ct}$ typically occurs between 10% and 30% SOC, with the rate of change diminishing at higher SOC levels. This baseline behavior is crucial for distinguishing normal impedance evolution from plating-induced anomalies.
Determination of the Characteristic Monitoring Frequency
Online monitoring requires selecting an optimal single frequency that is sensitive to changes in $R_{ct}$. From the static EIS Bode plots, the frequency region where the phase angle is most negative (often between 1 Hz and 70 Hz for the tested cells) corresponds to the dominance of the charge transfer process. We conducted dynamic charging tests at 25°C under normal conditions (1C charge) while monitoring impedance at multiple candidate frequencies (5 Hz, 10 Hz, 20 Hz, 30 Hz). The impedance magnitude $|Z|$ at all frequencies showed a gradual decrease during charge, consistent with the decreasing $R_{ct}$ trend from static EIS. Lower frequencies exhibited a larger magnitude and a more pronounced change, offering higher sensitivity. A balance must be struck between sensitivity, measurement speed (lower frequencies require longer settling time), and signal-to-noise ratio. Based on these tests, 10 Hz was selected as the characteristic monitoring frequency, offering a strong signal related to charge transfer while enabling rapid sampling for real-time detection.
Dynamic Impedance Response and Plating Feature Extraction
The core results from the low-temperature charging tests are presented in the form of impedance magnitude $|Z|_{10\text{Hz}}$ versus charged capacity. Under all conditions, the impedance starts at a high value (due to low temperature) and initially decreases as charging progresses—a combination of increasing SOC and mild temperature rise from internal heating.
The critical observation is the deviation from this baseline trend. In most tests, after an initial period of gradual decay, the impedance curve exhibits a distinct accelerated decay or a “kink.” This point of inflection is identified as the onset of lithium plating. For instance, at -10°C and 0.5C charging, the impedance decreases smoothly until approximately 800 mAh of capacity is charged, after which the slope steepens markedly.
To quantitatively identify this inflection point, we calculate the instantaneous rate of impedance change with respect to capacity, $\eta = d|Z|/dQ$. Under normal conditions, $\eta$ is negative and relatively constant or changing slowly. The onset of plating is signaled by a sharp, sudden decrease in $\eta$ (i.e., the decay accelerates). The SOC or capacity at which this minimum in $d|Z|/dQ$ occurs is defined as the “Plating Onset SOC.”
The analysis of all test data reveals clear trends:
- Temperature Effect: At the same C-rate, lower temperatures lead to a higher initial impedance and an earlier Plating Onset SOC (at a lower charged capacity).
- C-rate Effect: At the same temperature, a higher C-rate generally leads to an earlier Plating Onset SOC. However, at very high C-rates, the charging time to the voltage cutoff is so short that it can sometimes limit the total duration of plating, slightly affecting the trend.
Notably, in three mild condition tests (-5°C/0.1C, 0°C/0.1C, 5°C/0.25C), no accelerated decay signature was observed in the impedance trajectory. The impedance followed a smooth, monotonically decreasing curve, suggesting the absence of significant plating under these conditions.
Validation via Differential Voltage (dV/dQ) Analysis
The impedance-based detection is validated against the established post-cycle dV/dQ analysis. When reversible lithium plating occurs during charge, the subsequent discharge curve shows a characteristic high-voltage plateau at the very beginning, corresponding to the stripping of the plated metallic lithium. The derivative of the discharge curve, dV/dQ, shows a distinct “lithium stripping peak.”
The results from the dV/dQ analysis correlate perfectly with the impedance findings:
- All cells that exhibited the accelerated impedance decay feature showed a clear lithium stripping peak in their dV/dQ curve.
- The three cells that did not show the impedance decay feature (-5°C/0.1C, 0°C/0.1C, 5°C/0.25C) also lacked a lithium stripping peak, confirming the absence of plating.
Furthermore, the amount of charge under the dV/dQ stripping peak provides a quantitative measure of the reversible plated lithium. This amount generally increased with more severe plating conditions (lower temperature, higher C-rate), as summarized below:
| Condition (Temp / C-rate) | Impedance Decay Feature? | dV/dQ Stripping Peak? | Estimated Reversible Li Plated (mAh) |
|---|---|---|---|
| -10°C / 0.5C | Yes | Yes | ~406 |
| 0°C / 0.75C | Yes | Yes | ~254 |
| 5°C / 0.5C | Yes | Yes | ~85 |
| 0°C / 0.1C | No | No | ~0 |
The strong agreement between the online impedance signature and the offline dV/dQ validation confirms the efficacy and reliability of the proposed method for detecting the onset of lithium plating in real-time.
Conclusion and Outlook
This work has developed and validated an online, non-invasive method for detecting lithium plating in lithium-ion battery cells based on single-frequency electrochemical impedance measurement. The core conclusions are:
- The onset of lithium plating introduces a parallel charge transfer pathway, reducing the effective charge transfer resistance ($R_{ct,eff}$) of the anode. This manifests as an accelerated decay in the real-time impedance magnitude measured at a frequency sensitive to the charge transfer process (e.g., 10 Hz).
- A dedicated online impedance measurement device, employing a digital lock-in technique and four-wire sensing, can reliably track this impedance during operation.
- The characteristic impedance decay feature is consistently observed under stressful charging conditions (low temperature, high C-rate) and its onset point correlates with the severity of the condition. The method successfully distinguished plating conditions from non-plating mild conditions.
- The detection results were unequivocally validated by the presence or absence of the lithium stripping peak in post-cycle dV/dQ analysis.
The proposed method offers significant practical advantages: it is online, non-destructive, and can be implemented with relatively simple hardware compared to full EIS scans, making it a promising candidate for integration into advanced BMS for safety warning and charging protocol adaptation. Future work will focus on extending the detection algorithm to account for other factors like cell aging, expanding the validation to overcharge-induced plating scenarios, and developing robust strategies to translate the detected impedance inflection point into actionable BMS commands (e.g., reducing charge current or initiating a remedial discharge) to mitigate plating and enhance the safety and longevity of lithium-ion battery systems.