
In the context of global efforts towards sustainable energy solutions, lithium iron phosphate (LiFePO4) batteries have emerged as a cornerstone technology, particularly in the electric vehicle and energy storage sectors. As a researcher focused on material life cycle engineering, I find it imperative to assess the environmental footprint of these batteries, especially regarding resource depletion. The increasing production of LiFePO4 batteries, while driving technological advancement, raises significant concerns about the exhaustion of abiotic resources. This study delves into the resource consumption intensity of LiFePO4 batteries by applying multiple characterization methods within a life cycle assessment (LCA) framework. The goal is to provide a comprehensive evaluation that can inform better resource management and sustainable design practices for LiFePO4 battery systems.
Life cycle assessment is a standardized methodology (ISO 14040/44) that evaluates environmental impacts associated with all stages of a product’s life, from raw material extraction to disposal. However, the impact assessment phase, particularly for resource depletion, remains contentious due to the lack of consensus on appropriate metrics. Numerous characterization models exist, each based on different philosophical underpinnings—such as scarcity, future extraction effort, or thermodynamic principles. For LiFePO4 batteries, which rely heavily on metals like lithium, iron, phosphorus, copper, and aluminum, a multifaceted assessment is crucial. This study selects five prominent methods: abiotic depletion potential (ADP), anthropogenic stock extended abiotic depletion potential (AADP), surplus ore potential (SOP), thermodynamic rarity (TheRy), and cumulative exergy demand (CExD). By comparing these methods, we aim to highlight how different perspectives shape the evaluation of resource depletion for LiFePO4 batteries, ultimately aiding stakeholders in making informed decisions.
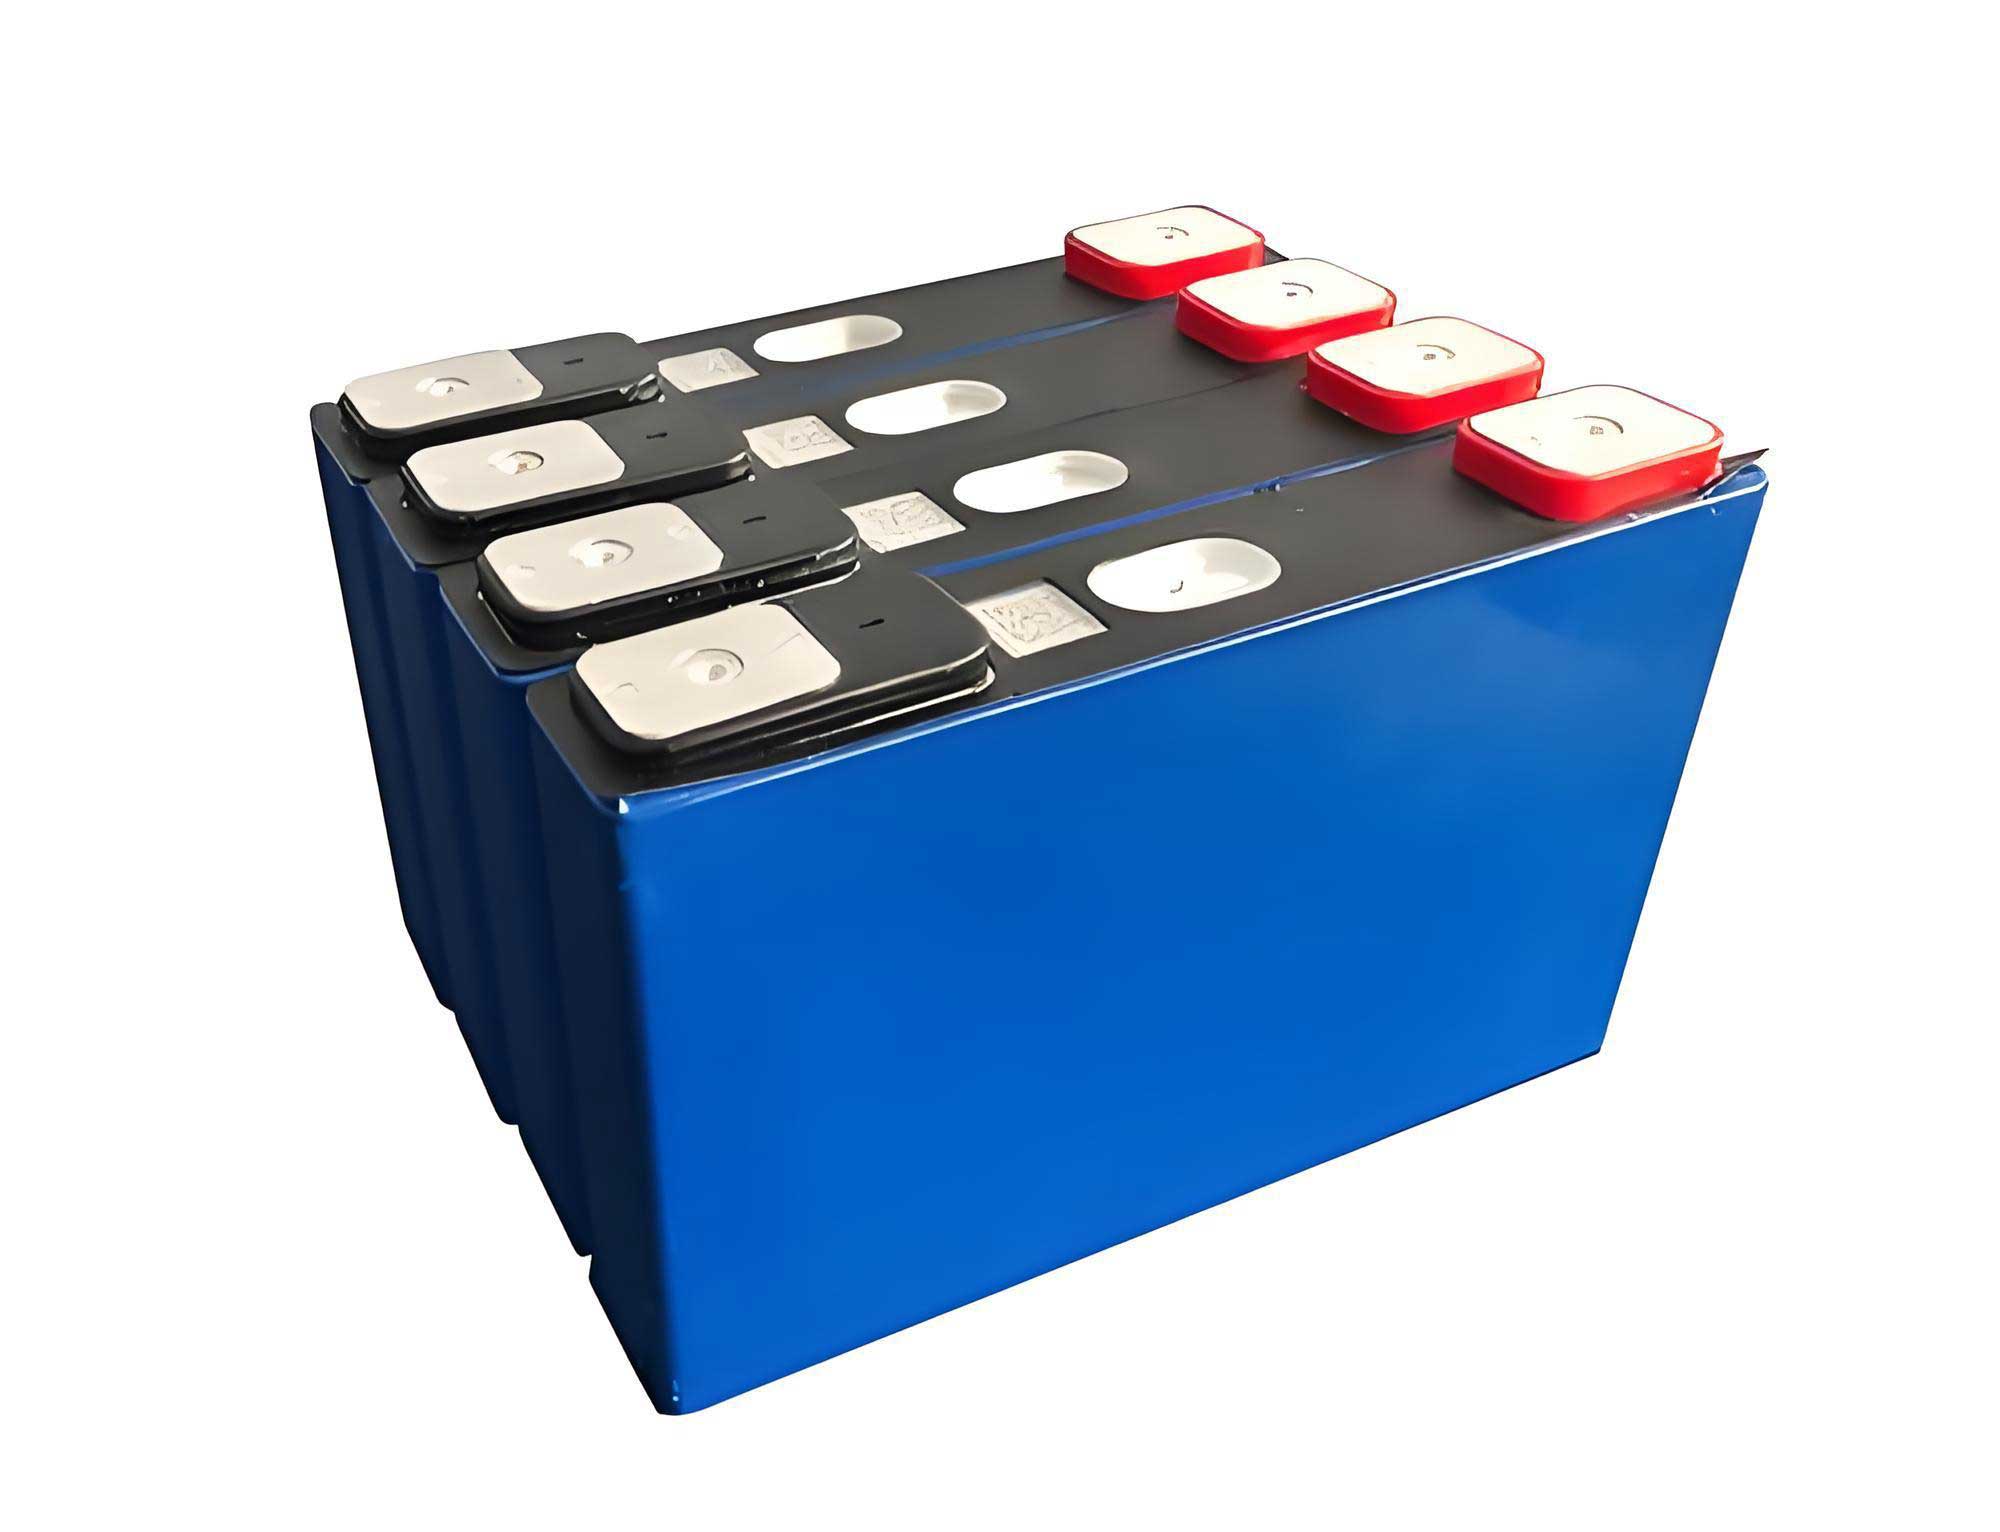
The core motivation for this research stems from the dominant position of LiFePO4 battery production in markets like China, where their high volume manufacturing amplifies resource depletion risks. A thorough characterization of these impacts is not just an academic exercise; it is a practical necessity for guiding circular economy strategies, such as recycling and material substitution. In this analysis, I adopt a first-person perspective to walk through the methodology, data, and findings, emphasizing the intricate interplay between battery components and resource metrics. The functional unit is defined as 1 kWh of battery capacity, ensuring comparability across studies. The system boundary encompasses raw material acquisition, production manufacturing, and assembly stages, excluding use and end-of-life phases to focus solely on upstream resource consumption. This boundary allows for a detailed dissection of the LiFePO4 battery’s material and energy inputs.
To set the stage, let me outline the key parameters of the LiFePO4 battery system under study. The battery pack is designed for an electric vehicle with a total mass of 600 kg and an energy density of 95 Wh/kg, resulting in a capacity of 57 kWh. The vehicle weight is 2380 kg, with an electricity consumption of 19.5 kWh per 100 km and a range of 300 km per charge. Over a lifetime of 200,000 km, the battery’s performance is critical, but our focus remains on the production phase. The inventory data for manufacturing 1 kWh of LiFePO4 battery capacity are derived from literature and databases, encompassing materials like lithium iron phosphate, graphite, aluminum foil, copper foil, and various chemicals, as well as energy inputs from electricity and natural gas. The following table summarizes the material and energy inventory per functional unit.
| Category | Material/Energy | Unit | Quantity per 1 kWh |
|---|---|---|---|
| Materials | Lithium iron phosphate (LiFePO4) | kg | 2.41E+00 |
| Graphite | kg | 1.05E+00 | |
| Polyvinylidene fluoride (PVDF) | kg | 5.11E-02 | |
| Carbon nanotubes | kg | 1.45E-01 | |
| N-methyl-2-pyrrolidone (NMP) | kg | 1.25E+00 | |
| Aluminum foil | kg | 6.02E-01 | |
| Copper foil | kg | 9.04E-01 | |
| Separator | kg | 6.10E-01 | |
| Lithium hexafluorophosphate (LiPF6) | kg | 2.83E-01 | |
| Ethylene carbonate (EC) | kg | 7.98E-01 | |
| Dimethyl carbonate (DMC) | kg | 7.98E-01 | |
| Cell aluminum casing | kg | 2.80E-01 | |
| Components | Battery management system (BMS) | kg | 1.58E-01 |
| Cooling system | kg | 1.68E-01 | |
| Module components | kg | 8.05E-01 | |
| Battery pack enclosure | kg | 4.37E-01 | |
| Energy | Electricity | kWh | 1.20E+02 |
| Natural gas | m³ | 2.67E+00 | |
| Transportation (diesel) | t·km | 2.17E+00 |
The production of a LiFePO4 battery involves multiple stages: positive electrode preparation, negative electrode preparation, separator integration, electrolyte filling, cell assembly, and system integration including the battery management system (BMS). Each stage consumes specific resources, and the cumulative effect is what we aim to characterize. For instance, the positive electrode requires lithium iron phosphate and aluminum foil, while the negative electrode uses graphite and copper foil. The BMS, though small in mass, contains critical electronic components like resistors and transistors that involve precious metals. Background data for materials like copper, aluminum, and graphite are sourced from prior LCA studies and databases, ensuring a robust inventory.
Now, let me delve into the five resource depletion characterization methods applied to the LiFePO4 battery. Each method offers a unique lens through which resource consumption is quantified, based on factors like crustal abundance, anthropogenic reserves, future extraction effort, or thermodynamic properties. The selection of these methods allows for a comparative analysis that captures different aspects of resource depletion. Below is a table summarizing the number of resource types covered by each method, which influences the comprehensiveness of the assessment.
| Method Name | Metals & Metalloids | Non-metals | Minerals | Total Resources |
|---|---|---|---|---|
| ADP | 49 | 9 | 0 | 58 |
| AADP | 33 | 0 | 0 | 33 |
| SOP | 45 | 4 | 26 | 75 |
| TheRy | 47 | 0 | 6 | 53 |
| CExD | 86 | 0 | 37 | 123 |
Starting with abiotic depletion potential (ADP), this method evaluates resource scarcity based on the ultimate reserves in the Earth’s crust. The characterization factor for a resource i is calculated as the inverse of its crustal abundance, normalized to antimony (Sb). The ADP for a product is given by:
$$ADP = \sum_{i} (m_i \times ADP_i)$$
where \( m_i \) is the mass of resource i consumed, and \( ADP_i \) is its characterization factor in kg Sb equivalent per kg. For the LiFePO4 battery, this method highlights resources with low natural abundance, such as gold or rare metals used in electronics.
The anthropogenic stock extended abiotic depletion potential (AADP) builds on ADP by incorporating anthropogenic reserves—i.e., resources already extracted and available in products for recycling. This adjustment reflects a more optimistic view of resource availability due to circular economy potentials. The formula is similar:
$$AADP = \sum_{i} (m_i \times AADP_i)$$
where \( AADP_i \) includes both natural and anthropogenic reserves. In the context of LiFePO4 batteries, this method can significantly reduce the depletion score for metals like copper and aluminum, which have high recycling rates.
Surplus ore potential (SOP) focuses on the future effort required to extract resources as ore grades decline. It quantifies the additional ore that must be mined to obtain a unit of resource, normalized to copper (Cu). The characterization considers geological and economic factors. The SOP is expressed as:
$$SOP = \sum_{i} (m_i \times SOP_i)$$
with \( SOP_i \) in kg Cu equivalent per kg. This method is particularly relevant for LiFePO4 batteries because it emphasizes resources like lithium and graphite, where mining intensity is increasing due to demand.
Thermodynamic rarity (TheRy) approaches resource depletion from an energy perspective, measuring the exergy required to extract and refine a resource from a completely dissipated state in the Earth’s crust. It accounts for mineralogical composition and processing energy. The formula is:
$$TheRy = \sum_{i} (m_i \times TheRy_i)$$
where \( TheRy_i \) is in MJ per kg. For LiFePO4 batteries, this method underscores the high energy cost associated with metals like aluminum and lithium, reflecting their thermodynamic rarity.
Finally, cumulative exergy demand (CExD) calculates the total exergy consumed over the life cycle, including both natural resources and energy carriers. Exergy represents the useful work potential of a resource. The CExD is given by:
$$CExD = \sum_{j} (E_j \times CExD_j) + \sum_{i} (m_i \times CExD_i)$$
where \( E_j \) is energy input j, \( CExD_j \) is its exergy factor, and \( CExD_i \) is the exergy factor for material i. This method provides a holistic view of resource quality loss, relevant for LiFePO4 battery production where electricity and fossil fuels play a key role.
Applying these methods to the LiFePO4 battery inventory yields distinct characterization results. The following table presents the overall scores per 1 kWh capacity, illustrating the divergence among methods.
| Method | Result | Unit |
|---|---|---|
| ADP | 2.29E-01 | kg Sb eq |
| AADP | 2.38E-03 | kg Sb eq |
| SOP | 1.26E+01 | kg Cu eq |
| TheRy | 3.18E+03 | MJ |
| CExD | 2.91E+02 | MJ |
The ADP value of 0.229 kg Sb eq indicates a moderate depletion potential when viewed through the lens of crustal scarcity. In contrast, the AADP value is two orders of magnitude lower (0.00238 kg Sb eq), demonstrating how anthropogenic reserves drastically mitigate perceived depletion for LiFePO4 batteries. The SOP result of 12.6 kg Cu eq suggests substantial future mining effort, while the TheRy score of 3180 MJ highlights the high thermodynamic cost. The CExD result of 291 MJ reflects the cumulative exergy demand, which is lower than TheRy because it does not assume complete dissipation. These differences underscore that no single method tells the full story; each captures a specific dimension of resource depletion for LiFePO4 batteries.
To understand which processes drive these impacts, I analyzed the contribution of each production stage across the five methods. The LiFePO4 battery manufacturing is divided into positive electrode preparation, negative electrode preparation, separator and electrolyte integration, cell assembly, BMS preparation, cooling system, module assembly, and pack enclosure. The percentage contributions are summarized below, with stages contributing less than 1% aggregated as “others.”
| Production Stage | ADP Contribution (%) | AADP Contribution (%) | SOP Contribution (%) | TheRy Contribution (%) | CExD Contribution (%) |
|---|---|---|---|---|---|
| Positive Electrode Preparation | 3.15 | 50.75 | 44.82 | 55.40 | 12.67 |
| Negative Electrode Preparation | 10.22 | 15.30 | 48.53 | 18.95 | 56.19 |
| Separator & Electrolyte | 0.89 | 5.21 | 1.05 | 3.78 | 4.33 |
| Cell Assembly | 0.45 | 2.10 | 0.67 | 1.23 | 1.89 |
| BMS Preparation | 85.24 | 20.15 | 2.31 | 12.05 | 18.22 |
| Cooling System | 0.12 | 1.89 | 0.45 | 1.89 | 2.10 |
| Module Assembly | 0.05 | 2.31 | 0.89 | 2.67 | 1.05 |
| Pack Enclosure | 0.08 | 1.29 | 1.28 | 4.03 | 3.55 |
For ADP, the BMS preparation stage dominates with 85.24%, due to the use of gold and other scarce metals in electronic components. In AADP, positive electrode preparation contributes 50.75%, driven by cadmium and copper, whose anthropogenic reserves are limited. SOP shows high contributions from both negative electrode preparation (48.53%) and positive electrode preparation (44.82%), reflecting the surplus ore potential for graphite and lithium. TheRy is led by positive electrode preparation at 55.40%, owing to the thermodynamic rarity of aluminum and lithium. CExD is dominated by negative electrode preparation at 56.19%, primarily due to the exergy demand for copper production. These variations reveal that the critical stages for resource depletion depend on the evaluation metric, emphasizing the need for a multi-method approach in assessing LiFePO4 batteries.
Drilling down further, I examined the contribution of individual resources within each method. This analysis identifies which materials are most responsible for the characterization scores. The table below lists the top contributing resources for each method, with others grouped as “remaining resources.”
| Method | Top Contributing Resources | Contribution (%) |
|---|---|---|
| ADP | Gold (Au) | 79.37 |
| ADP | Copper (Cu) | 14.41 |
| ADP | Remaining resources | 6.22 |
| AADP | Cadmium (Cd) | 52.28 |
| AADP | Copper (Cu) | 27.70 |
| AADP | Remaining resources | 20.02 |
| SOP | Lithium (Li) | 41.32 |
| SOP | Graphite (C) | 40.52 |
| SOP | Remaining resources | 18.16 |
| TheRy | Aluminum (Al) | 33.69 |
| TheRy | Lithium (Li) | 33.04 |
| TheRy | Graphite (C) | 18.05 |
| TheRy | Remaining resources | 15.22 |
| CExD | Copper (Cu) | 59.90 |
| CExD | Gold (Au) | 17.64 |
| CExD | Remaining resources | 22.46 |
Gold emerges as the dominant resource in ADP, contributing 79.37%, despite its minimal mass in the LiFePO4 battery. This is because gold has an extremely low crustal abundance, giving it a high ADP factor. Copper also plays a role due to its use in foils and wiring. In AADP, cadmium takes the lead (52.28%), as it has limited anthropogenic reserves for recycling, while copper remains significant. For SOP, lithium and graphite are the key drivers, accounting for over 80% combined, which aligns with the intensive mining required for these materials in LiFePO4 batteries. TheRy highlights aluminum and lithium, both energy-intensive to produce, followed by graphite. CExD underscores copper’s high exergy demand (59.90%), with gold again appearing due to its refining energy. Notably, lithium is a major contributor in SOP and TheRy but minimal in ADP and AADP, illustrating how its depletion profile shifts based on the method’s focus—whether on scarcity, future effort, or energy.
The implications of these findings are profound for the design and policy surrounding LiFePO4 batteries. For instance, the prominence of gold in ADP suggests that efforts to reduce scarce metal usage in BMS components could mitigate depletion concerns from a scarcity viewpoint. However, from an energy perspective (TheRy and CExD), aluminum and copper are more critical, pointing to opportunities in material efficiency or alternative conductors. The high SOP for lithium and graphite calls for innovations in mining technology or recycling to reduce future ore demand. Moreover, the stark reduction from ADP to AADP underscores the value of circular economy strategies, such as urban mining and battery recycling, in alleviating resource depletion for LiFePO4 batteries. This multi-method analysis enables a balanced decision-making framework that avoids over-reliance on a single metric.
To elaborate on the methodological nuances, let me present some derived formulas that link inventory data to characterization factors. For a resource i in the LiFePO4 battery, the contribution to ADP can be expressed as:
$$ADP_i = m_i \times \frac{1}{R_i} \times \frac{1}{CF_{Sb}}$$
where \( R_i \) is the ultimate reserve of resource i in kg, and \( CF_{Sb} \) is the normalization factor for antimony. Similarly, for AADP, the anthropogenic stock \( S_i \) is included:
$$AADP_i = m_i \times \frac{1}{R_i + S_i} \times \frac{1}{CF_{Sb}}$$
For SOP, the characterization factor relates to the ore grade decline:
$$SOP_i = m_i \times \frac{O_i}{G_i} \times \frac{1}{CF_{Cu}}$$
where \( O_i \) is the ore surplus factor and \( G_i \) is the average ore grade. In TheRy, the exergy is computed based on concentration and processing:
$$TheRy_i = m_i \times \left( RT \ln \frac{C_0}{C_i} + E_{proc,i} \right)$$
with \( R \) as the gas constant, \( T \) temperature, \( C_0 \) reference concentration, \( C_i \) resource concentration, and \( E_{proc,i} \) processing exergy. For CExD, the formula integrates both materials and energy:
$$CExD = \sum_i m_i \times ex_i + \sum_j E_j \times ex_j$$
where \( ex \) denotes specific exergy. These equations highlight the theoretical foundations that shape the results for LiFePO4 batteries.
In discussing the limitations, it’s important to note that each method has inherent assumptions. ADP relies on crustal abundance data, which may be uncertain for some elements. AADP assumes that anthropogenic reserves are fully available for recycling, which may not be practical due to technical or economic barriers. SOP depends on projections of ore grade decline, which can vary with technology. TheRy uses thermodynamic models that may oversimplify geological complexities. CExD requires comprehensive exergy databases, which might lack data for novel materials. For LiFePO4 batteries, these limitations mean that the results should be interpreted as indicative rather than absolute. Future research could refine these methods by incorporating dynamic modeling or spatial differentiation, especially for geographically concentrated resources like lithium.
The broader context of LiFePO4 battery production also involves trade-offs with other environmental impacts, such as greenhouse gas emissions or water use, but this study focuses solely on resource depletion. Nonetheless, the insights here can complement full LCA studies to achieve a holistic sustainability assessment. For example, reducing copper usage in LiFePO4 batteries might lower CExD but could increase weight and affect energy efficiency. Therefore, integrated design strategies are essential.
In conclusion, this comprehensive analysis of resource depletion characterization for LiFePO4 batteries using five distinct methods reveals multifaceted insights. The ADP method highlights the scarcity of gold in BMS components, with a score of 0.229 kg Sb eq. The AADP method, incorporating anthropogenic reserves, shows a much lower value of 0.00238 kg Sb eq, emphasizing cadmium’s role. SOP indicates significant future mining effort for lithium and graphite, at 12.6 kg Cu eq. TheRy underscores the high thermodynamic rarity of aluminum and lithium, totaling 3180 MJ. CExD points to copper’s exergy demand as dominant, at 291 MJ. The contributions vary across production stages: BMS preparation is key for ADP, positive electrode for AADP and TheRy, negative electrode for SOP and CExD. These findings underscore that the choice of characterization method profoundly influences which resources and processes are identified as critical for LiFePO4 batteries. No single method is superior; instead, a combination provides a robust picture to guide sustainable material management. For stakeholders in the LiFePO4 battery industry, this study recommends adopting a multi-metric approach in environmental assessments, prioritizing resource efficiency in electrode and BMS design, and enhancing recycling systems to leverage anthropogenic stocks. As LiFePO4 battery technology evolves, continuous monitoring of resource depletion impacts will be vital for aligning with circular economy principles and ensuring long-term sustainability.
To further contextualize, the global shift towards electrification hinges on batteries like LiFePO4, making their resource profile a matter of strategic importance. This study contributes to the growing body of knowledge by demonstrating how different evaluation lenses can inform better practices. Future work could expand the system boundary to include use and end-of-life phases, or explore dynamic scenarios for resource availability. Ultimately, understanding and mitigating the resource depletion of LiFePO4 batteries is key to a sustainable energy future.