
The accumulation of dust and particulate matter on the surface of solar panels is a pervasive and economically significant challenge for photovoltaic (PV) systems, particularly in arid, semi-arid, and high-traffic regions. This deposition directly reduces the transmittance of light to the photovoltaic cells, leading to a measurable and often substantial decrease in power generation efficiency. Beyond the immediate power loss, persistent and uneven soiling can create localized hot spots, accelerate material degradation through corrosion, and contribute to long-term reliability issues. Traditional methods for assessing the soiling state of solar panels often rely on manual inspection, which is subjective, labor-intensive, and non-quantitative, or on indirect electrical measurements that require sophisticated monitoring hardware. This work presents a novel, intelligent framework for the direct recognition and quantitative analysis of dust accumulation on solar panels based on convolutional neural learning and visible-light image processing. By directly correlating the visual characteristics of a soiled panel with its performance loss, this method offers a pathway toward portable, automated, and highly efficient inspection and maintenance protocols for large-scale solar farms.
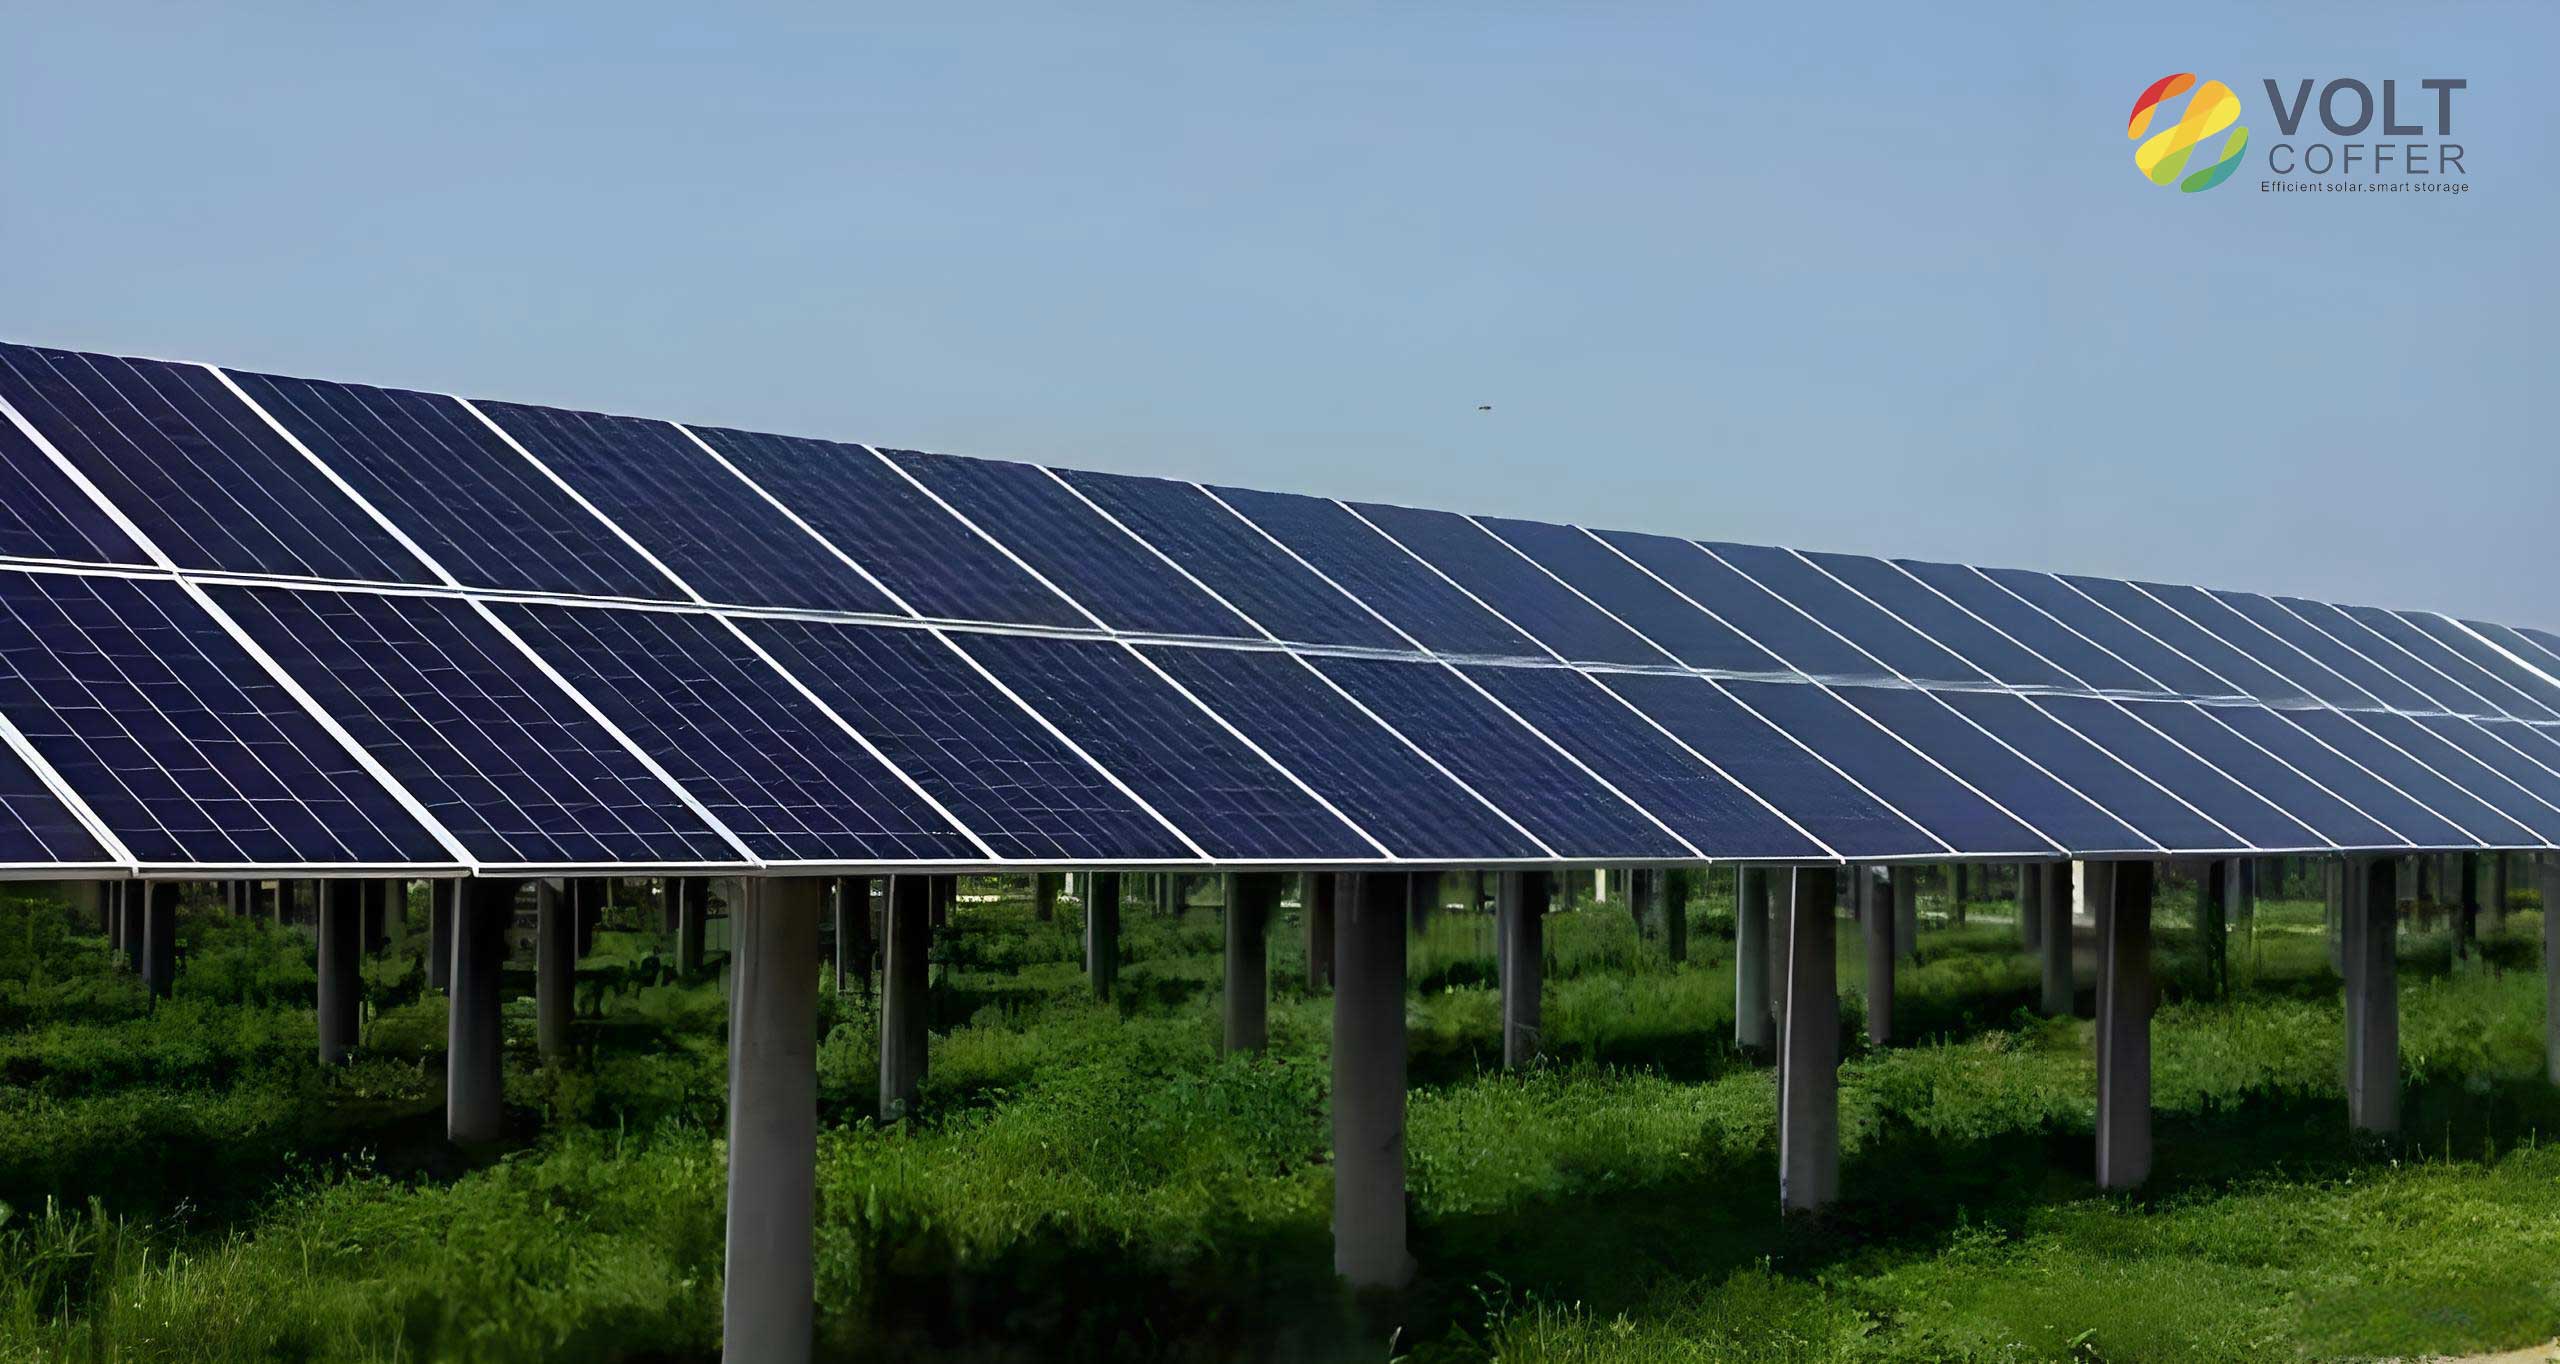
The fundamental premise of this approach lies in the distinct visual signature imparted by dust on solar panels. As particulates settle and adhere, they alter the color, texture, and reflectivity of the panel surface in a manner that correlates with the mass and distribution of the deposit. Common soiling patterns include loose, dry dust; agglomerated patches formed after partial cleaning by dew or light rain; and stubborn, cemented residues. A convolutional neural network (CNN), with its superior ability to automatically learn hierarchical spatial features from raw pixel data, is ideally suited to discern these subtle and complex patterns. Unlike conventional machine learning that requires manual feature engineering (e.g., extracting SIFT or HOG descriptors), a deep CNN learns a mapping directly from the input image to the target output—in this case, a soiling severity class or a continuous efficiency loss value. This end-to-end learning capability is crucial for developing robust models that can generalize across different lighting conditions, panel types, and dust compositions.
To implement and validate this methodology, a comprehensive field experimental system was established at a utility-scale solar power plant. The core components included standard polycrystalline silicon solar panels, a visible-light digital camera mounted to capture consistent images of the panel surface, an environmental monitoring station recording irradiance and ambient temperature, and precision electrical sensors measuring the current, voltage, and power output of the panel under test. A critical step in data preparation was the synchronization of each captured image with the corresponding electrical and environmental data at the moment of capture. The key metric for quantifying the impact of soiling is the power generation efficiency loss rate, denoted as \(\eta_{pl}\). This is derived by first calculating the efficiency under both real-world and idealized conditions. The instantaneous efficiency \(\eta\) is given by:
$$
\eta = \frac{P_m}{A_i \cdot P_{in}}
$$
where \(P_m\) is the measured output power (W), \(A_i\) is the area of the solar panel (m²), and \(P_{in}\) is the measured plane-of-array irradiance (W/m²). To ensure a fair comparison, the efficiency is normalized to a standard operating temperature to remove the thermal performance variance. The temperature-corrected efficiency \(\eta_{corr}\) can be expressed as:
$$
\eta_{corr} = \frac{P_m + P_{max} \cdot R \cdot (T_b – T_s)}{A_i \cdot P_{in}}
$$
Here, \(P_{max}\) is the rated maximum power, \(R\) is the power temperature coefficient (%/°C), \(T_b\) is the measured backsheet temperature, and \(T_s\) is the standard testing temperature (typically 45°C). The efficiency loss rate for a soiled panel is then defined relative to a clean baseline condition recorded at the start of the experiment:
$$
\eta_{pl} = 1 – \frac{\eta_{corr}^{dusty}}{\eta_{corr}^{clean}}
$$
Using this rigorous calculation, a high-quality dataset was constructed. Over a period of several months, images were collected and tagged with their computed \(\eta_{pl}\) values. The dataset was organized into 11 distinct classes, each representing a specific range of efficiency loss, from near-clean (\(\eta_{pl} \leq 4\%\)) to heavily soiled (\(\eta_{pl} \geq 16.6\%\)). This structured dataset, comprising 550 images (440 for training, 110 for testing), formed the foundation for training the deep learning models.
The architectural choice for the CNN is paramount. While standard networks like AlexNet or VGG-16 can be applied, the problem of “vanishing gradients” often impedes the training of very deep networks, limiting their performance. To overcome this, the study employed Residual Networks (ResNet). The core innovation of ResNet is the “residual block,” which learns a residual mapping \(F(x)\) instead of the desired underlying mapping \(H(x)\). If the input to a block is \(x\), the block learns \(F(x) = H(x) – x\), and its output is \(F(x) + x\). This simple “skip connection” or identity mapping allows gradients to flow directly backward through the network, enabling the stable training of models with tens or hundreds of layers (e.g., ResNet-50, ResNet-101). The residual learning process can be summarized for a single block as:
$$
\begin{aligned}
\text{Output} &= \mathcal{F}(x, \{W_i\}) + x \\
\text{where } \mathcal{F} & \text{ represents the learned residual transformation (e.g., two convolutional layers).}
\end{aligned}
$$
For this application, several ResNet variants were trained and compared: ResNet-18, ResNet-34, ResNet-50, and ResNet-101. The input layer of each network was adapted to accept the pre-processed solar panel images resized to 224×224 pixels. The models were trained to perform an 11-class classification task, predicting the soiling severity class from the input image. The training process involved standard techniques such as data augmentation (random cropping, flipping) and optimization using stochastic gradient descent with momentum.
The performance of the trained models was rigorously evaluated on the held-out test set. Standard metrics for classification tasks were employed: Precision, Recall, and the F1-Score (their harmonic mean). Furthermore, to assess the quantitative accuracy of the predicted efficiency loss, regression-oriented metrics like Root Mean Square Error (RMSE) and Mean Absolute Percentage Error (MAPE) were calculated by comparing the median efficiency loss of the predicted class against the true experimental value for each test image. The results clearly demonstrated the superiority of the deeper ResNet architectures for this specific task.
| Model | Precision (Test) | Recall (Test) | F1-Score (Test) | RMSE | MAPE |
|---|---|---|---|---|---|
| ResNet-18 | 0.75 | 1.00 | 0.85 | 2.90 | 1.97 |
| ResNet-34 | 0.81 | 1.00 | 0.90 | 1.62 | 0.65 |
| ResNet-50 | 0.81 | 1.00 | 0.90 | 0.69 | 0.33 |
| ResNet-101 | 0.72 | 1.00 | 0.84 | 0.95 | 0.68 |
The results indicate that while ResNet-34 and ResNet-50 achieved similar high precision and F1-scores, ResNet-50 distinguished itself with significantly lower error in quantifying the efficiency loss. Its RMSE of 0.69 and MAPE of 0.33 signify a highly accurate model capable of not just classifying but also reliably estimating the performance impact of dust on solar panels. In contrast, simpler models like AlexNet and VGG-16 performed poorly, failing to converge effectively during training, which underscores the complexity of the visual patterns associated with soiling and the need for advanced, deep architectures.
The physical interpretation of the model’s success lies in its ability to detect multi-scale features. Early layers in the CNN likely learn to identify low-level textures and edges corresponding to dust particles and their basic aggregation. Deeper layers combine these features to recognize higher-order patterns—such as the difference between a uniform layer of fine dust and clustered, patchy soiling—that correlate strongly with specific levels of light blockage and, consequently, power loss. This automated feature hierarchy extraction is far more powerful and consistent than any manual description of the soiling state.
The practical implications of this research are substantial for the operation and maintenance of solar power plants. A system built on this technology could involve drones or robotic crawlers equipped with standard cameras autonomously traversing solar arrays. As they capture images, an on-board or edge-computing system running the trained CNN model could instantly analyze each solar panel, providing a real-time soiling status map of the entire plant. This map would directly indicate which sections of solar panels are suffering significant efficiency losses and require cleaning, enabling targeted, cost-effective maintenance instead of costly whole-site cleaning on a fixed schedule. The formula linking the visual class to efficiency loss allows for a direct financial calculation of the soiling impact, aiding in ROI analyses for cleaning activities. Moreover, this non-contact, image-based method eliminates the need for installing and maintaining additional electrical sensors on every panel string for soiling detection, reducing system complexity and capital expense.
Future work to enhance this technology will focus on several key areas. Firstly, expanding the dataset to include a wider variety of conditions is crucial: different times of day (to account for varying solar angles and glare), diverse weather conditions (e.g., after rain, during high humidity), various types of solar panels (monocrystalline, thin-film), and geographically distinct soiling compositions (desert sand, industrial pollution, pollen, bird droppings). Secondly, exploring more advanced network architectures, such as DenseNet or attention-based models like Vision Transformers, may yield even higher accuracy and robustness. Thirdly, moving from a classification model to a direct regression model that predicts a continuous \(\eta_{pl}\) value could provide more granular insights. Finally, integrating this image-based analysis with other data streams—such as historical cleaning logs, weather forecasts, and energy yield data—within a plant-wide digital twin could facilitate predictive cleaning schedules, optimizing operational expenditure and maximizing the energy yield from vast fields of solar panels.
In conclusion, this work successfully demonstrates a novel and effective paradigm for the intelligent monitoring of solar panels. By leveraging the power of deep convolutional neural networks, specifically Residual Networks, we have established a direct, quantitative, and real-time link between the visual appearance of dust on solar panels and the resultant loss in power generation efficiency. This approach transcends the limitations of manual inspection and indirect electrical methods, paving the way for a new generation of automated, data-driven, and economically optimal operation and maintenance strategies for photovoltaic power plants, ultimately contributing to higher reliability and improved financial returns for solar energy investments.