
The global transition towards sustainable energy systems has intensified the focus on harnessing renewable resources, with solar photovoltaic (PV) technology standing at the forefront due to its maturity and scalability. Arid and semi-arid regions, characterized by abundant solar irradiance, vast available land, and minimal cloud cover, present ideal locations for large-scale, centralized solar power plants. The development of such infrastructure in these regions is not only a strategic energy initiative but also a significant socio-economic driver for local communities. However, the very attributes that make these lands attractive for solar energy—namely, their dryness and openness—also render them susceptible to frequent aeolian activity. The persistent presence of windblown sand and dust poses a substantial operational challenge, as particulate matter settles on the surfaces of solar panels, leading to a marked reduction in their power conversion efficiency. This efficiency loss primarily stems from two mechanisms: the attenuation of incoming solar radiation reaching the PV cells and the potential alteration of the panel’s thermal properties. Consequently, understanding the dynamics of dust accumulation and its quantifiable impact on performance is a critical research area for optimizing the design, maintenance, and economic viability of solar installations in desertified areas.
Previous research has extensively documented the detrimental effects of soiling. Studies have shown that even light dust layers can cause significant efficiency drops, with reports indicating reductions exceeding 35% after prolonged exposure without cleaning. The relationship between dust deposition density and power loss has been modeled as both linear and exponential, depending on particle properties and environmental conditions. Factors such as dust mineralogy, particle size distribution, humidity (which can lead to cementation), and the installation parameters of the panels themselves (tilt and azimuth angle) all play a complex role. While experimental field studies provide valuable real-world data, they are often time-consuming, costly, and subject to uncontrolled meteorological variables. Computational Fluid Dynamics (CFD) simulations offer a powerful complementary tool, enabling the detailed investigation of airflow patterns and particle trajectories around solar panel geometries under controlled, repeatable conditions. This allows for the systematic analysis of how factors like wind speed, particle size, and panel tilt angle influence deposition patterns. However, a comprehensive approach that links high-fidelity CFD simulations of deposition to predictive models for optical transmittance loss is essential for developing accurate soiling forecasts and mitigation strategies.
This study employs a three-dimensional CFD simulation framework to investigate the deposition of windblown sand particles on the surface of an inclined solar panel. The primary objectives are: (1) to simulate the turbulent airflow and particle transport around a panel for various installation tilt angles, (2) to quantify the mass of deposited sand as a function of incoming dust concentration, particle size, and panel tilt, and (3) to utilize the simulated deposition data to predict the consequent degradation in the optical transmittance of the panel’s protective glass layer. By integrating fluid dynamics with optical modeling, this work aims to provide a mechanistic understanding of the soiling process and its direct impact on the light-harvesting capability of solar panels in windy, sandy environments.
Numerical Methodology and Computational Model
The foundation of this analysis is a numerical simulation of the coupled air-sand flow around a solar panel structure. The commercial CFD software ANSYS Fluent was used to solve the governing equations of fluid flow and discrete particle motion.
Governing Equations for Fluid Flow
The wind field is treated as a three-dimensional, incompressible, turbulent flow. The time-averaged conservation equations for mass and momentum (the Reynolds-Averaged Navier-Stokes, or RANS, equations) are solved. The standard k-ε turbulence model is employed for closure, as it provides a robust and computationally efficient framework for simulating the separated flows expected behind the inclined panel. The governing equations are:
Continuity Equation:
$$ \frac{\partial \bar{u}_i}{\partial x_i} = 0 $$
Momentum Equation (RANS):
$$ \frac{\partial (\rho \bar{u}_i)}{\partial t} + \frac{\partial (\rho \bar{u}_i \bar{u}_j)}{\partial x_j} = -\frac{\partial \bar{p}}{\partial x_i} + \frac{\partial}{\partial x_j}\left(\mu \frac{\partial \bar{u}_i}{\partial x_j} – \rho \overline{u’_i u’_j}\right) $$
where \( \bar{u}_i \) and \( \bar{p} \) are the mean velocity and pressure components, \( \rho \) is the fluid density, \( \mu \) is the dynamic viscosity, and \( -\rho \overline{u’_i u’_j} \) is the Reynolds stress tensor, modeled using the eddy-viscosity hypothesis.
Standard k-ε Turbulence Model:
$$ \frac{\partial (\rho k)}{\partial t} + \frac{\partial (\rho k \bar{u}_i)}{\partial x_i} = \frac{\partial}{\partial x_j}\left[\left(\mu + \frac{\mu_t}{\sigma_k}\right)\frac{\partial k}{\partial x_j}\right] + G_k – \rho \epsilon $$
$$ \frac{\partial (\rho \epsilon)}{\partial t} + \frac{\partial (\rho \epsilon \bar{u}_i)}{\partial x_i} = \frac{\partial}{\partial x_j}\left[\left(\mu + \frac{\mu_t}{\sigma_\epsilon}\right)\frac{\partial \epsilon}{\partial x_j}\right] + C_{1\epsilon} \frac{\epsilon}{k} G_k – C_{2\epsilon} \rho \frac{\epsilon^2}{k} $$
Here, \( k \) is the turbulent kinetic energy, \( \epsilon \) is its dissipation rate, \( \mu_t = \rho C_\mu k^2 / \epsilon \) is the turbulent eddy viscosity, and \( G_k \) represents the generation of turbulent kinetic energy due to mean velocity gradients. The model constants have their standard values: \( C_\mu = 0.09 \), \( C_{1\epsilon} = 1.44 \), \( C_{2\epsilon} = 1.92 \), \( \sigma_k = 1.0 \), \( \sigma_\epsilon = 1.3 \).
Particle Tracking and Deposition Model
The sand particles are modeled as a discrete phase injected into the continuous air flow. Particle trajectories are computed by integrating the force balance on each particle, which in a Lagrangian framework is dominated by drag and gravity forces (other forces like Saffman lift and Brownian motion are considered negligible for the particle sizes studied):
$$ \frac{d\vec{u}_p}{dt} = \frac{18\mu}{\rho_p d_p^2} \frac{C_D Re_p}{24} (\vec{u} – \vec{u}_p) + \vec{g} $$
where \( \vec{u}_p \) is the particle velocity, \( \rho_p \) is the particle density (taken as 2650 kg/m³ for quartz sand), \( d_p \) is the particle diameter, \( \vec{u} \) is the fluid velocity, \( \vec{g} \) is gravitational acceleration, \( Re_p \) is the particle Reynolds number, and \( C_D \) is the drag coefficient. The stochastic Discrete Random Walk (DRW) model is used to account for the effect of turbulent fluctuations on particle dispersion. A particle is considered deposited when its trajectory intersects the solar panel surface, and its calculated “stick” condition (based on local flow conditions and surface properties) is met. For this study, a “trap” boundary condition is applied at the panel surface, meaning all particles impacting the surface are assumed to be captured, representing a “worst-case” or high-adhesion scenario common in dry, electrostatic conditions.
Computational Domain, Mesh, and Boundary Conditions
A simplified three-dimensional model was constructed, consisting of a flat, rectangular plate representing a single solar panel module. The panel dimensions were 1.6 m (width) x 3.2 m (length) with a thickness of 0.04 m. The panel was elevated 0.5 m (H) above the ground to represent a typical mounting configuration. To ensure flow development and minimize the influence of boundary conditions, the computational domain was significantly extended around the panel, following best-practice guidelines for building aerodynamics. The domain dimensions were 32H (length) x 10H (width) x 12H (height), with the panel placed 8H from the velocity inlet. This setup allows for the full development of the turbulent boundary layer upstream and the wake downstream of the panel.
A structured, hexahedral mesh was generated for the entire domain. Critical regions, especially around the panel surfaces and in the near wake, were highly refined to resolve the steep velocity gradients and vortex structures. A mesh independence study was conducted to ensure the results for key parameters like surface deposition mass and wake velocity profiles were not sensitive to further grid refinement.
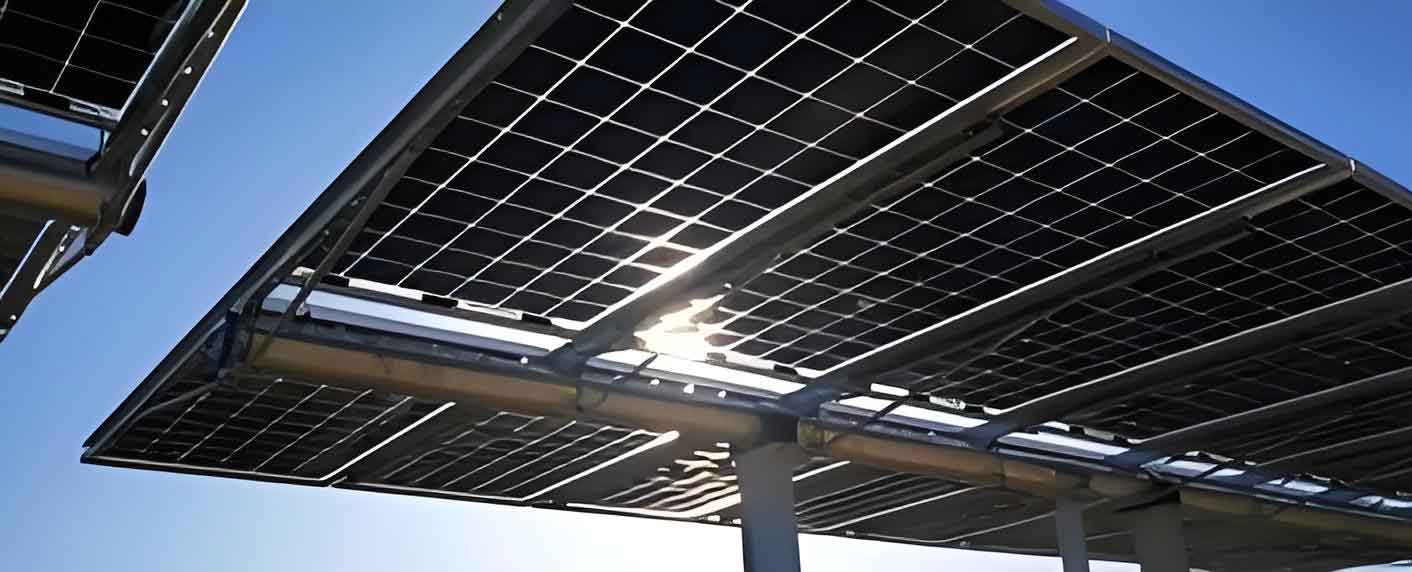
The figure above illustrates a typical photovoltaic panel module, highlighting the glass surface upon which dust accumulates. The boundary conditions applied were:
- Inlet: A velocity inlet with a logarithmic wind profile to simulate the atmospheric boundary layer: \( U(z) = \frac{u_*}{\kappa} \ln\left(\frac{z+z_0}{z_0}\right) \), where \( u_* \) is the friction velocity, \( \kappa=0.41 \) is the von Kármán constant, and \( z_0 = 0.0025 \) m is the aerodynamic roughness length. A turbulence intensity of 5% was specified.
- Outlet: A pressure outlet with zero gauge pressure.
- Ground and Panel Surfaces: No-slip wall boundary conditions. The ground was assigned a roughness consistent with \( z_0 \).
- Top and Side Boundaries: Symmetry boundary conditions, simulating a free-slip condition appropriate for a domain large enough to not constrain the natural flow.
The particle injection at the inlet was defined as a surface injection with a specified particle size distribution and mass flow rate, derived from the target airborne sand volume fraction.
Parametric Study and Transmittance Model
A parametric study was designed to analyze the influence of key variables on the soiling of the solar panel. The base case panel tilt angle was set to 35°, a common optimal angle for annual yield in many mid-latitude regions. The following variations were simulated:
| Parameter | Values Studied | Purpose |
|---|---|---|
| Sand Volume Fraction at Inlet | 5 × 10⁻⁶ %, 5 × 10⁻⁵ %, 5 × 10⁻⁴ %, 5 × 10⁻³ % | To quantify deposition sensitivity to ambient dust concentration. |
| Sand Particle Diameter (dp) | 1, 10, 20, 30, 40, 50 μm | To analyze the role of particle size on transport and deposition. |
| Panel Tilt Angle (β) | 15°, 25°, 35°, 45°, 55°, 65°, 75° | To investigate the optimal tilt angle from a soiling minimization perspective. |
The total mass of sand deposited on the upward-facing (active) surface of the panel, \( M_s \), was calculated by summing the mass of all trapped particles.
To translate the simulated sand mass into a performance metric, an optical model was employed. The attenuation of light through a dusty glass cover is governed by the Lambert-Beer law, adapted for a layer of discrete particles. The effective transmittance (T) of the soiled solar panel cover glass can be expressed as:
$$ T = \exp\left(-\frac{3(1-\beta) M_s}{4 \rho_p r_v A}\right) $$
where \( M_s \) is the total deposited sand mass (kg), \( \rho_p \) is the sand density (kg/m³), \( A \) is the panel surface area (m²), \( r_v \) is the volumetric mean radius of the particles (m), and \( \beta \) is a dimensionless transparency coefficient of the sand particles themselves (accounting for the fact that they are not perfectly opaque). A value of \( \beta = 0.45 \) was used, based on literature for semi-transparent quartz particles. This model directly links the CFD output (\( M_s \)) to a key performance indicator—the fraction of light passing through the panel’s protective cover to the PV cells beneath.
Results and Discussion
Flow Field Characteristics and Vortex Structures
The simulated airflow around the inclined solar panel reveals complex vortex dynamics that fundamentally govern particle deposition patterns. For all tilt angles, the flow separates at the leading edge of the panel, creating a recirculation zone on the leeward (downwind) side. The size and intensity of this separation vortex are highly dependent on the tilt angle (β).
At low tilt angles (e.g., β = 15°-25°), the flow separation is mild. The wind velocity component parallel to the panel surface increases gradually from the leading edge (bottom) to the trailing edge (top), as shown in velocity profiles extracted along the panel centerline. The near-surface flow remains attached over most of the panel length, with a small, weak recirculation bubble confined to the immediate trailing edge region. This results in relatively lower shear stresses and a more uniform flow environment over the panel.
As the tilt angle increases to 35°-55°, the flow separation becomes more pronounced. A large, stable counter-rotating vortex forms in the wake, whose upstream influence extends over a significant portion of the panel’s leeward surface. The near-surface wind speed now exhibits a non-monotonic trend: it decreases sharply just after the leading edge due to the strong adverse pressure gradient, reaches a minimum within the influence zone of the separation vortex, and then slowly recovers towards the trailing edge as the flow reattaches. This low-velocity region directly above the panel surface acts as a “trapping zone,” significantly enhancing the residence time of particles and their probability of deposition via gravitational settling and turbulent diffusion.
At very high tilt angles (β > 65°), the panel presents a more bluff-body-like geometry. The separation point is fixed at the leading edge, and a large, unsteady wake dominates the lee side. While the recirculation is strong, the steep inclination also promotes stronger downward velocity components that can sweep particles off the surface. Furthermore, the effective frontal area exposed to the direct momentum of the wind is larger, potentially increasing shear-induced resuspension of already deposited particles.
Influence of Sand Concentration and Particle Size on Deposition
The mass of sand deposited on the solar panel surface exhibits a clear and strong dependence on the incoming sand concentration and the size of the particles. For a fixed panel tilt of 35° and a particle size of 10 μm, the relationship between the inlet sand volume fraction (α) and the deposited mass (\( M_s \)) was found to be effectively linear within the simulated range. This aligns with expectation, as the particle-phase is dilute, and inter-particle collisions are negligible. Doubling the concentration of sand in the wind essentially doubles the number flux of particles towards the panel, leading to a proportional increase in deposition under similar flow conditions. This linear relationship can be expressed as:
$$ M_s \propto \alpha $$
The influence of particle diameter (\( d_p \)) is more complex and non-linear, governed by the competing effects of particle inertia, gravitational settling, and response to turbulent fluctuations. For very fine particles (e.g., 1 μm), the dust behaves almost as a passive scalar, closely following the turbulent air flow. These particles have very low Stokes numbers, allowing them to navigate around the panel within the streamlines, resulting in minimal inertial impaction and very low deposition mass. As particle size increases to the 10-40 μm range, inertia becomes significant. Particles in this range cannot perfectly follow the abrupt flow turning around the panel edges and into the separation zone, leading to increased impaction on the windward face and enhanced gravitational settling within the low-velocity recirculation region on the leeward face. Consequently, the deposited mass increases sharply with diameter. However, for very large particles (50 μm and above), while their settling velocity is high, they also possess significant momentum. This can lead to a phenomenon of “splashing” or reduced adhesion upon impact, and they are also more likely to be carried by the main flow over the panel rather than being entrained into the recirculation zone. This often results in a peak deposition mass for an intermediate particle size. Our simulations for the 35° tilt confirmed this trend, showing a rapid increase in \( M_s \) from 1 to 20-30 μm, followed by a more gradual increase or a plateau towards 50 μm.
The deposition pattern across the panel surface was non-uniform. Consistently, the highest density of deposited sand was found near the leading edge (bottom edge for a tilted panel). This is the primary region of inertial impaction. Deposition decreased along the length of the panel towards the trailing edge (top), with the lowest density observed in the central to upper regions on the leeward side, which are primarily influenced by turbulent diffusion and settling from the recirculating flow.
Critical Role of Solar Panel Tilt Angle
The installation tilt angle (β) emerged as a paramount factor controlling the total soiling accumulation on the solar panel. The simulated deposited sand mass, \( M_s(\beta) \), for a constant inlet concentration and particle size (10 μm), displayed a distinct non-monotonic behavior.
At a shallow tilt of 15°, deposition was relatively low. The panel’s near-horizontal orientation minimizes gravitational settling perpendicular to its surface and presents a streamlined profile to the wind, resulting in weak flow separation and limited particle trapping.
As the tilt increased to 25° and 35°, \( M_s \) rose steadily. The growing inclination enhances the normal component of gravity, pulling particles towards the surface. Simultaneously, the developing leeward vortex, as described earlier, creates an extended low-velocity recirculation zone that effectively “captures” particles. These particles settle under gravity within this quasi-stagnant region, leading to increased accumulation.
The maximum deposition mass in our simulations occurred at a tilt angle of approximately **50°**. At this angle, the synergy between gravitational settling and the now fully developed, robust separation vortex is optimal for trapping and retaining sand particles. The vortex is strong and deep, covering most of the panel’s leeward side, while gravity acts almost directly perpendicular to the surface.
For tilt angles greater than 50°, the total deposited mass began to decline. While gravity remains strong, the flow dynamics change significantly. The panel becomes more vertical, and the separation vortex, though large, becomes more unstable. More importantly, the increased windward face exposure leads to higher surface shear stresses. This can prevent initial deposition or even cause erosion (resuspension) of already deposited fine particles. Additionally, the steep angle may allow larger particles to slide off. Therefore, despite potentially high inertial impaction on the windward face, the net retained mass decreases.
This finding has crucial practical implications. It suggests that the optimal tilt angle for maximizing energy yield in dusty environments is not necessarily the same as the tilt angle optimal for maximizing clean-sky irradiance capture. A trade-off exists where a slightly steeper or shallower angle than the ideal “solar” angle might significantly reduce soiling rates and cleaning frequency, thereby improving the long-term levelized cost of energy.
Prediction of Optical Transmittance Loss
Applying the optical transmittance model (Equation 7) to the simulated deposition data allows for a direct prediction of the soiling-induced performance loss. The transmittance (T) represents the fraction of incident light that passes through the soiled glass to the PV cells. A clean glass cover typically has a T > 0.90. The soiling loss in percentage is given by \( (1 – T) \times 100\% \).
As the deposited mass \( M_s \) is the primary variable in the transmittance formula, the trends for T directly mirror those for \( M_s \).
- Vs. Concentration: Transmittance decreases exponentially with increasing deposited mass, which itself increases linearly with inlet concentration. Therefore, T shows a near-exponential decay with ambient dust concentration under constant meteorological conditions.
- Vs. Particle Size: For a given mass, finer particles cause greater light attenuation because they cover a larger total surface area and scatter light more effectively. However, since \( M_s \) itself depends strongly on \( d_p \), the net effect on T is a combined one. Our calculations showed that the most severe transmittance loss for the simulated conditions often corresponded to the particle size range that also yielded high deposition mass (e.g., 20-40 μm).
- Vs. Tilt Angle: This relationship is of particular interest. Since \( M_s(\beta) \) peaks at β ≈ 50°, the transmittance \( T(\beta) \) reaches its minimum (maximum soiling loss) at this same critical angle. For the simulated scenario with 10 μm particles and a volume fraction of 5×10⁻⁴%, the transmittance dropped from approximately 0.880 at 15° tilt to a minimum of about 0.866 at 50° tilt, before recovering to around 0.878 at 75° tilt. This represents a relative increase in optical loss of over 15% at the worst-case tilt compared to the shallowest angle. The relationship is summarized below:
| Panel Tilt Angle (β) | Trend in Deposition Mass (Ms) | Trend in Optical Transmittance (T) | Implied Soiling Loss |
|---|---|---|---|
| Low (15°-35°) | Moderate, Increasing | Moderate, Decreasing | Moderate |
| Critical (~50°) | Maximum | Minimum | Maximum |
| High (65°-75°) | Reduced | Recovered | Reduced |
This non-linear relationship between installation angle and soiling-derived transmittance loss provides a valuable design guideline. It quantitatively supports the hypothesis that adjusting the tilt angle, possibly seasonally, could be a passive, low-cost strategy to mitigate soiling in specific wind and dust conditions.
Conclusions and Implications for Solar Panel Deployment
This numerical investigation has provided detailed insights into the mechanisms of windblown sand accumulation on inclined solar panels and its direct consequence on light transmission. The key findings are:
- Flow-Driven Deposition Patterns: The leeward separation vortex is the dominant flow feature governing dust accumulation on the panel’s active surface. Its strength and extent, which vary with panel tilt, create low-velocity zones that enhance particle settling and retention.
- Parametric Dependencies: The mass of deposited sand on a solar panel increases linearly with the airborne sand concentration. It exhibits a strong, non-linear dependence on particle size, typically peaking for particles in the 20-40 μm range for common wind speeds due to optimal inertia and settling dynamics. The most critical finding is the non-monotonic relationship with panel tilt angle, with a distinct maximum deposition occurring at an angle around 50° under the simulated conditions.
- Transmittance Degradation: The optical transmittance loss of the solar panel cover glass, calculated via an adapted Lambert-Beer model, directly follows the deposition mass trends. Consequently, the soiling-induced power loss is also predicted to be most severe at the specific tilt angle that maximizes dust accumulation, which may not coincide with the tilt for optimal annual solar insolation.
The implications for the planning and operation of solar power plants in arid, windy regions are significant. This work suggests that:
- Site-Specific Tilt Optimization: The ideal fixed tilt angle for a solar farm should be determined by considering both the clean-sky solar geometry and the local wind-driven soiling potential. A multi-objective optimization could yield a tilt that sacrifices a small amount of ideal irradiance capture for a substantial reduction in soiling rate and associated water/cleaning costs.
- Seasonal Adjustments: For systems with seasonal tilt adjustment (e.g., in sun-tracking or seasonally-adjusted fixed-tilt systems), the soiling-prone angle (near 50° in this study) should be avoided during periods of high wind and dust activity, if other constraints allow.
- Predictive Maintenance: The models developed can be integrated with local meteorological and dust monitoring data to create predictive soiling forecasts. This enables proactive cleaning schedules, optimizing the timing of cleaning operations to just before predicted efficiency losses reach an economic threshold, thereby maximizing energy production and minimizing operational expenses.
Future work should expand this analysis to include more complex scenarios, such as the effect of wind direction (yaw angle), multiple panel rows with mutual shading and wake interference, the role of humidity and particle adhesion/cohesion models, and the validation of these simulation results against long-term field data from operational solar plants in desert environments. Nevertheless, this study establishes a robust computational framework for evaluating and mitigating one of the most persistent challenges facing solar energy generation in some of the world’s most resource-rich regions.