
Perovskite solar cells have emerged as a leading technology in the photovoltaic landscape due to their exceptional performance metrics, including tunable bandgaps, high absorption coefficients, and cost-effective fabrication processes. Despite rapid advancements, optimizing the power conversion efficiency (PCE) of perovskite solar cells remains challenging due to the complex interplay of numerous synthesis parameters. Traditional experimental approaches often rely on time-consuming trial-and-error methods, which hinder the pace of innovation. To address this, we propose a machine learning-driven framework that leverages experimental data to predict PCE and identify critical factors influencing performance. By integrating Shapley Additive Explanations (SHAP) for model interpretability, this approach not only accelerates the optimization process but also provides actionable insights for designing high-efficiency perovskite solar cells.
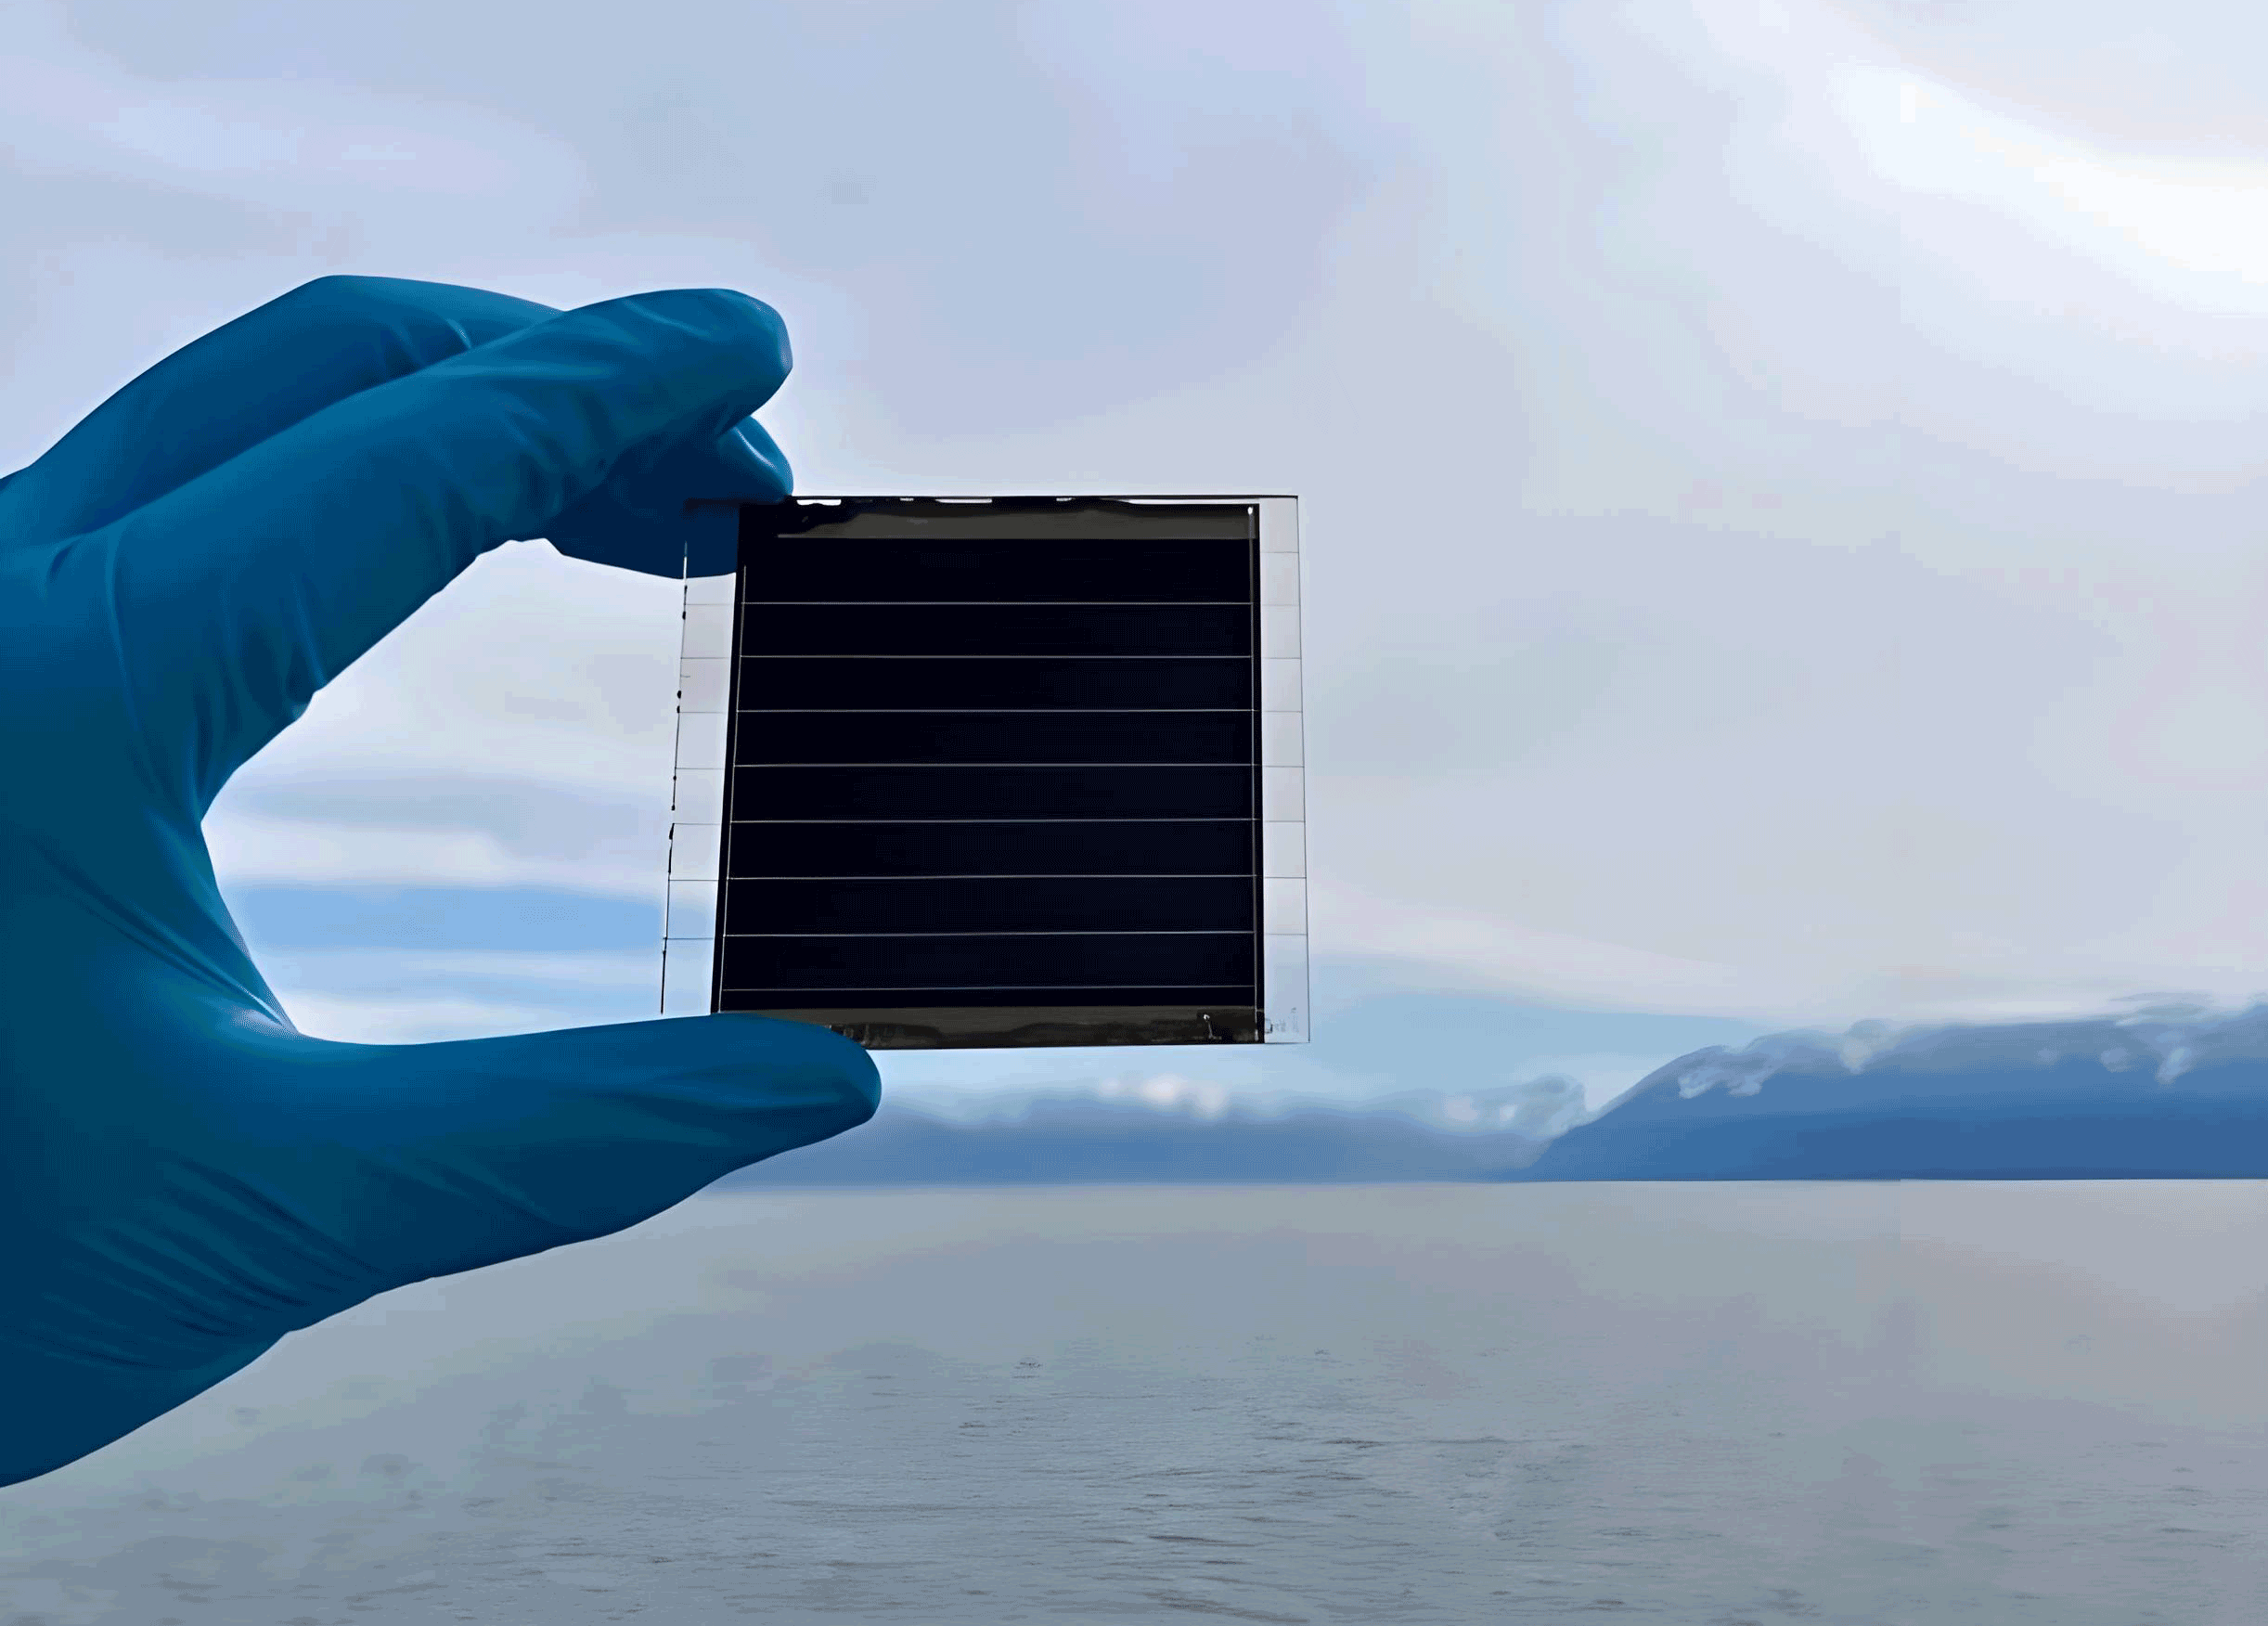
The integration of machine learning in materials science has revolutionized the discovery and optimization of functional materials, including perovskite solar cells. Machine learning algorithms can analyze high-dimensional datasets to uncover non-linear relationships between synthesis conditions and device performance, thereby reducing the experimental burden. In this study, we focus on wide-bandgap perovskite solar cells (with a bandgap of 1.65 eV), which are critical for tandem solar cell applications. We curated a dataset comprising 869 experimental records, each characterized by 66 features encompassing discrete and continuous variables related to synthesis parameters. The primary goal is to predict whether a given set of conditions will yield a high PCE (defined as PCE > 18.5%) or low PCE (PCE ≤ 18.5%), thus enabling targeted experimentation.
Data preprocessing is a crucial step in ensuring model reliability. The dataset was rigorously cleaned to remove outliers and inconsistencies. Features such as open-circuit voltage (Voc), short-circuit current density (Jsc), fill factor (FF), and illumination intensity were excluded to prevent data leakage and ensure that predictions are based solely on synthesis parameters. Categorical features, such as the type of passivation material, were encoded using one-hot encoding to avoid imposing artificial ordinal relationships. Continuous features, including coating speed and dilution volume, were normalized using min-max scaling to mitigate the influence of varying scales on model performance. The dataset was split into training (80%) and testing (20%) sets using stratified sampling to maintain class distribution. To address class imbalance, the Synthetic Minority Over-sampling Technique (SMOTE) combined with Tomek links was applied to the training set, enhancing the model’s ability to generalize across both high and low PCE categories.
Feature engineering was employed to identify the most influential parameters affecting perovskite solar cell performance. We computed feature importance using the Random Forest algorithm, which evaluates the contribution of each feature based on the Gini impurity reduction during tree splits. The Pearson correlation coefficient (PCC) was used to assess inter-feature correlations, and features with a PCC magnitude exceeding 0.65 were removed to avoid multicollinearity. The PCC between each feature and PCE was also analyzed to ensure selected features exhibit minimal linear dependence on the target variable. Recursive Feature Elimination (RFE) was subsequently applied to refine the feature set by iteratively removing the least important features based on model performance metrics such as mean squared error (MSE). The final set of eight key features is summarized in Table 1.
| Feature Name | Description | Type |
|---|---|---|
| nP_DV | Perovskite dilution volume | Continuous |
| nP_CS | Perovskite coating speed | Continuous |
| nP_IPC | Perovskite intrinsic passivation concentration | Continuous |
| nS_CAT | SAM clean anneal time | Continuous |
| cP_IIsPM_MI | Use of MDAI2 as intrinsic passivation material | Categorical |
| cP_IIsPM_MBr | Use of MDABr2 as intrinsic passivation material | Categorical |
| cP_IIfPM_MI | Use of MDAI2 as interface passivation material | Categorical |
| nP_SPAT2 | Perovskite submerged passivation anneal time 2 | Continuous |
Multiple machine learning algorithms were evaluated for PCE prediction, including Logistic Regression (LR), Random Forest (RF), Support Vector Machine (SVM), K-Nearest Neighbors (KNN), Gradient Boosting (GB), and Extreme Gradient Boosting (XGBoost). Each model was trained using 5-fold cross-validation to ensure robustness and mitigate overfitting. Hyperparameter tuning was performed using the Optuna framework, which employs Bayesian optimization to efficiently explore the hyperparameter space. The performance of each model was assessed using accuracy (Acc), precision (Pre), recall (Rec), F1-score (F1), and area under the receiver operating characteristic curve (Auc). The formulas for these metrics are as follows:
$$Acc = \frac{N_{TP} + N_{TN}}{N_{TP} + N_{TN} + N_{FP} + N_{FN}}$$
$$Pre = \frac{N_{TP}}{N_{TP} + N_{FP}}$$
$$Rec = \frac{N_{TP}}{N_{TP} + N_{FN}}$$
$$F1 = 2 \times \frac{Pre \times Rec}{Pre + Rec}$$
The Auc was computed numerically by integrating the ROC curve using the trapezoidal rule. The comparative performance of the models is summarized in Table 2, where the Gradient Boosting (GB) model demonstrated superior performance across multiple metrics, achieving a balanced trade-off between precision and recall.
| Model | Acc | Pre | Rec | F1 | Auc |
|---|---|---|---|---|---|
| LR | 0.684 | 0.692 | 0.701 | 0.696 | 0.734 |
| RF | 0.712 | 0.718 | 0.725 | 0.721 | 0.768 |
| SVM | 0.698 | 0.705 | 0.713 | 0.709 | 0.749 |
| KNN | 0.675 | 0.683 | 0.691 | 0.687 | 0.728 |
| GB | 0.741 | 0.748 | 0.756 | 0.752 | 0.790 |
| XGBoost | 0.730 | 0.737 | 0.744 | 0.740 | 0.781 |
The GB model was selected for further analysis due to its exceptional performance. Feature importance analysis using the GB model revealed that perovskite dilution volume (nP_DV) and coating speed (nP_CS) were the most influential parameters, contributing 39.16% and 24.50% to the model’s predictions, respectively. The intrinsic passivation concentration (nP_IPC) and SAM clean anneal time (nS_CAT) also played significant roles, with contributions of 17.45% and 14.45%. The categorical features related to passivation materials (cP_IIsPM_MI and cP_IIsPM_MBr) had smaller but non-negligible impacts, suggesting that the choice of passivation material requires careful optimization in conjunction with concentration parameters.
To interpret the GB model’s decisions, we employed SHAP analysis, which quantifies the contribution of each feature to individual predictions based on cooperative game theory. The SHAP value for a feature represents the average marginal contribution of that feature across all possible feature combinations. The summary plot of SHAP values (Figure 1) illustrates the impact of each feature on the model output, where positive SHAP values indicate a tendency towards high PCE predictions, and negative values suggest a push towards low PCE. For instance, high values of nP_CS (shown in red) were associated with negative SHAP values, implying that excessive coating speed may detrimentally affect PCE. Similarly, nP_DV exhibited a non-linear relationship, with both very high and very low values leading to reduced PCE. In contrast, shorter nS_CAT values were generally beneficial, as indicated by their positive SHAP contributions.
The SHAP dependence plots further elucidated the interactions between features. For example, the effect of nP_IPC on PCE was modulated by the type of passivation material used. When MDAI2 was employed as an intrinsic passivation material (cP_IIsPM_MI), moderate nP_IPC values yielded the highest SHAP values, whereas extreme concentrations led to performance degradation. This highlights the importance of synergistic optimization of multiple parameters in perovskite solar cell fabrication.
Guided by the SHAP analysis, we designed experimental conditions to validate the model’s predictions. The optimized parameters included a moderate coating speed (nP_CS), a specific dilution volume (nP_DV), and a tailored intrinsic passivation concentration (nP_IPC) using MDAI2. The resulting perovskite solar cell achieved a champion PCE of 21.81%, demonstrating the efficacy of the machine learning-driven approach. This represents a significant improvement over baseline experiments conducted under conventional conditions, which typically yielded PCE values below 20%. The current-voltage (J-V) characteristics and external quantum efficiency (EQE) spectrum of the champion device are shown in Figure 2, confirming the high performance and broad spectral response of the optimized perovskite solar cell.
The success of this framework underscores the potential of machine learning in accelerating the development of perovskite solar cells. By leveraging high-quality experimental data and advanced algorithms, we can identify optimal synthesis conditions with minimal experimental iterations. The interpretability afforded by SHAP analysis enables researchers to understand the underlying factors driving performance, facilitating targeted improvements. Future work will focus on expanding the dataset to include more diverse perovskite compositions and fabrication techniques, as well as incorporating deep learning models for enhanced predictive accuracy. Additionally, the integration of real-time data from in-situ characterization methods could further refine the optimization process.
In conclusion, this study presents a comprehensive machine learning framework for optimizing the performance of perovskite solar cells. Through meticulous data preprocessing, feature engineering, and model selection, we developed a robust predictive model that accurately identifies high-efficiency conditions. The insights derived from SHAP analysis provide a deeper understanding of the critical parameters influencing PCE, enabling more informed experimental design. This approach not only accelerates the development of perovskite solar cells but also serves as a blueprint for applying machine learning in other areas of materials science and renewable energy research.
The optimization of perovskite solar cells is a multifaceted challenge that involves balancing numerous synthesis parameters. Machine learning models, such as the Gradient Boosting algorithm used here, excel at capturing complex, non-linear relationships that are difficult to discern through traditional methods. The evaluation metrics used in this study ensure a comprehensive assessment of model performance. Accuracy provides a general measure of correctness, but in imbalanced datasets, precision and recall offer more nuanced insights. The F1-score harmonizes these two metrics, while the Auc evaluates the model’s ability to distinguish between classes across all thresholds. The formulas for these metrics are fundamental to interpreting model results:
$$Acc = \frac{N_{TP} + N_{TN}}{N_{TP} + N_{TN} + N_{FP} + N_{FN}}$$
$$Pre = \frac{N_{TP}}{N_{TP} + N_{FP}}$$
$$Rec = \frac{N_{TP}}{N_{TP} + N_{FN}}$$
$$F1 = 2 \times \frac{Pre \times Rec}{Pre + Rec}$$
The Auc is computed as the integral of the ROC curve, which plots the true positive rate against the false positive rate. A higher Auc indicates better model performance in classifying high and low PCE perovskite solar cells.
Feature selection is critical to avoid overfitting and improve model interpretability. The Pearson correlation coefficient (PCC) is calculated as:
$$r = \frac{\sum_{i=1}^{n} (X_i – \bar{X})(Y_i – \bar{Y})}{\sqrt{\sum_{i=1}^{n} (X_i – \bar{X})^2} \sqrt{\sum_{i=1}^{n} (Y_i – \bar{Y})^2}}$$
where \(X_i\) and \(Y_i\) are the values of features X and Y for the i-th sample, and \(\bar{X}\) and \(\bar{Y}\) are their respective means. A threshold of |r| > 0.65 was used to remove highly correlated features, ensuring that the model focuses on independent predictors.
The SHAP value for a feature i in a model f is given by:
$$\phi_i = \sum_{S \subseteq N \setminus \{i\}} \frac{|S|! (|N| – |S| – 1)!}{|N|!} [f(S \cup \{i\}) – f(S)]$$
where N is the set of all features, S is a subset of features excluding i, and f(S) is the model prediction for subset S. This formulation ensures that the contribution of each feature is fairly allocated across all possible feature combinations, providing a consistent and interpretable measure of feature importance.
In practice, the optimization of perovskite solar cells involves tuning continuous parameters such as coating speed and dilution volume, as well as selecting appropriate categorical variables like passivation materials. The machine learning model effectively handles both types of inputs, enabling a holistic optimization strategy. The following table summarizes the optimal ranges for key continuous features as identified by the SHAP analysis:
| Feature | Optimal Range | Impact on PCE |
|---|---|---|
| nP_CS | Medium to Low | Positive |
| nP_DV | Moderate | Non-linear |
| nP_IPC | Medium to High | Positive with saturation |
| nS_CAT | Short | Positive |
The categorical features related to passivation materials require careful consideration. The use of MDAI2 or MDABr2 as intrinsic passivation materials can enhance PCE, but their effectiveness depends on the concentration and other processing conditions. The machine learning model helps identify the optimal combinations, reducing the need for exhaustive experimentation.
In summary, the integration of machine learning and SHAP analysis provides a powerful toolkit for advancing perovskite solar cell technology. By transforming empirical data into actionable insights, this approach accelerates the discovery of high-performance materials and fabrication protocols. The continued refinement of these models, coupled with the expansion of experimental datasets, will further enhance their predictive power and applicability to a wider range of photovoltaic materials. The journey toward commercialization of perovskite solar cells benefits significantly from such data-driven methodologies, which reduce development time and costs while pushing the boundaries of efficiency and stability.