
Lithium iron phosphate (LiFePO4) batteries have emerged as a cornerstone technology for electric vehicles (EVs) due to their inherent safety, long cycle life, and thermal stability. This study systematically investigates the temperature-dependent electrochemical behavior of LiFePO4 batteries through comprehensive experimental protocols and advanced characterization techniques.
1. Experimental Methodology
1.1 Battery Fabrication
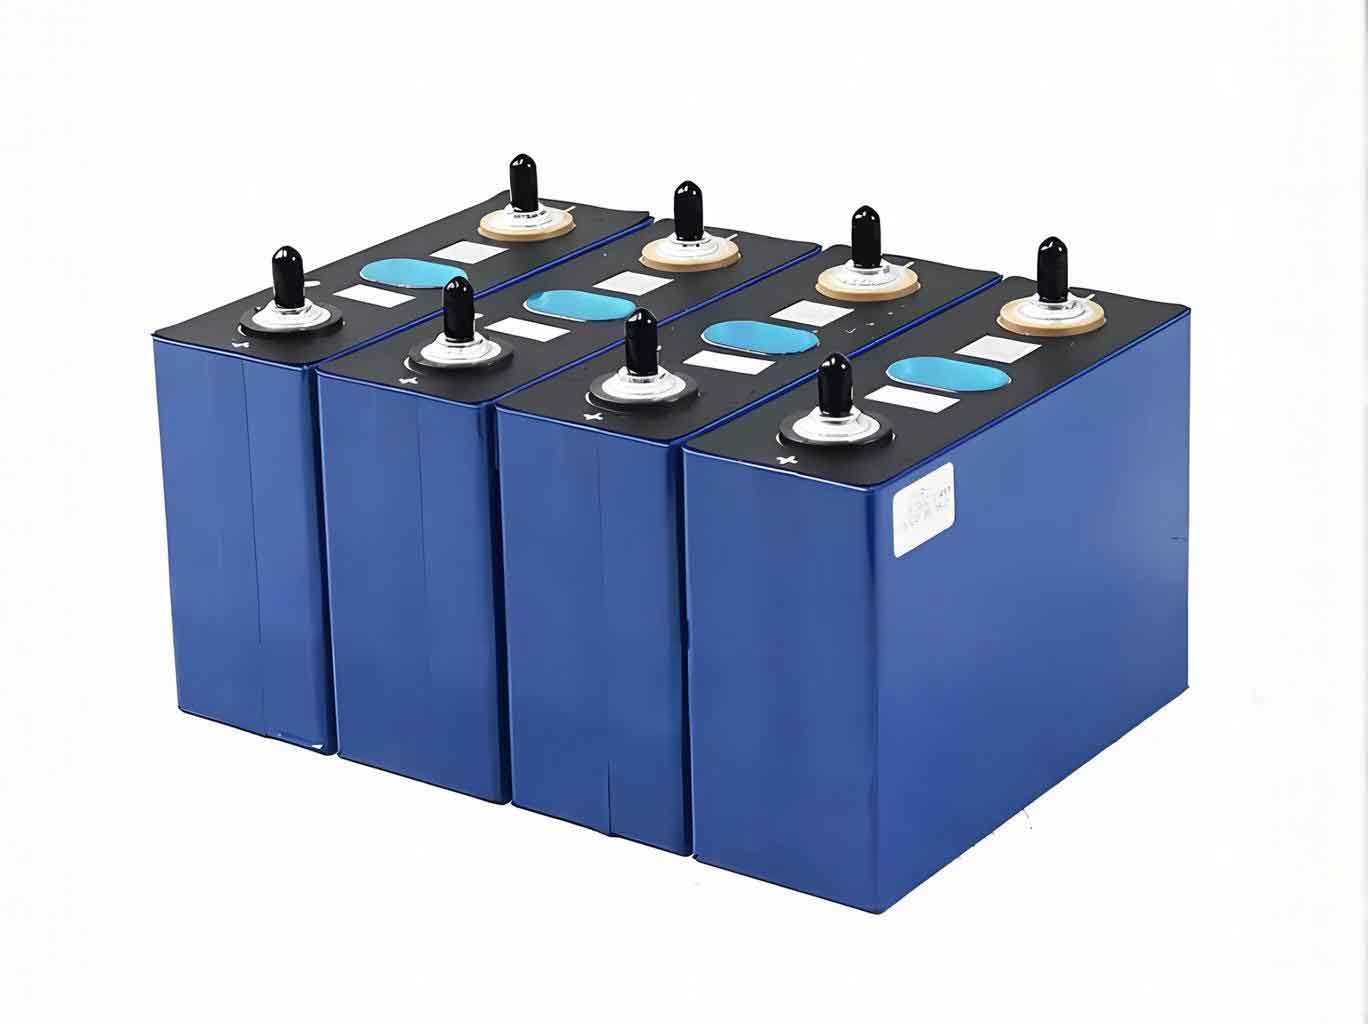
The lithium iron phosphate battery fabrication process comprised:
- Positive electrode: 85% LiFePO4, 12.5% conductive agent, 2.5% PVDF binder
- Negative electrode: Graphite composite on copper foil
- Electrolyte: Water-based formulation with KOH solution
1.2 Temperature Control System
The thermal management system maintained precise temperature conditions using:
| Component | Specification |
|---|---|
| Thermal Chamber | ±0.5°C accuracy |
| Heating Elements | 500W ceramic heaters |
| Cooling System | Peltier-based active cooling |
2. Performance Metrics Analysis
2.1 Capacity Retention
The lithium iron phosphate battery demonstrates temperature-dependent capacity characteristics:
$$ C(T) = C_0 \cdot e^{-\frac{E_a}{R}\left(\frac{1}{T}-\frac{1}{T_{ref}}\right)} $$
Where:
$C_0$ = Nominal capacity (Ah)
$E_a$ = Activation energy (kJ/mol)
$R$ = Universal gas constant
| Temperature (°C) | Capacity Retention (%) | Cycle Life (cycles) |
|---|---|---|
| -20 | 61.2 | 320 |
| 0 | 85.4 | 1,250 |
| 25 | 98.7 | 2,800 |
| 40 | 96.5 | 2,100 |
| 60 | 89.3 | 950 |
2.2 Impedance Characteristics
The lithium iron phosphate battery’s internal resistance follows Arrhenius behavior:
$$ R_{int}(T) = R_0 \cdot e^{\frac{E_b}{kT}} $$
Where:
$E_b$ = Barrier energy (eV)
$k$ = Boltzmann constant
2.3 Energy/Power Density
Key performance parameters for lithium iron phosphate batteries:
$$ \text{Energy Density } (E) = \frac{U_a \cdot I_t \cdot T}{M_{total}} $$
$$ \text{Power Density } (P) = \frac{U_a \cdot I_t}{M_{total}} $$
Where:
$U_a$ = Average discharge voltage (V)
$I_t$ = Total current (A)
$T$ = Discharge duration (h)
3. Temperature-Dependent Degradation Mechanisms
3.1 Low-Temperature Effects (-20°C to 0°C)
- Electrolyte viscosity increases by 300%
- Li+ diffusion coefficient decreases to 10-12 cm2/s
- Plating/stripping efficiency drops below 85%
3.2 Optimal Temperature Range (0°C to 40°C)
- Stable SEI formation with 0.02 nm/cycle growth rate
- Electrolyte conductivity maintains 12 mS/cm
- Coulombic efficiency > 99.5%
3.3 High-Temperature Effects (40°C to 80°C)
- Accelerated capacity fade (0.15%/cycle)
- Electrolyte decomposition rate increases 8x
- Active material dissolution > 5 wt.%
4. Advanced Characterization
4.1 Electrochemical Impedance Spectroscopy
The lithium iron phosphate battery impedance spectrum reveals three distinct regions:
| Frequency Range | Dominant Process | Typical Values |
|---|---|---|
| 10 kHz – 1 kHz | Ohmic resistance | 15-25 mΩ |
| 1 kHz – 1 Hz | Charge transfer | 50-80 mΩ |
| <1 Hz | Diffusion | 120-180 mΩ |
4.2 Differential Scanning Calorimetry
Thermal stability analysis of lithium iron phosphate battery components:
$$ \frac{dQ}{dt} = \frac{\Delta H}{m} \cdot \frac{d\alpha}{dt} $$
Where:
$\Delta H$ = Enthalpy change (J/g)
$\alpha$ = Conversion degree
5. Thermal Management Strategies
Optimal performance of lithium iron phosphate batteries requires:
- Active cooling during high-rate charging (>2C)
- Preheating below 10°C ambient temperature
- Thermal gradient control <5°C across cell surface
| Strategy | Energy Efficiency | Implementation Cost |
|---|---|---|
| Liquid Cooling | 92-95% | High |
| Phase Change Material | 85-88% | Medium |
| Air Cooling | 75-80% | Low |
6. Conclusion
The lithium iron phosphate battery demonstrates superior temperature adaptability within 0-40°C, maintaining:
- Capacity retention >95%
- Energy density >120 Wh/kg
- Cycle life >2,000 cycles
Advanced thermal management systems combined with optimized electrolyte formulations will further enhance the performance of lithium iron phosphate batteries in electric vehicle applications.