
This study investigates the lower explosion limit (LEL) prediction methods for thermal runaway products generated by lithium iron phosphate (LiFePO₄) batteries under different states of charge (SOC). A comprehensive analysis combining experimental measurements and theoretical modeling provides insights into gas composition dynamics and explosion risks.
1. Experimental Methodology
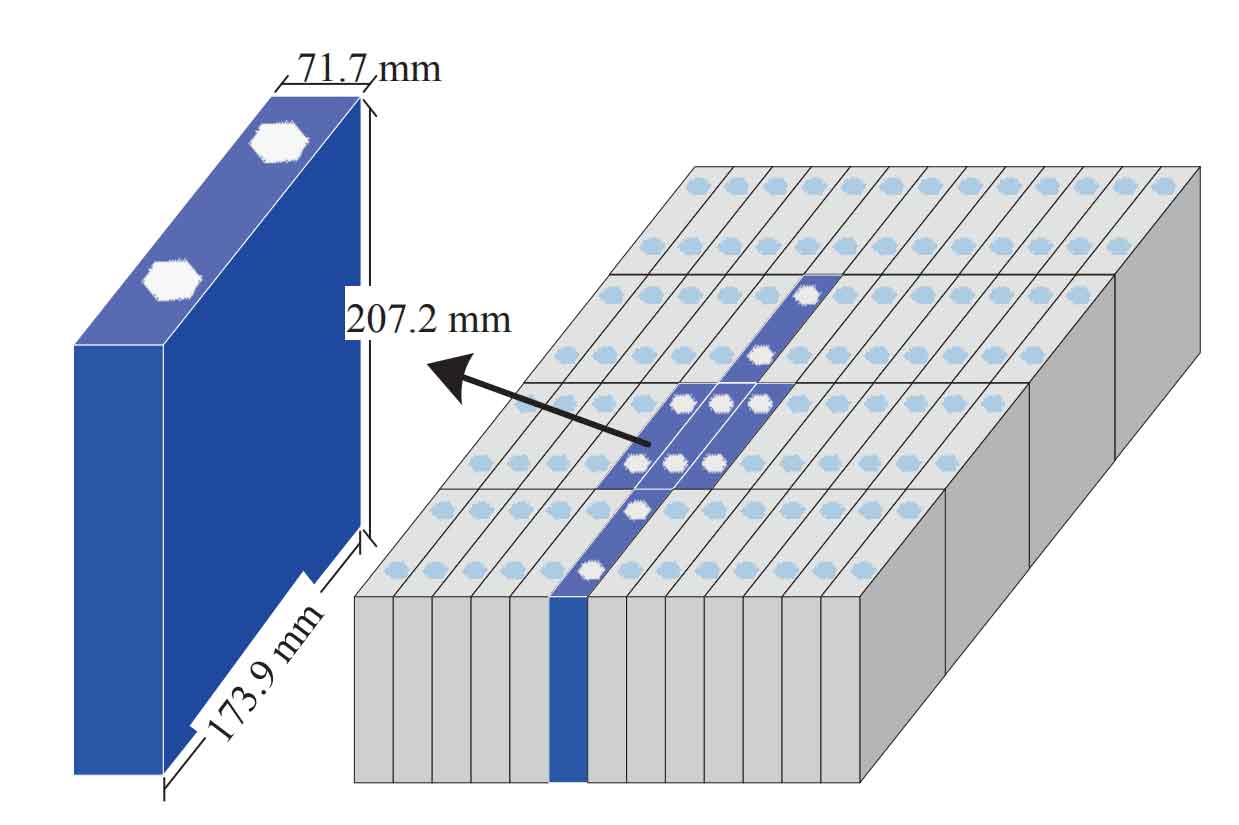
The 32135-type cylindrical lithium iron phosphate battery (32 mm diameter × 135 mm height) with graphite anode and DMC-based electrolyte was tested. Key parameters include:
| Parameter | Value |
|---|---|
| Nominal Capacity | 15 Ah |
| Operating Voltage | 3.2 V |
| Cycle Life | >2000 cycles |
The thermal runaway process was induced in a closed pressure vessel (5 MPa rating) with gas composition analyzed through GC-MS. Three distinct stages were identified:
$$ \frac{dT}{dt} \geq 1\,^{\circ}\text{C}/\text{s} \Rightarrow \text{Thermal Runaway Threshold} $$
2. Gas Production Analysis
The ideal gas law was applied to calculate vent gas quantities:
$$ pV = nRT $$
Key findings for 60-100% SOC lithium iron phosphate batteries:
| SOC (%) | H₂ (%) | CO (%) | CO₂ (%) | DMC (%) |
|---|---|---|---|---|
| 60 | 34.2 | 21.1 | 11.7 | 18.4 |
| 80 | 39.8 | 18.6 | 16.3 | 12.1 |
| 100 | 42.5 | 16.9 | 9.8 | 8.7 |
3. Explosion Limit Prediction Models
Three methods were evaluated for lithium iron phosphate battery gas mixtures:
3.1 Le Chatelier’s Law
$$ L_{mix} = \frac{1}{\sum \frac{x_i}{L_i}} $$
3.2 Adiabatic Flame Temperature Method
$$ \sum N_j \int_{T_0}^{T_a} C_{p,j} dT = \sum N_i \Delta H_{f,i}^0 – \sum N_j \Delta H_{f,j}^0 $$
3.3 Jones Method
Empirical adjustment for inert gas dilution:
$$ L_{adj} = L_{mix} \times \frac{100}{100 – B} $$
4. Results and Validation
Comparison of prediction methods for lithium iron phosphate battery vent gases:
| Method | 60% SOC LEL (%) | Error (%) |
|---|---|---|
| Experimental | 3.93 | – |
| Le Chatelier | 3.98 | 1.14 |
| Adiabatic Flame | 4.32 | 10.02 |
| Jones | 4.19 | 6.73 |
The lithium iron phosphate battery demonstrates unique SOC-dependent explosion characteristics:
$$ LEL_{min} = 3.93\%\ \text{(60% SOC with DMC)} $$
$$ LEL_{max} = 5.07\%\ \text{(80% SOC without DMC)} $$
5. Electrolyte Vapor Impact
Dimethyl carbonate (DMC) significantly affects explosion limits in lithium iron phosphate batteries:
$$ \Delta LEL = LEL_{gas} – LEL_{product} = 1.14\%\ \text{(average reduction)} $$
The time-dependent venting process explains SOC variations:
| SOC (%) | Venting Duration (s) | DMC Proportion (%) |
|---|---|---|
| 60 | 1279 | 18.4 |
| 100 | 502 | 8.7 |
6. Thermal Runaway Phase Analysis
Three distinct phases characterize lithium iron phosphate battery failure:
$$ \text{Phase I (Passive Heating)}: T < 167.4\,^{\circ}\text{C} $$
$$ \text{Phase II (Exponential Heating)}: 167.4\,^{\circ}\text{C} < T < 235.6\,^{\circ}\text{C} $$
$$ \text{Phase III (Runaway)}: T > 235.6\,^{\circ}\text{C} $$
The lithium iron phosphate battery exhibits dual gas release peaks corresponding to safety valve activation (DMC-dominated) and thermal runaway (combustible gas mixture).
7. Conclusion
This study establishes reliable prediction methods for lithium iron phosphate battery explosion risks:
- Le Chatelier’s method shows minimum error (1.14%) for LEL prediction
- DMC vapor reduces LEL by 22.49% at 60% SOC
- 80% SOC presents maximum explosion risk due to CO₂ dilution effects
The findings provide critical safety parameters for lithium iron phosphate battery applications in energy storage systems and electric vehicles, emphasizing the necessity of SOC-dependent safety protocols.